
記住我
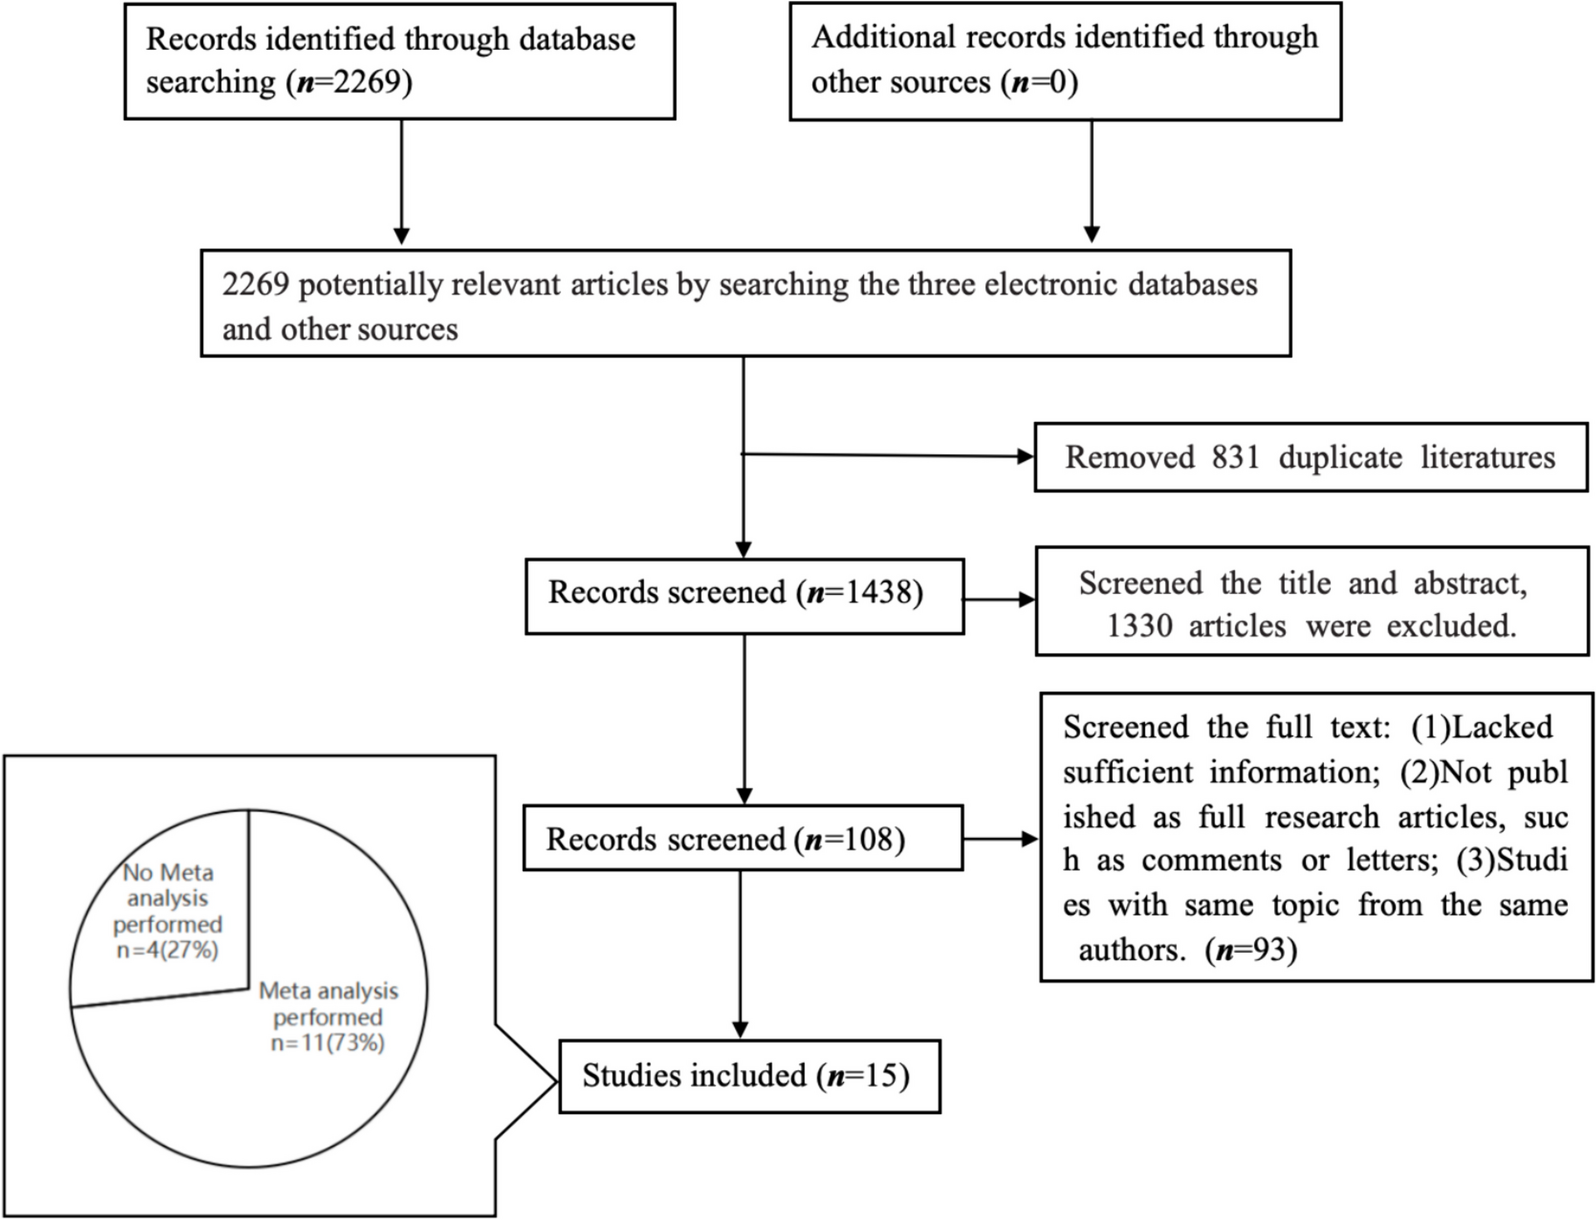
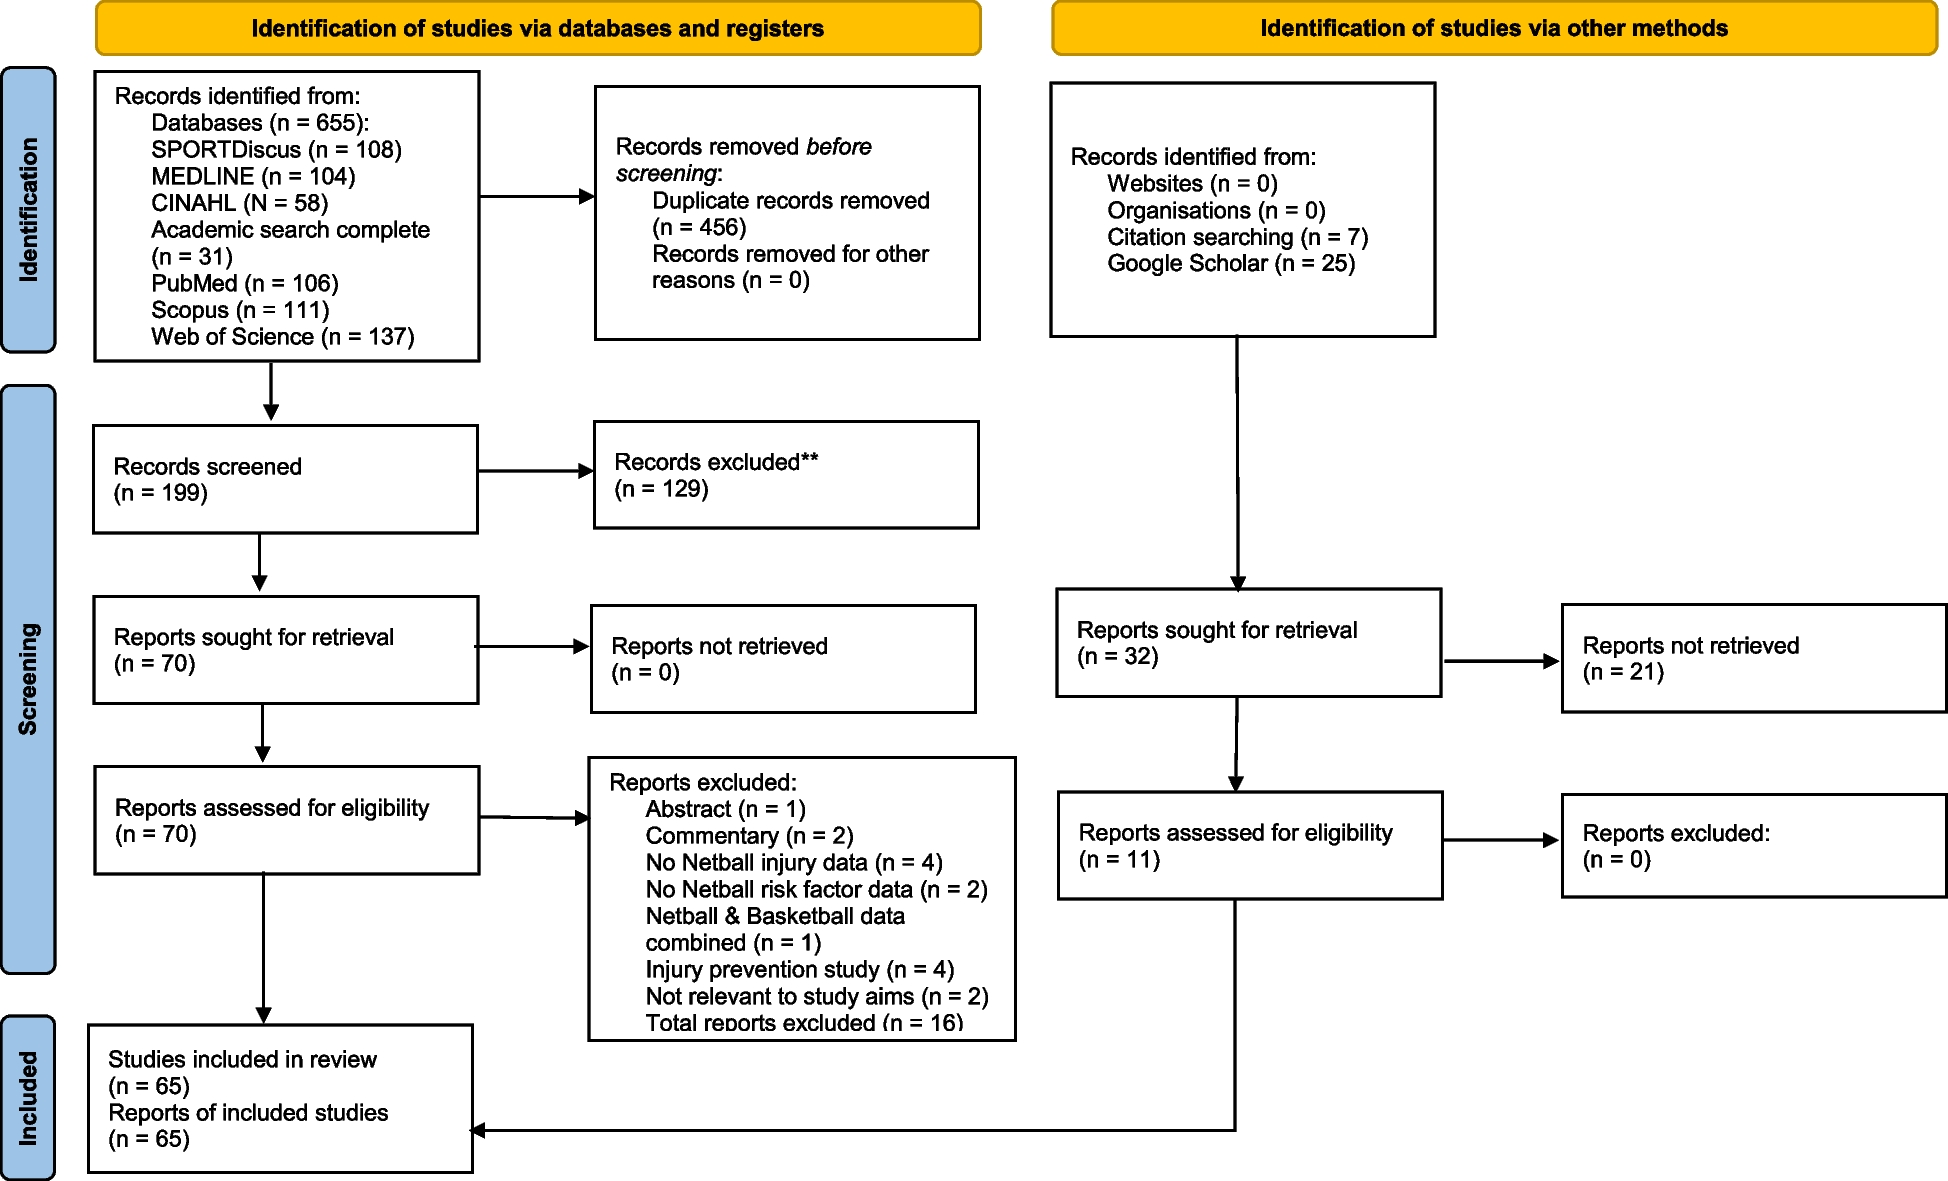
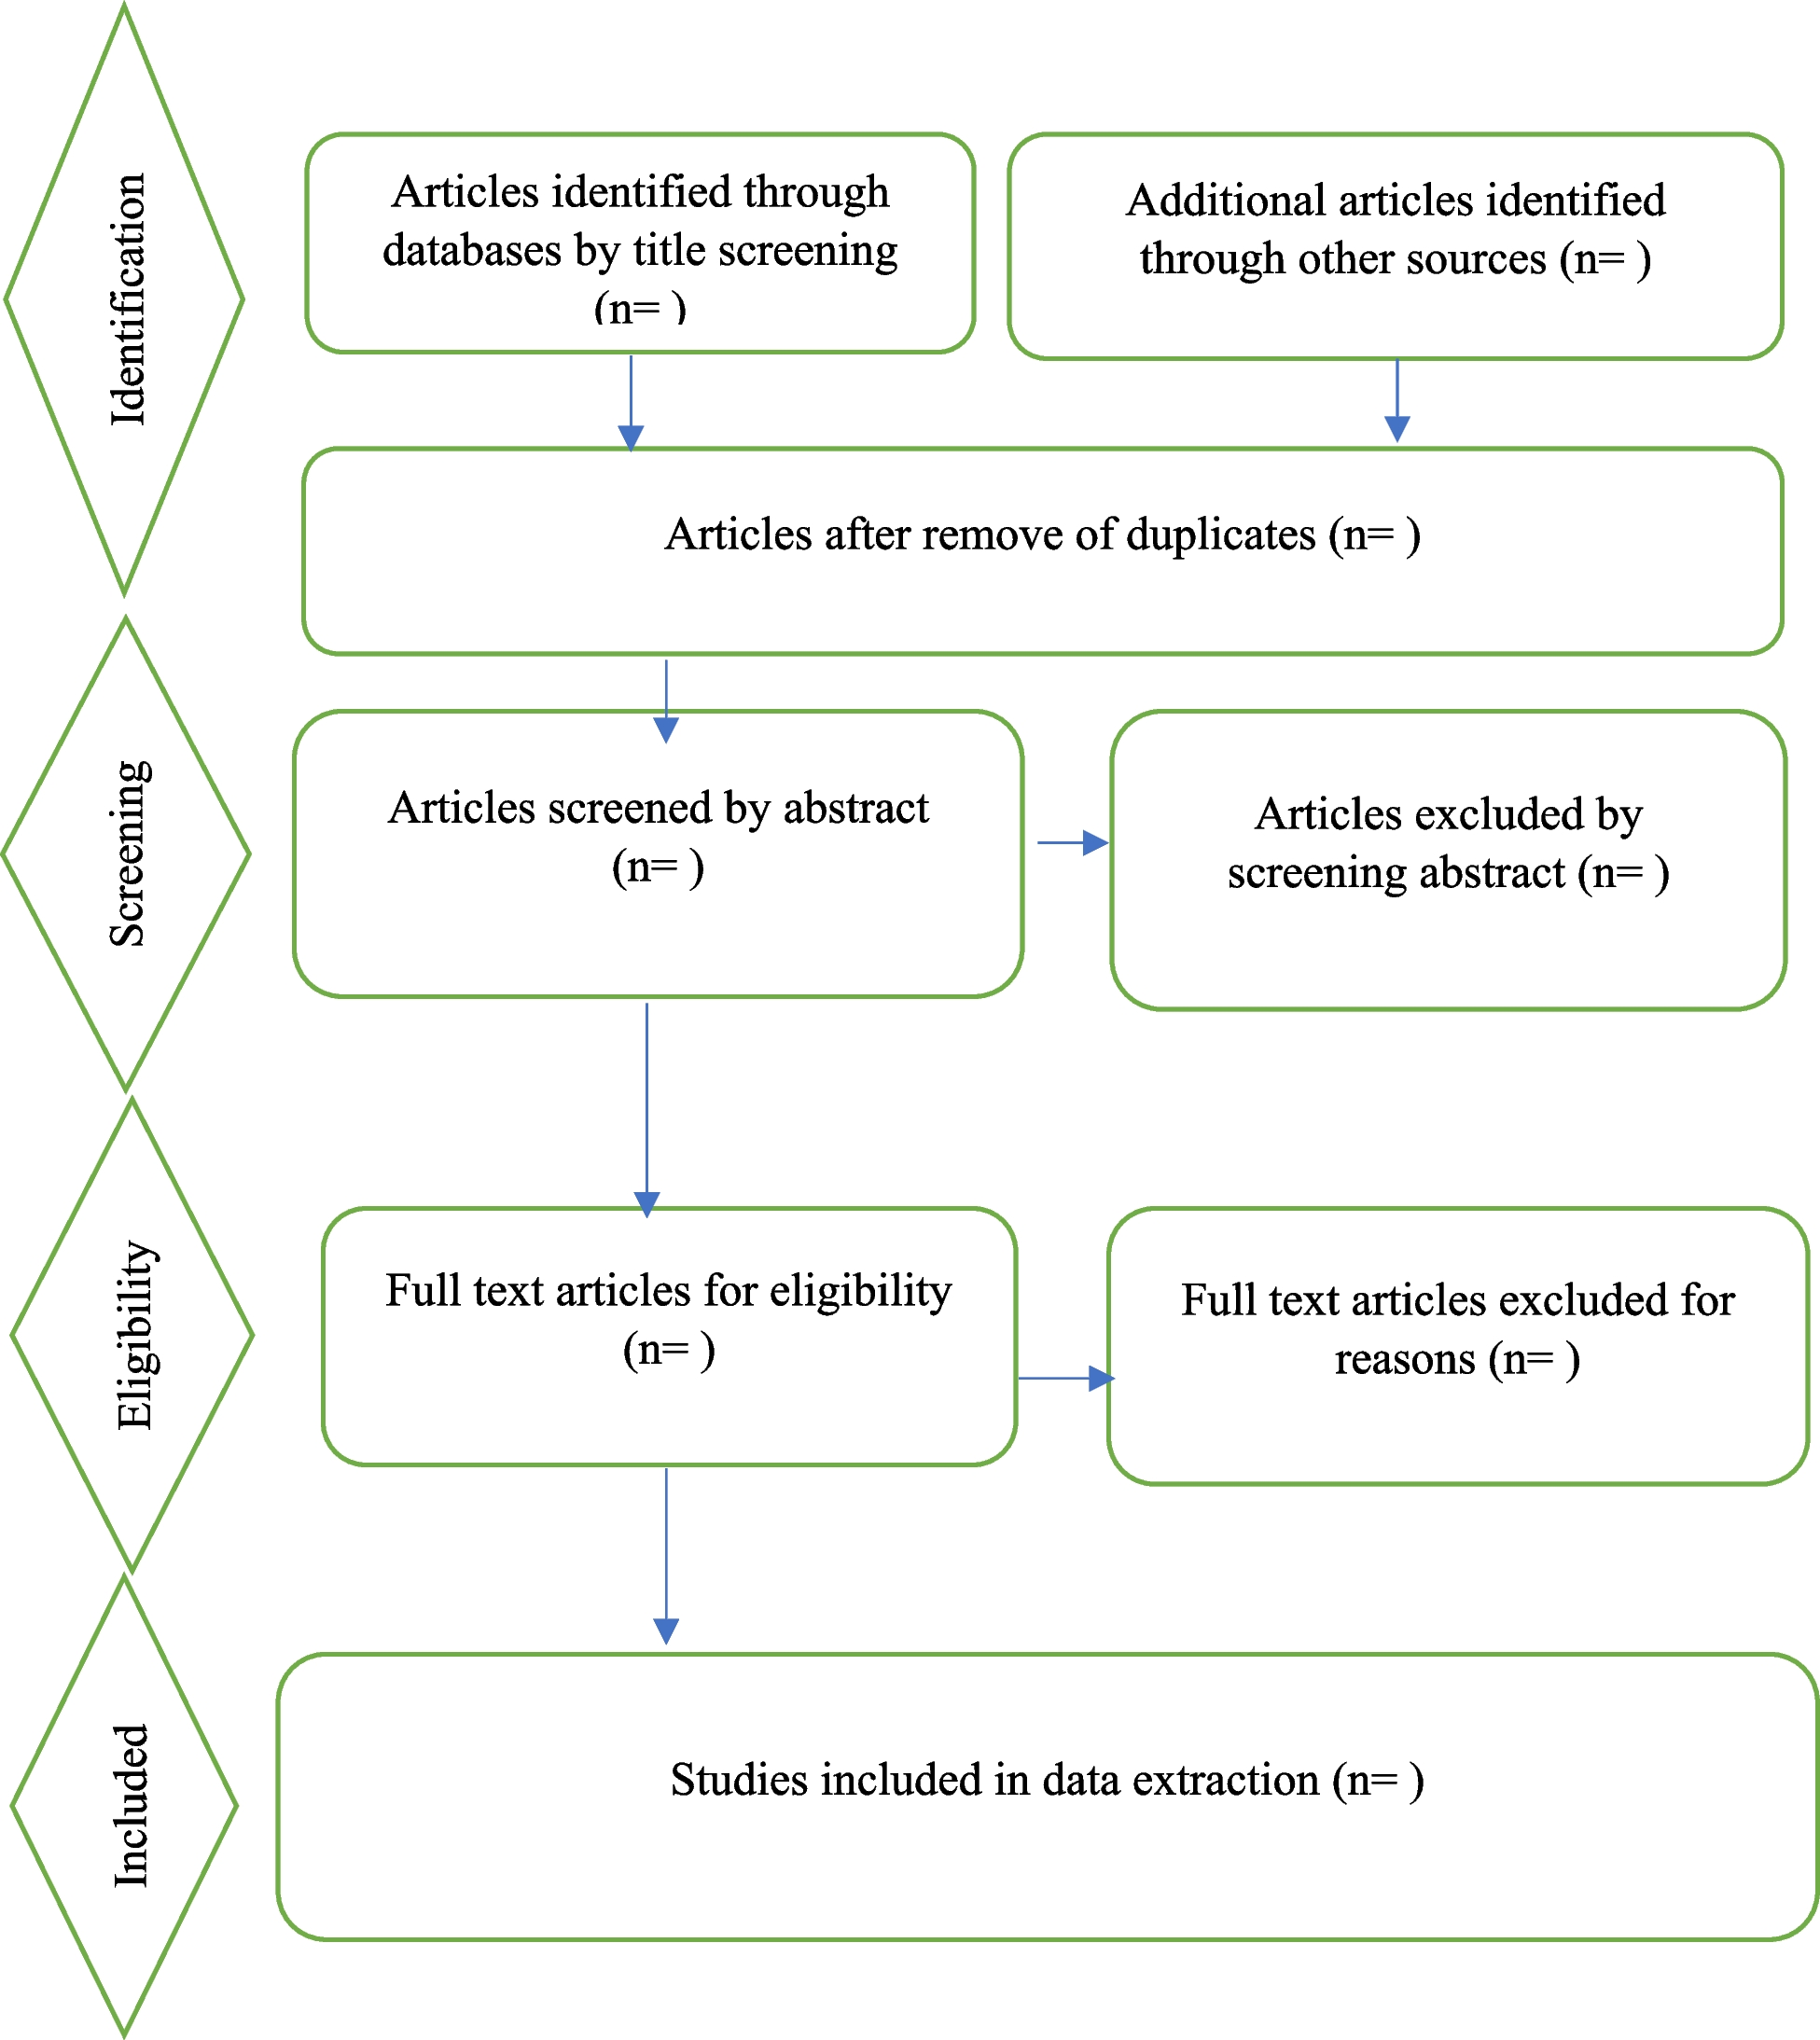

The database search yielded 655 studies, reduced to 199 following the removal of duplicates. After screening the titles and abstracts, 70 studies were identified for full-text screening. A further seven studies were identified through a secondary search of reference lists and 25 from Google Scholar, with 11 selected for full-text screening. Thus, a total of 81 studies received full-text screening. Subsequently, 65 studies were identified for inclusion in the review. A flowchart of the study selection process is shown in Fig. 1.
Fig.1
Flowchart of scoping review selection process
Review FindingsTables 1, 2 and 3 provide a summary of the findings based on the study categories. Each table describes the study design and data collection methods, data collection period, country of origin, population, injury definitions, injury incidence and exposure methods and body region. The findings are also presented in graphical and tabular formats in Additional File 2.
Table 1 Methodological details and injury incidence of netball descriptive epidemiological studies using hospital records, clinic records and insurance claim databasesStudy DesignOf the 65 studies included in the review, 44 (68%) were descriptive epidemiological studies, while 21 (32%) were analytic epidemiological studies. The descriptive studies utilised injury data from hospital/clinic records and insurance databases in 25 studies (57%) (Table 1), while 19 studies (43%) collected data from netball competitions (Table 2). Most descriptive studies assessing hospital/clinic records and insurance data were retrospective in design (n = 20, 80%), while the netball competition studies more frequently utilised prospective study designs (n = 12, 63%) Similarly, most analytic studies (Table 3), were prospective in design (n = 11, 52%) with 7 (33%) using cross-sectional designs (Additional File, 2 Fig. 1). One analytic study reported both retrospective and prospective injury data [73], hence a total of 22 analytic epidemiology study designs are reported.
Table 2 Methodological details and injury incidence of netball descriptive epidemiological studies of competitions Table 3 Methodological details and results of netball analytic epidemiological studiesYear of PublicationEighteen descriptive epidemiology studies were conducted pre–2008 (41%), 14% of which reported data from pre–1998 [30, 34,35,36, 59, 60]. Post 2018, eight hospital/clinic record studies (18%) [51,52,53,54,55,56,57,58], and six (14%) netball competition studies [18, 68,69,70,71,72] have been conducted. The analytic research has increased considerably in the 15 years since 2008 (n = 15, 71%), with nearly half of these studies conducted since 2019 [17, 86,87,88,89,90,91]. Additional File 2, Table 1 presents the frequency of studies according to publication year. It is also important to note that all of the studies report injury data from a minimum of 1 year [34], up to a maximum of 16 years [36] prior to the publication date.
Country of OriginEight of the 77 netball countries affiliated to World Netball [1] have conducted injury research. Most studies were conducted in Australia (n = 32, 49%), New Zealand (n = 14, 22%) and South Africa (n = 11, 17%). Australian studies focused on descriptive studies of netball competitions [14, 15, 30, 59, 60, 62, 63, 67, 68, 71] and analytical studies [16, 17, 73,74,75,76,77, 81,82,83,84, 86]. In contrast, New Zealand largely utilised hospital/clinic and insurance data [35, 36, 38, 44, 46,47,48, 52, 54, 55]. South African studies assessed both descriptive studies of netball competitions [18, 19, 64, 66, 69, 70], and analytic studies [78, 80, 87, 90, 91]. Only four (6%) injury studies, comprising three hospital/clinic and insurance studies [39, 53, 57] and one analytic study [89], have been conducted in the UK, with no netball competition studies to date (Tables 1, 2 and 3, Additional File 2, Fig. 2).
Data Collection PeriodA wide range of data collection periods were used across the netball studies with hospital/clinic or insurance data reporting the longest periods (Table 1). Most studies collected data for 4 years or more (n = 14, 56%) [36,37,38, 42, 44,45,46,47,48,49, 51, 52, 55, 58], or periods lasting 1 year (n = 9, 36%) [35, 36, 39,40,41, 43, 50, 54, 57], 2–3 years (12%) [35, 53, 56], or 10 months [34].
Descriptive netball competition studies collected data during netball seasons (n = 8, 42%), netball tournaments (n = 6, 32%) or over time periods (n = 5, 26%). The season data included studies assessing specific state or school leagues over one 14-week season [30], two seasons [60, 70], three 17-week seasons [71] and five 14-week seasons [59]. Other studies assessed injuries in players across one five-month season, two five-month seasons [14, 15] or one club during one 12-week season [67]. Studies assessing tournaments collected data for 3 days [62, 64], 4–6 days [19], 6 days [68] and 10 days [
留言 (0)