Study design, setting, and data source
This study was a retrospective cohort study using coded data in the American College of Surgeons Trauma Quality Improvement Program (ACS-TQIP) between January 2020 and December 2021. The TQIP database includes a subset of patients from the National Trauma Data Bank (NTDB), who were admitted in American Level 1 or 2 trauma centers, with age > 16 years and abbreviated injury scale (AIS) score > 2 in at least 1 body region. Data were handled in line with the TQIP data-user agreement and access was granted by the ACS TQIP. The Institutional Review Board of the Japan Red Cross Maebashi Hospital deemed the study exempt and waived the need for informed consent from patients (IRB 2021–4), as the data were publicly accessible and de-identified. This study adhered to the Strengthening the Reporting of Observational Studies in Epidemiology (STROBE) guidelines, and a complete checklist has been provided in Supplementary Table 1.
Study participants
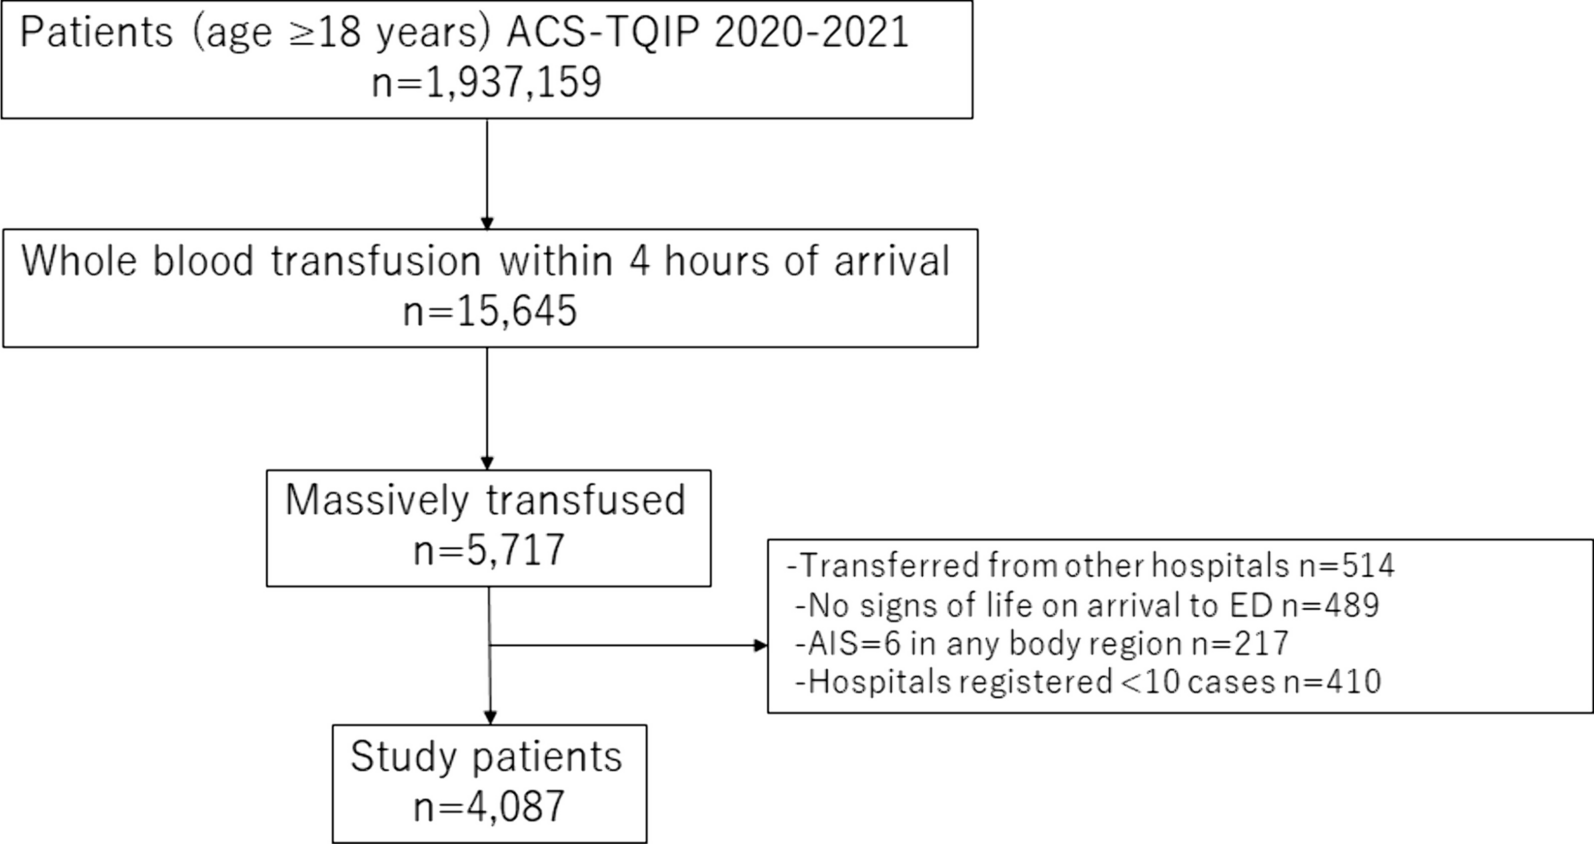
The study comprised patients aged 18 years and older who received WB transfusions within 4 h of hospital arrival as a part of massive blood transfusion. Massive blood transfusion was defined as the administration of 5 units or more of WB or packed red blood cells (PRBCs) within 4 h [8,9,10,11,12]. The following patients were excluded: (1) transfer from another hospital, (2) cardiac arrest upon hospital arrival, (3) Abbreviated Injury Scale (AIS) of 6 in any body region, (4) admitted to the hospital with < 10 cases requiring massive blood transfusion with WB. The number of patients requiring massive blood transfusion at each trauma center is shown in Supplementary Fig. 1.
Exposure and primary outcome measures
WBR was calculated for each patient by dividing the number of WB units by the sum of WB units and PRBCs units [13]. Our study patients were then categorized into four groups based on the quartiles of WBR. We examined the association between WBR category and outcome. Our primary outcome was 24-h mortality. Secondary outcomes, chosen a priori, included 30-day mortality, total blood transfusion volume (TBV), intensive care unit (ICU) length of stay (LOS), and major complications. Major complications comprised acute kidney injury (AKI), deep vein thrombosis (DVT), acute respiratory distress syndrome (ARDS), stroke, and myocardial infarction (MI).
Variables
Patient baseline characteristics included age, sex, injury type, vital signs on hospital arrival, Glasgow coma scale (GCS), injury characteristics including AIS (head, chest, abdomen, extremity) and injury severity score (ISS), transfusion volume including PRBCs, plasma, platelets, and WB within 4 h, timing of whole blood administration, hemorrhage control procedures within 4 h including thoracotomy and laparotomy, hospital information including trauma center level and university affiliation, length of stay, and complications.
Statistical analysis
Continuous and categorical variables were presented as medians with interquartile ranges (IQR) and counts with percentages, respectively. Four study groups were compared using the Kruskal–Wallis H-test for continuous variables and the Chi-square test for categorical variables. Missing data were addressed by creating 20 datasets with substituted plausible values through a Markov chain Monte Carlo algorithm, specifically using chained equations imputation [14]. This included imputation for sex (2.0% missing), systolic blood pressure (4.9% missing), heart rate (2.7% missing), GCS (2.1% missing), 24-h mortality (5.4%) and 30-day mortality (5.3%) and trauma center designation (17.5%).
First, we performed the multivariable logistic regression analysis fitted with generalized estimating equations (GEE) adjusting for patient demographics, vital signs on hospital arrival, injury characteristics, hemorrhage control procedures, hospital information, total transfusion volume and timing of WB administration, accounting for within-hospital clustering. The adjusted variables were selected considering clinical knowledge and referencing previous literatures [4, 7, 15, 16]. The WBR category 1 group (first quartile) served as a reference, and WBR category was included as a categorical variable in the multivariable logistic regression model. Two regression models, with and without adjustment for total transfusion volume, were created. Though transfusion volume is thought to be a partial mediator between intervention and outcome, we incorporated TBV into model 2 to adjust trauma severity more rigorously. Besides, we performed the multivariable logistic regression analysis fitted with GEE by adjusting whole blood ratio as continuous variable.
Subsequently, survival curves were estimated using the Kaplan–Meier method, and the log-rank test was employed for comparing between the four WBR categories. The log-rank trend analysis tested the linear trend of the association between WBR category and primary outcomes. We performed an analysis survival with the use of a Cox proportional hazard with adjustment for patient demographics, vital signs on hospital arrival, injury characteristics, hemorrhage control procedures, hospital information, total transfusion volume and timing of WB administration.
Additionally, adjusted event rates were determined by logistic regression based on patient demographics, injury characteristics, vital signs at hospital arrival, hemorrhage control procedures, hospital information, total transfusion volume, timing of WB administration and WBR. In these models, WBR was incorporated as a continuous variable. The comparisons among WBR category were conducted by one way analysis of variance and post hoc analysis of pair-wise t-test with Bonferroni adjustment.
Further analysis included linear and binary multiple variable regression to assess the effect of WBR category on secondary outcomes. Sensitivity analysis was performed by excluding WBR 1 category and using WBR 2 category as a reference for the multivariable logistic regression analysis fitted with GEE. Estimates were calculated with 95% confidence intervals (CIs), and statistical significance was defined as a two-sided P value < 0.05. All statistical analyses were performed using R software (version 4.2.2; R Foundation for Statistical Computing, Vienna, Austria).


留言 (0)