
記住我

Two studies, A and B, were performed in three ICUs in Europe, two in France (study A, La Pitié-Salpêtrière University Hospital in Paris and University Hospital in Angers) and one in Norway (study B, St. Olav’s University Hospital in Trondheim) between October 2019 and July 2020. Data were pooled for the purpose of this analysis. The study protocols were approved by the local ethics committee in France (Comité de Protection des Personnes Sud-Est 1, n. 2018-13) and Norway (REK midt, n. 2018/941). Patients or next of kin gave written consent to participate. The studies were registered on clinicaltrial.gov, NCT04008875 and NCT03896048.
PatientsConsecutive patients mechanically ventilated for > 24 h were eligible for inclusion when they met the predefined readiness-to-wean criteria according to our weaning protocol and could therefore undergo a spontaneous breathing trial (SBT). These criteria were as follows: (1) regression or clear improvement of the episode that motivated the institution of mechanical ventilation, (2) FiO2 < 50% with positive end-expiratory pressure ≤ 5 cmH2O allowing an arterial oxygen saturation ≥ 92%. Non-inclusion criteria were: (1) Richmond Agitation-Sedation Scale (RASS) < -2, (2) noradrenaline dosage > 0.3 μg/kg/min, (3) central or spinal neurological injury involving central ventilatory control or its transmission, (4) invasive mechanical ventilation for more than 14 days, 5) body mass index > 35 kg/m2, (6) contraindication to the insertion of the esophageal catheter (i.e., any contraindication to the insertion or change of the gastric tube such as esophageal surgery less than 14 days ago, esophageal varices rupture less than 4 days ago), (7) known neuromuscular disease, (8) administration of neuromuscular blockers less than 24 h ago (excluding succinylcholine for rapid sequence intubation), (9) known hemidiaphragm paralysis or suspicion of hemidiaphragm paralysis (defined as a cupola > 2.5 cm compared to the contralateral cupola on chest X-ray –in the absence of obvious atelectasis, major pleural effusion, pneumothorax or prior lung resection surgery), (10) treatment limitations decision, (11) pregnant woman, (12) age < 18 years or protected adult.
MeasurementsContinuous ultrasound measurement of diaphragm excursion and velocity (Study A and B) was performed with the RESPINOR DXT (Diaphragm Excursion Technology, Oslo, Norway), which measures continuously the movement of the right hemidiaphragm in the craniocaudal direction using the upper face of the liver as a proxy for the diaphragm [14]. A variant of the pulsed Doppler principle is used for measuring the motion of the liver and diaphragm. Two sensors were used. The anterior sensor is equipped with an ultrasound beam that emits short wave trains at 2.0 MHz at an angle of 45° and receives echoes from the liver parenchyma in-between the transmissions. The posterior and anterior sensors are fitted with accelerometers, which register their spatial orientation to account for dynamic changes of the beam angle. The posterior and anterior sensors also contain a magnetic distance measurement to compensate for the abdominal movements during respiration. The diaphragm displacement is calculated by summation and displayed and stored at a rate of 200 Hz.
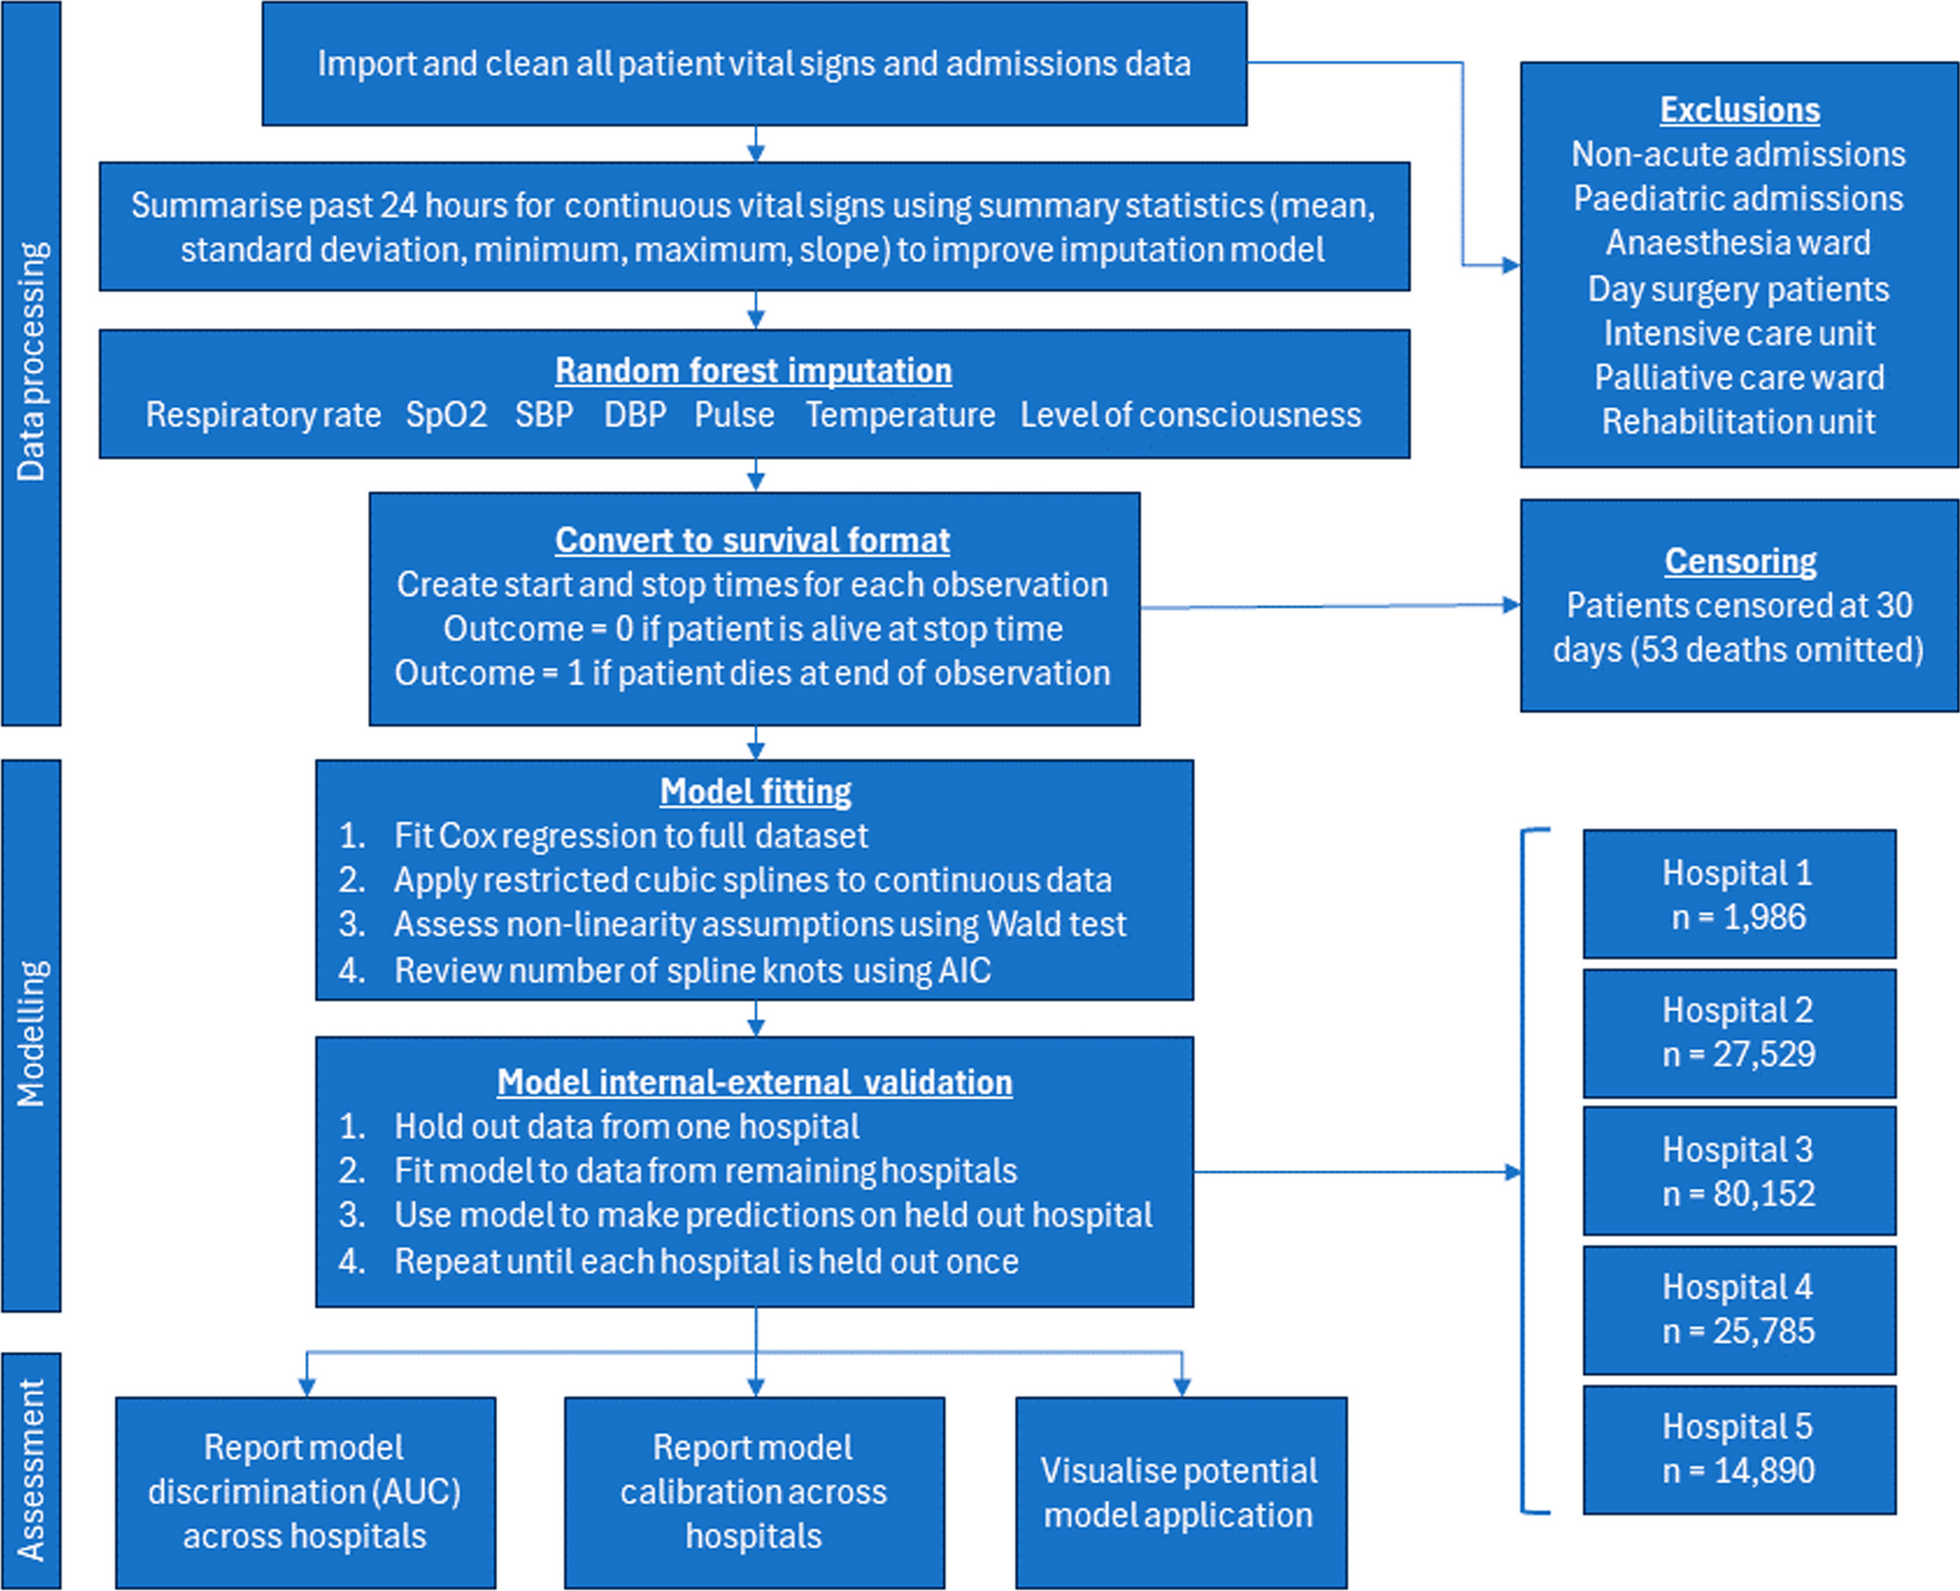
The ultrasound beam is centrally cast into a circular polyamide cache that is filled with silicone (Elastosil RT 601, Wacker Chemie AG, Munich), giving the anterior sensor a total diameter of 57 mm (Fig. 1A). The posterior sensor is molded of silicone (Elastosil RT 601), with a diameter of 55 mm and height of 13 mm (Fig. 1A). A 0.4-mm-thick sonolucent double-sided adhesive silicone tape is used to attach the sensors to the patient. The sensors are cabled to a control unit that automatically processes the data in real-time (Fig. 1B) and acts as the user interface and saves the de-identified data for subsequent processing.
Fig. 1
Continuous ultrasound diaphragm excursion and velocity monitoring probe placement and screen. Panel A. The anterior sensor was placed along the right mid-clavicular line with the upper border of the sensor approximately 2 cm below the lowest rib. The posterior sensor was placed on the back of the patient directly opposite to the anterior sensor. Panel B. The screen displays the continuous diaphragm excursion curve as well as the calculated diaphragm excursion in cm (EXdi) and respiratory rate (RR) updated for each breath. The yellow line represents the raw ultrasound signal, and the blue line represents the ultrasound signal compensated for the natural up and down movement of the abdomen during breathing. At the bottom of the screen, a live M-mode plot of diaphragm velocity is displayed. Panel C. First, a standard ultrasound recording of diaphragm maximal excursion and veloocity (EXdi and PCVdi, 10 cycles each) was performed. Of notice, because of interferences between the ultrasound waves produced by the continuous ultrasound measurement (CUSdi) and the standard ultrasound probes and because the two probes cannot be positioned together at the same location on the abdomen, the two measurements could not be done simultaneously. As such, immediately after the standard ultrasound recording, the sensors for CUSdi were attached and CUSdi recording of diaphragm excursion and velocity was performed. In parallel, the double-balloon catheter was positioned and transdiaphragmatic pressure was continuously measured with. After a 15-min recording of CUSdi and Pdi, the spontaneous breathing trial was initiated, for 30 min or until failure. The recording of CUSdi and Pdi was continued 15 min after the end of the SBT. Right after that, the sensors for CUSdi were removed and a second set of standard ultrasound recording of EXdi and PCVdi (10 cycles each) was immediately performed
The anterior sensor was placed along the right mid-clavicular line with the upper border of the sensor approximately 2 cm below the lowest rib. The posterior sensor was placed on the back of the patient directly opposite the anterior sensor (Fig. 1A).
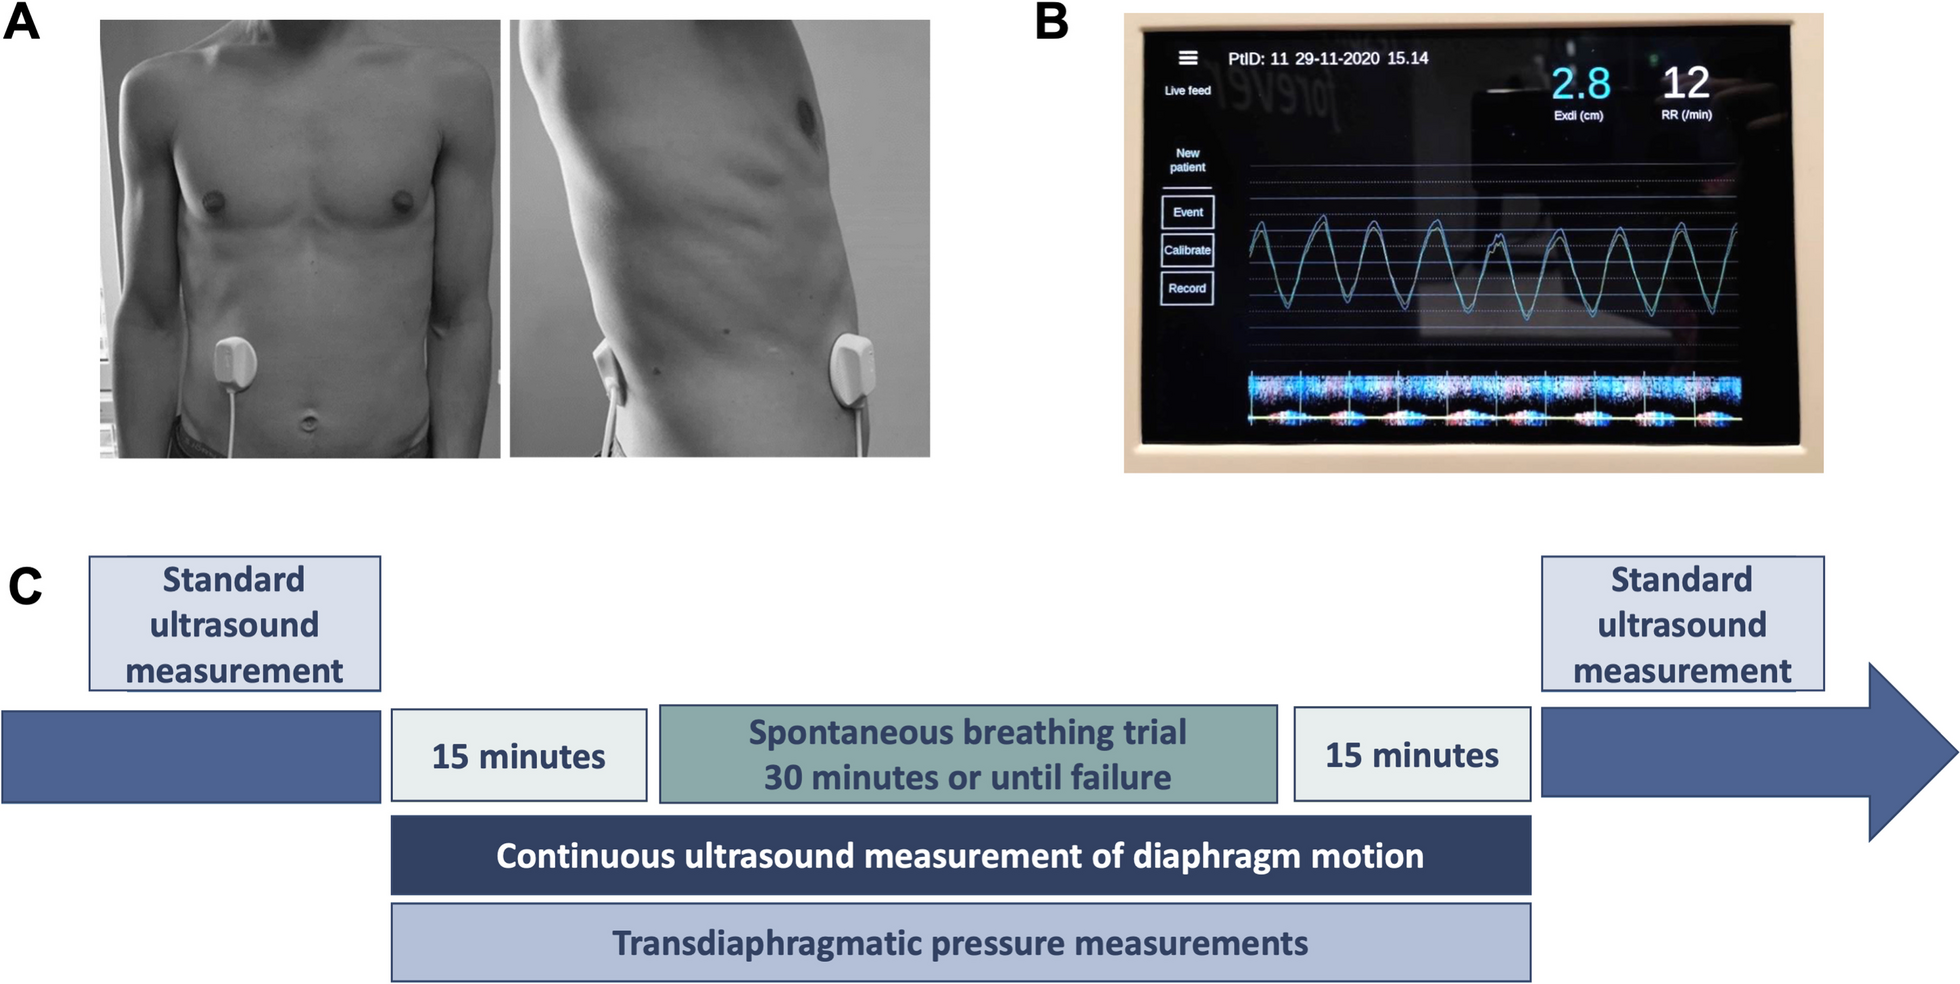
For each breath, the maximal diaphragm excursion (EXdi) and the peak contraction velocity (PCVdi) were measured [11] (Fig. 2).
Fig. 2
Depiction of the continuous ultrasound measurements of diaphragm excursion and velocity and transdiaphragmatic pressure derived from the time signal from one respiratory cycle
Manual standard ultrasound measurement (Study A only) was performed in each center by the same trained operators using 2–6 MHz broadband curved array transducer [6] connected to a Sparq ultrasound system (Philips Healthcare, Andover, MA, USA). The probe was placed below the right costal margin and directed medially and cephalad. The diaphragm was identified as the hyperechoic linear structure cephalad to the liver. Excursion was measured using M-mode [3, 6, 7] and velocity was measured with tissue Doppler imaging [30]. Images were recorded for subsequent computer-assisted quantitative analysis performed by a trained investigator. EXdi and PCVdi were each measured on 10 separate breaths and the mean of these 10 measurements was reported. Because of interferences between the ultrasound waves produced by the CUSdi and the standard ultrasound probes and because the two probes need to be positioned at the same place on the abdomen, the two measurements could not be performed simultaneously.
Transdiaphragmatic pressure measurements (Study A only). Esophageal and gastric pressure (Pes and Pga) were measured using a double-balloon, graduated feeding catheter (NutriVent, Mirandola, Moderna, Italy). The correct position of the esophageal balloon was checked with the occlusion test [15]. Briefly, a dynamic occlusion test was performed to validate esophageal balloon position, allowing the visualization of a corresponding negative deflection in esophageal pressure and airway pressure during inspiratory effort. To validate gastric balloon position, an increase in gastric pressure had to be observed when gently pressing the patient’s abdomen. The esophageal balloon was inflated with 2 mL of air and the gastric balloon was inflated with 4 mL of air. Balloons were connected to a linear differential pressure transducer (MP45, Validyne, Northridge, Calif., USA). Flow was measured using a single use flow sensor (Hamilton Medical, Bonaduz, Switzerland) connected to a pressure transducer (DP45, Validyne, Northridge, CA, USA).
Flow and pressure signals were acquired by a data acquisition system (PowerLab 8/35, AD Instruments, Colorado Springs, CO, USA) at a sampling frequency of 200 Hz. Transdiaphragmatic pressure (Pdi) was continuously obtained by the online subtraction of esophageal pressure from gastric pressure, Pdi = Pga—Pes. Tidal volume was calculated during the SBT by numerical integration over time of the absolute value of the flow signal.
To achieve a concomitant measure of diaphragm displacement and Pdi, an analog timing signal produced by the CUSdi was used to synchronize pressure measurements and continuous ultrasound measurements in post-processing. Signal analyses were performed with the LabChart 8 software (AD Instruments, Colorado Springs, CO) and the MATLAB® 2020b software (Mathworks, Massachusetts, United States).
In each Pdi waveform, we measured Pdi, peak, defined as the difference between the start of the increase in Pdi and the positive peak value of Pdi during inspiration, and the transdiaphragmatic pressure–time product (PTPdi) defined as the area under the transdiaphragmatic pressure curve during inspiration [16] (Fig. 2). Breath cycles were detected by an automatic algorithm in post processing by detecting the zero crossings of the Pdi signal. Artifacts such as coughing, swallowing, or movements, were identified visually on the Pdi signal and discarded from the analysis.
Study protocolFigure 1C describes the study protocol. Once the patient was enrolled and prior to the initiation of the SBT, a standard ultrasound recording of EXdi and PCVdi was performed (study A). Immediately after that, the sensors for CUSdi were attached (study A and B) and a CUSdi recording of EXdi and PCVdi was performed. Finally, the double-balloon catheter was positioned (study A). After a 15-min recording of CUSdi and Pdi, the 30-min SBT was initiated. The SBT was performed under T-piece or pressure support ventilation [17, 18]. The SBT was interrupted and considered a failure in case of respiratory rate > 35 breaths/min, arterial oxygen saturation < 90%, heart rate > 140/min (or sustained variation of more than 20% of base value), systolic arterial blood pressure > 180 mmHg or < 90 mmHg, agitation or significant anxiety.
The recording of CUSdi and Pdi was continued 15 min after the end of the SBT, whatever the outcome. Right after that, the sensors for CUSdi were removed and a second set of standard ultrasound recording of EXdi and PCVdi (10 cycles each) was immediately performed (study A).
In the absence of any symptom of poor tolerance mentioned above, the patient was extubated. Patients aged > 60 years or with a chronic underlying cardiac or respiratory disease received either prophylactic non-invasive ventilation or high flow oxygen or both [19, 20]. Weaning failure was defined as patients failing the SBT or passing the SBT but requiring reintubation within the 48 h following extubation. For patients with multiple failed SBT, only their first SBT was considered for the analysis.
Adverse events related to the device such as skin erythema, pain and pruritus were recorded.
Investigators were retrospectively surveyed regarding the ease-of-use of the CUSdi, asking them to rate how they found (a) setting up the system, and (b) placing the sensors, on a scale from 1 to 5 where 1 was very easy and 5 was very difficult, as well as quantifying time spent (a) setting up the system, and (b) placing the sensors, with the following options: 0–2 min, 3–5 min, 6–10 min, 11–20 min, and > 20 min.
Statistical analysisBased on previous studies that evaluated EXdi to predict weaning failure [3, 8, 21, 22], we anticipated that weaning failure rate would be 40% in patients with an EXdi < 1.1 cm and 10% in patients with an EXdi > 1.1 cm. With a type I error rate of 0.05 and a power of 0.8, a sample size of 40 patients was needed. Because we anticipated poor signal quality in some patients, we aimed to include 50 patients.
Continuous variables are reported as median (25th–75th percentiles) and categorical variables are expressed as absolute and relative frequency. Continuous variables were compared using a Mann–Whitney U test and categorical variables were compared using a Chi-2 test.
Comparison between CUSdi and manual standard ultrasound. The agreement between continuous and standard ultrasound measurements of EXdi and PCVdi (mean of the measurements performed on 10 separate breaths) performed before and after the SBT was evaluated using the method of Bland and Altman [23]. These results were expressed as bias, limits, and 95% confidence interval (CI) of bias. Bias was significant if 0 was not included in the 95%CI. Patients with one measurement outside the limits of agreement defined by the Bland—Altman plot were defined as poor agreement, whereas patients with all measurements within the limits of agreement were defined as good agreement; patient characteristics were compared between the two groups. Continuous and standard ultrasound measurements comparison were achieved using Passing-Bablok linear regression (24) and Spearman correlation.
Performance of the CUSdi to predict weaning failure. EXdi and PCVdi were measured 1, 2, 3, 4, 5, 10, 20 and 30 min after the initiation of the SBT (mean of all breath cycles over a 1-min recording, excluding the 5% largest and 5% smallest values as outliers). Receiver operating characteristic (ROC) curves were constructed to evaluate the performance of EXdi and PCVdi to predict weaning failure. Sensitivity, specificity, positive and negative predictive values, and areas under the receiver operating curves (AUC-ROC) were calculated. AUC-ROC were performed to identify optimal cutoff values of EXdi and PCVdi in predicting weaning failure, and these estimates were obtained using bootstrapping with 1000 replications. The best threshold value for each index was determined as the value associated with the best Youden index for the prediction of weaning failure. AUC-ROC were compared using the nonparametric approach of DeLong et al. [25].
Relationship between CUSdi and simultaneous measure of Pdi. Peak transdiaphragmatic pressure, PTPdi, EXdi and PCVdi were measured offline every minute during the SBT (trimmed mean of all breath cycles over a 1-min recording, excluding the 5% largest and 5% smallest values as outliers). The relationship between Pdi measurements (Pdi,peak and PTPdi) and CUSdi measurements (EXdi and PCVdi) was assessed with repeated-measures correlation according to the method developed by Bakdash and Marusich [26]. For illustrative purposes, the intra-individual Spearman’s correlations between Pdi measurements and CUSdi measurements were also calculated to highlight the trends within each patient.
Data were analyzed using SPSS (v06, Cary, NC) except for Passing-Bablok regression and Bland–Altman plots that were performed with MedCalc (Mariakerke, Belgium) and for repeated-measures correlation coefficient that were performed with the rmcorr R package (https://cran.r-project.org/web/packages/rmcorr/).
留言 (0)