
記住我
An overview of the study design is depicted and described in Fig. 1 and Supplementary Table 1.
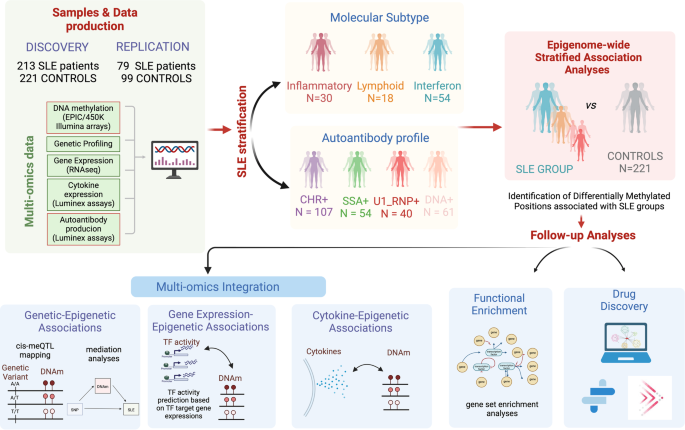
Fig. 1: Overview of the study design.
Schematic outline illustrating the data analysis and the use of patients’ genetic and molecular information to stratify patients into molecularly homogenous groups and autoantibody-positivity profiles to further perform EWAS functional enrichment analyses, meQTL analyses, cytokine association, and drug discovery according to molecular and serological subtypes.
Genome-wide DNAm patterns associated with different molecular SLE subtypesWe conducted an EWAS with a sample size of 213 SLE cases and 221 controls. This analysis led to the identification of 262 SLE-DMPs (97% replication rate in an independent 450 K sample), as depicted in Fig. 2a and detailed in Supplementary Data. Of these DMPs, 64% displayed hypomethylation effects, while the remaining 36% exhibited hypermethylation effects. Not unexpectedly, the top SLE-DMPs implicated large reductions of DNAm at IRGs and genes enriched in IFN pathways (Supplementary Table 2), as for example IFI44L, MX1, NLRC5, IFITM1, IFIT1, IRF9 or PARP9 but also genes involved in antigen processing and class I presentation (TAP1 and B2M). Large hypermethylation effects were also observed in IRGs such as OASL. These results corroborate previous findings and is likely a consequence of the higher IFN levels observed in SLE patients20.
Fig. 2: Epigenetic signatures of SLE molecular subtypes and cell type interactions.
a Manhattan plot illustrating EWAS results for SLE and different molecular groups when compared with controls. X-axis represents the chromosomic locations of CpG sites and Y-axis represents the log10 (P) obtained in linear regression models. b–d Volcano Plots representing EWAS results. The X-axis represents the DNAm differences between each pair of groups tested. e Overlap of genome-wide significant results for each EWAS was performed. f–i Examples of subtype dependent-DMPs. Colored dots represent significant DMPs after Bonferroni correction of different groups according to the legend. Diamonds and starts dots represents subtypes-dependent DMPs. j Venn diagram illustrating the overlap of cell-type-interacting DMPs that remain significant after Bonferroni correction. k Scatter plots depicting DNAm changes between SLE and CTRL individuals at a specific CpG site identified as a significant DMP in the cell-type-interacting analysis. Neutrophil proportions are represented on the y-axis in the left plot, while CD4T proportions are depicted on the x-axis in the right plot.
Stratifying SLE patients into the molecular subtypes (NIFN = 54, NInfl = 30, NLymp = 18) allowed us to raise the number of associations despite reducing the sample size (Fig. 2a). We identified 314 inflammatory-DMPs (96.18% hypomethylation), 41 lymphoid-DMPs (90.24% hypomethylation) and 659 IFN-DMPs (54.48% hypomethylation), among which 214, 3, and 420, respectively, had not been previously detected when all SLE patients were pooled together (Fig. 2e). Next, we unveiled the outcomes of the enrichment analysis, emphasizing the concentration of identified genes within specific pathways. The IFN subtype showcased the most pronounced impact on genes associated with IFN pathways. Nevertheless, a persistent epigenetic IFN signature and analogous enrichment were also apparent in patients within the lymphoid and inflammatory subtypes (Fig. 2b–d and Supplementary Table 3). Additionally, synaptic functions exhibited enrichment in the set of genes with inflammatory differential DNA methylation.
We identified 71 inflammatory-dependent DMPs, 1 lymphoid-dependent DMPs and 232 IFN-dependent DMPs (Supplementary Fig. 1a–c and Supplementary Data). For example, we observed a DNAm decrease at SYNGAP1 and EGR3 genes in SLE inflammatory patients (P < 4.08 × 10−04) that we did not observe in healthy controls or in patients from other subtypes (P < 0.05; Fig. 2f, g). For the IFN subtype, we found large DNAm differences at IRF7 and TRIM22 genes, (Fig. 2h, i) both of which are related to type I IFN pathways21.
Through EWAS interaction models, we addressed the question of whether DNAm differences at DMPs are modified by specific blood cell types. The adjustment of EWAS models by blood composition guarantees that DMPs are not explained by cell proportions, however, we did find that DNAm differences between controls and SLE patients at some DMPs is modified in relation to cell proportions, and we called this as cell-interacting DMPs. We uncovered 145 cell-interacting DMPs (Pint < 6 ×10⁻⁸), distributed as follows: 2 CD8T-interacting DMPs, 71 CD4T-interacting DMPs, 123 neutrophils-interacting DMPs, and 3 B cell-interacting DMPs. Notably, 68 of these DMPs were previously identified in our inflammatory stratified analyses, but none in the interferon or in the lymphoid groups (Supplementary Data). For example, DNAm at genes RUSC2 and ZNRF1 show greater DNAm differences between SLE and CTRLs in subjects with higher neutrophil and higher CD4T proportions respectively (Fig. 2k).
Intriguingly, we observed a contrast DNAm relationship with cell proportion in these DMPs, with 100% of those interacting CD4T displaying an opposite sign than those interacting with neutrophils. This could be explained by the tight negative correlation between neutrophils and CD4T cell proportions. Nevertheless, some DMPs were also found to be shared across different cell types (Fig. 2j), while 30 cell-type-interacting DMPs exhibited significance in one group but not in the other (Fig. 2j, k). We could also identify 77 novel DMPs showing cell-type-interacting DMPs. For example, DNAm at FCGRT gene for neutrophil, ECE1 for B cell or TMEM173 for CD4T cell. Due to low number of genes, functional enrichment analysis did not yield any pathway enriched in cell-interacting DMPs (Supplementary Data).
The relationship of autoantibody profile on the SLE epigenomeWe stratified patients based on their positivity for the most prevalent AAbs (NSSA+ = 54, NCHR+107, NDNA = 61, NU1-RNP = 40) to perform the EWAS analysis. We identified 388 anti-SSA-DMPs, 223 anti-chromatin-DMPs, 256 anti-dsDNA-DMPs and 164 anti-U1-RNP-DMPs (Fig. 3a, Supplementary Data) when compared with CTRLs, yielding a total of 466 AAb-DMPs, from which 238 had not been previously detected as SLE-DMPs, and 81 were not detected as molecular subtype-DMPs. The epigenIFNsig, and in general every CpG effect, was stronger in SSA + SLE patients for which we identified 155 DMPs not observed in the other groups (Fig. 3b–f). However, the epigenetic signature was still persistent and dominant in SLE patients positive for other autoantibodies (Fig. 3b–e). A small proportion of 27 anti-chromatin-DMPs and 38 anti-dsDNA-DMPs were exclusively observed in these groups when establishing a genome-wide significance level. However, at a significant threshold of P < 0.05, we could only identify one example of an anti-SSA-dependent-DMPs in the NLCR5 gene that reached genome-wide significance level in the SSA group and was not significant in the rest. (Fig. 3g). Functional enrichment analyses on AAb-DMPs identified IFN pathways as well as antigen processing and other pathways regulatory of immune responses (Supplementary Table 4). Furthermore, the examination considered negative antibody spectra. When comparing negative AAbs with DNAm changes in healthy controls, the observed alterations were limited. The analysis predominantly highlighted IFN signals without yielding any novel discoveries (Supplementary Fig. 2a, b). Our results indicate that epigenetic signature is highly shared across SLE patients with different autoantibody profiles, and that there is little specificity on SLE autoantibody-related epigenetic signals.
Fig. 3: Epigenetic signatures of SLE autoantibody profiles.
a Manhattan plot illustrating EWAS results for different groups of SLE patients according to their autoantibody profiles when compared with controls. X-axis represents the chromosomal locations of CpG sites and Y-axis represents the log10 (P) obtained in linear regression models. b–e Volcano Plots representing EWAS results. The X-axis represents the DNAm differences between each pair of groups tested. f Overlap of genome-wide significant results for each EWAS performed. g Example of DNAm distribution across different autoantibody groups, and healthy subjects. Colored dots represent significant DMPs after Bonferroni correction of different groups according to the legend.
Genetic drivers of SLE epigenetic signals and mediation role of DNAm on SLE riskWe searched for cis genetic variants associated with DNAm at 148 DMPs (cis-meQTLs-DMPs, FDR < 0.05) (Fig. 4a). Up to 31 loci involved in cis-meQTL-DMPs also associate with SLE (SLE-cis-meQTLs-DMPs, Bonferroni significance P < 8 × 10−05; Fig. 4a). Mediation analyses on SLE-cis-meQTLs-DMPs (Supplementary Data) revealed that SLE genetic risk is significantly reduced when DNAm is incorporated in the model (Fig. 4b), and that a significantly high proportion of SLE genetic risk at the HLA class I region (12-65% proportion mediated) is mediated by DNAm in HLA-F, HLA-A, C6orf136, HLA-C, HLA-B, HCP5, TAP1 and PSMB9 genes (Fig. 4c, d). Other SLE-associated SNPs such as those located in STAT1 or the intergenic region at chromosome 5 nearby microRNA mir-146 also showed a significant indirect effect of SNP on SLE suggesting a mediation role of DNAm, but the proportion mediated did not reach statistical significance (P > 0.05), probably due to the low sample size. Interestingly, for SLE-associated genes such as IRF7 and ITGAX, the SLE genetic effect increased when DNAm was included in the model, suggesting a cofounded or more complex relationship between DNAm, genetic variation and SLE (Fig. 4d).
Fig. 4: Genetic drivers of SLE-epigenetic signatures.
a Top Manhattan plot (MP) shows GWAS results contrasting allele frequencies between a group of SLE patients (N = 4212) and a group of CTRL (N = 4065). Bottom MP illustrates meQTL results for DMPs in the whole sample. X-axis represents the chromosomal locations of CpG sites and the Y-axis represents the log10 (P) obtained in a logistic regression model or meQTL analyses. Genetic associations above the red line marks the statistical association at a significant threshold of P < 1 × 10−06 for logistic associations and FDR < 0.05 for meQTLs. Red boxes show overlap in GWAS and meQTL results and represent meQTLs associated with SLE diagnosis. b Mediation model in which SLE genetic risk is exerted partly through DNAm changes. c Examples of SLE-associated SNPs in chr6 that are mediated by DNAm changes at DMPs in the HLA region. d Mediation results for the best SLE-meQTL-DMPs by gene. Upper barplot shows the Total and the Direct Effect of SLE-associated genetic variants. Botton barplot show the significance of the proportion mediated via DNA met resulted from mediation models. Percentage of mediation is illustrated in red below each bar only for those significant genes (Pproportion mediated < 0.05) e–i Group-dependent meQTL effects. e A meQTL significant effect is observed among SLE patients (FDR < 0.05) but not in the CTRL population (P > 0.05). f A meQTL significant effect is observed in SLE patients and CTRLs but with different signs. g A meQTL significant effect is observed among SLE from inflammatory group (FDR < 0.05) but not in the CTRL population or in the IFN group (P > 0.05). h A meQTL significant effect is observed among SLE from IFN group (FDR < 0.05) but not in the CTRL population or in the inflammatory group (P > 0.05). i A meQTL with opposite direction effects between Inflammatory-IFN subtypes.
Context-dependent meQTL regulatory function in SLEWe discovered cis-genetic variants associated with DNAm with dependency on disease status or molecular subtype by the identification of meQTL in different groups together with significant interaction effects. We identified SLE-dependent meQTLs for 394 DMPs among which significant disease-dependent effects were observed in CDHR5 and MAML2 (Fig. 4e, f). Likewise, we discovered inflammatory- and IFN-dependent meQTLs for 283 and 316 DMPs, respectively (Supplementary Data). For instance, we observed genetic regulation on DNAm in RSAD2 gene in inflammatory SLE patients, but not in the IFN group or in controls where RSAD2-DNAm does not show a relationship with the genotype (Fig. 4g). IFN-dependent meQTL effects were observed for example for HLA-F (Fig. 4h). Intriguingly, we also identified meQTLs with strong opposite effects (op-meQTLs) between SLE and CTRLs (119 DMPs) or between the IFN and inflammatory subtypes (35 DMPs) among which IFI44 gene shows the greatest opposite effect (Fig. 4i). Some genetic variants involved in context-dependent meQTLs were associated with SLE at a Bonferroni-corrected threshold (P < 1.2 × 10−04) (Supplementary Data). The strongest SLE-associated SNPs involved SLE-dependent meQTL that associated with DNAm at HLA-B and HLA-E genes. Interestingly, we also identified strong genetic-disease interaction (Pint = 6.5×10−05) in the regulation of DNAm within the CDHR5 gene at chromosome 11, that involve SNPs strongly associated with SLE (P = 1.9 × 10−07; Fig. 4e).
SLE-associated epigenetic signals correlate with transcription factor activity and cytokine productionTranscription factor (TF) binding has an important role in shaping DNAm levels and vice versa22. Here, we identified up to 61 different TFs whose activity correlated with DNAm at several DMPs (P < 0.05) (Supplementary Data). Interestingly, the large interaction between DNAm and TF activity (TFact) for IRF9, IRF1, STAT2, STAT1, STAT3, TFDP1, FOXM1, E2F3, E2F2, GLI2, and RUNX3 was restricted to SLE patients (Fig. 5a, b). While, TFs of IRF and STAT family have a well described role in the activation of IFN pathways and are associated with DNAm at IRGs. The TFact of TFDP1, E2F3, and FOXM1 correlated also with DNAm at IRGs such as IFI44L, MX1, TRIM22, and ISG15. Interestingly, RUNX3 activity was associated with DNAm at genes such as FCGR3B, HLX, LGALS12, BACH, and SYNGAP which are not IFN-regulated. Intriguingly, we observed differential DNAm-TFact associations when comparing between inflammatory and IFN SLE patients. For example, NR2F2 TFact is strongly negatively associated with DNAm at the LETM1 gene, but such effect is not observed in the IFN subtype (Fig. 5c). Likewise, ZEB1 TFact is associated with DNAm at LGALS9, RSAD2, TMEM123, HECA, and IFI44L genes only in IFN patients (Fig. 5d).
Fig. 5: Relationship between SLE-epigenetic signatures, transcription factor activity, and cytokine production.
a Heatmap representing SLE-dependent associations between DNAm at DMPs and TFact inferred from RNAseq data. b SLE dependent example showing the effect between TFact STAT2 and DNAm at ADAR gene vs CTRL. c, d Subtypes dependent examples showing the effect between TFact ZEB1 and NR2F2 and DNAm at SPATS2L and LETM1 genes. e Heatmap showing the effect distribution of CpGs-genes associated to cytokine levels exhibiting group specificity. Color gradient from blue to red correspond to effect sizes. f, g Examples for cytokine opposite associations at DNAm levels for inflammatory and IFN subtypes.
We explored whether DMPs could be associated with cytokine production in each molecular group. In total, 82 DMPs were significantly associated with levels of 8 cytokines (P < 5 × 10−05). The strongest (and negative) associations were found between IL1RII levels and SLE-DMPs at a number of IRGs such as PARP9 and IFI44L. We found SLE CpG-cytokine association for TNFa (VRK2, PARP9), IL1ra (BST2, ATP10A), IL1RII (IFITM1, ARID5B), MCP2 (IFI44L, CMPK2), and IP10 (NLRC5, B2M) which were not observed in CTRLs. We also observed inflammatory-dependent association for TNFRI (RAPGEF1) and CRP (OAS3) (Supplementary Data). Figure 5e illustrates the strength of the group-dependent associations. It can be observed that associations differed between groups and that for some CpGs, for cytokines such as IL1RII, these were stronger within the inflammatory as compared to the IFN subtype and stronger than CTRLs. For example, IL1RII was negatively associated with DNAm at MX1 in IFN subtype but it is positively associated in the inflammatory subtype (Fig. 5f), similarly MCP2 showed opposite effects at the DNAm level for the LGALS3BP gene for the inflammatory and IFN subtypes (Fig. 5g). Altogether, our results indicate that the relationship between DNAm, TFact and cytokine production is determined in a subtype-dependent manner.
SLE-associated epigenetic signals inform drug discoveryWe observed an enrichment of the list of unique 549 SLE differentially methylated genes (DMG) among known drug targets (Fold enrichment of 1.4, P < 0.01 in phase 1 or above in OpenTargets and Informa databases), and identified a total of 62 DMG being known drug targets, including 8 known SLE drug targets: SYK, JAK3, BCL2, PIK3CD, VDR, BTLA, FGR, GDP2, and NDUFS8 (Supplementary Table 5 and Fig. 6).
Fig. 6: Representative SLE Epigenomic signature genes.
We list the top 20 (of the 549 genes from the identified 974 CpG sites) based on summary of gene total scores derived from individual criteria (filled box indicates criterion satisfied). Filled boxes indicate an overlap with the data source described in each column. For full results, see Supplementary Data.
To identify and prioritize candidate novel SLE gene targets, we collected different features of each gene and ranked them based on two criteria: (i) previous evidence of genetic association to SLE (ii) “network proximity” (Fig. 6, see “Methods” section for scoring details). We showed strong enrichment of validated targets within the groups of genes with scores equal or higher than one (Supplementary Fig. 3). Using the different annotations available for each gene of the list, we could prioritize genes of interest and focus on potentially novel targets (see discussion) for SLE, and for different SLE subtypes. For example, we observed that 4 of the known drug targets (VDR, ALOX5AP, ITGA5, and ECE1) overlapped with genes that are differentially methylated only in the inflammatory SLE patients. Likewise, 17 genes (CLU, CETP, TSHR, ITGA2, ACACA, TNK2, STAT4, PSMB8, SCN8A, INPP5D, BMPR1A, TAP1, TYMP, QPCT, GPD2, PSMB9, and LAMB1) overlapped with interferon specific epigenetic signatures.
留言 (0)