
記住我
LC-WGS copy number profiles of 52 plasma samples and matched tumor tissue (see Methods for description of sample characteristics and treatment regimens) from the AC-ANGIOPREDICT mCRC patients (Table 1) who received BVZ were compared to evaluate concordance. We assessed the 43 copy number amplifications and 59 deletions reported previously12 to determine CIN subcluster identity. We confirmed the presence of these CNA in various tumor tissue samples, however not all CNAs were retrieved in the corresponding plasma samples due to dilution of the tumor cells by non-cancerous cells (Fig. 1a). Furthermore, we calculated the Spearman correlations of the CNA amplification and deletion peak copy number values derived from the LC-WGS profiles. Patients were ordered by alternating tumor tissue and matching plasma samples (Supplementary Fig. 1). The highest correlation was detected close to the diagonal, indicating a high correlation between tumor tissue and matching plasma of the same patient. Nevertheless, in patient plasma samples that had high sCNA levels, similar sCNA regions in the profile were found to correlate with multiple, unmatched tumor tissue samples
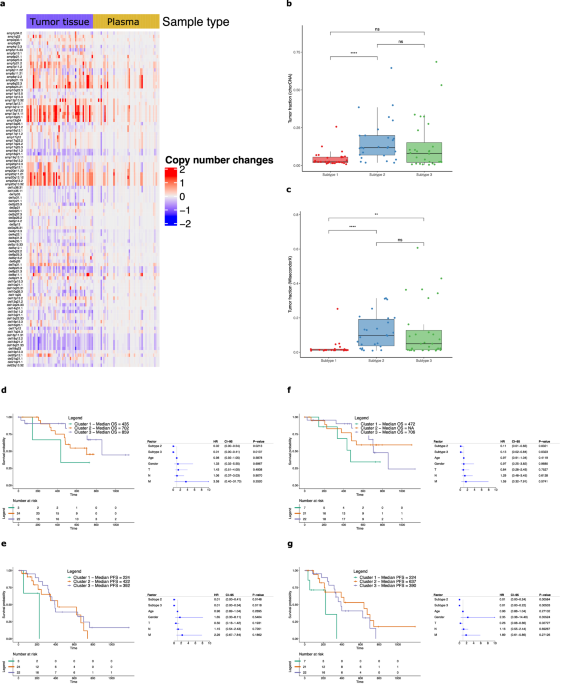
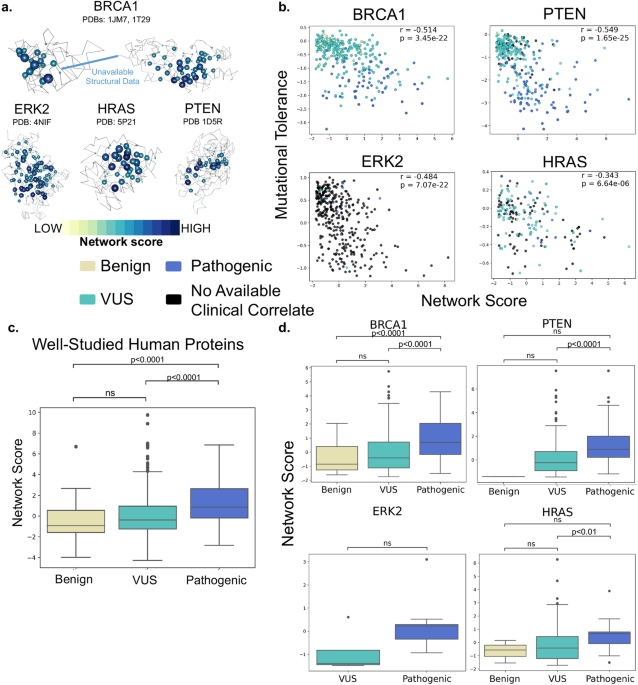
Table 1 Patient sample overview from the AC-ANGIOPREDICT (AC-ANGIOPREDICT) cohort (n = 74 plasma samples, NCT01822444) and University of Mannheim (UMM) cohort (n = 24 plasma samples) that were used for each analysisFig. 1: Analysis of CIN in mCRC tumor tissue and plasma samples.
a Overview of significant copy number aberrations across tumor tissue and plasma samples. Recurrent copy number changes from GISTIC for each sample (x-axis) were plotted with respect to the amplifications and deletions (y-axis), after calculating copy number aberrations with ASCAT without normalization between tumor tissue and plasma samples. b, c Tumor fractions were estimated for the AC-ANGIOPREDICT plasma samples using ichorCNA, and WisecondorX. The significant differences are depicted using the following P values: P < 0.05 (*), P < 0.01 (**), P < 0.001 (***) and P < 0.0001 (****). d–g Kaplan–Meier plots and multivariate Cox regression of overall survival (OS) or progression free survival (PFS) with hazard ratios, 95% confidence intervals and P values for each cluster while correcting for relevant covariates across AC-ANGIOPREDICT tumor tissue or plasma samples. Cluster 1 is considered a reference. Only paired tumor tissue/plasma samples from the AC-ANGIOPREDICT cohort were used.
We next classified each plasma sample according to the CIN classifier, determined previously in tumor tissue12. Most of the LC-WGS plasma samples (50%) were originally categorized as Cluster 1 (low CIN), which is much more frequent than the expected number of low CIN tumors (11%) we reported previously12. However, given the low plasma tumor burden, it is possible that CNAs in plasma samples were underestimated with respect to corresponding tumor tissue samples. We therefore optimized our CNA subtyping approach by adjusting tumor content in each cfDNA sample. Here, we employed a scaling procedure to adjust the CNA profiles. As the tumor fraction (tumor cfDNA) was significantly lower in the plasma of mCRC patients, this procedure was necessary to ensure that the tumor tissue and plasma cfDNA CNA were profiles similar. Therefore, we adjusted the plasma profiles for tumor content. To avoid algorithm bias, we have presented the results from multiple CNA calling methods (i.e. ASCAT, ichorCNA and WisecondorX), to determine copy number profiles from low-coverage whole-sequencing data. Finally, the grouping of cluster 2 and 3 into one cluster (CIN high) is justified since both clusters are comparable in regard to response to BVZ. Following normalization, significantly more CNAs were determined across all samples and results of all tools used to correct for tumor content (see Supplementary Information) are shown in Table 2.
Table 2 Overview of the classification results of the 52 AC-ANGIOPREDICT paired tumor tissue and plasma samples with respect to each bioinformatics software toolFirstly, using ASCAT25, we observed that just 16 out of 52 paired samples (30.8%) had an equal cluster classification in plasma and tumor tissue. Notably, several tumor tissue samples in cluster 3 (high CIN) were incorrectly classified as cluster 1 in plasma (n = 9). Using ichorCNA26, agreement of the paired samples increased to 26 out of 52 samples (50%). Best agreement was established, however, using WisecondorX27, with 37 matching samples out of 52 (71%) being assigned to the same cluster. These data indicate that WisecondorX clustering to generate copy number profiles in plasma is the most effective strategy, likely due to the improved normalization of CNV profiles with respect to healthy controls. Supplementary Fig. 2 illustrates examples of the WisecondorX results of paired tumor tissue and plasma samples. Example 1 shows agreement in the copy number profiles between a matched tumor tissue and plasma sample, which are both assigned to cluster 2. The estimated tumor fractions of tumor tissue and plasma were 39·1% and 25·4%, respectively. Example 2 also demonstrates agreement for cluster 3 samples, with estimated tumor fractions of 27·2% and 31·5% for tumor tissue and plasma, respectively.
Nevertheless, some plasma samples were still incorrectly classified using WisecondorX (see Table 2). We identified 4 out of 52 plasma samples (7·7%) that were classified into cluster 1 while the paired tumor tissue was classified into cluster 2. Example 3 in Supplementary Fig. 2 demonstrates such misclassification, with a tumor fraction of 9.9% in tumor tissue but only 1.8% in plasma. While several CNAs were detected in tumor tissue, the tumor fraction in plasma was too low to accurately assign the plasma sample into cluster 2. In addition, given that the CNV profiles of cluster 2 and cluster 3 in the classifier are relatively similar by definition, we found 6 out of 52 plasma samples (11·5%) classified into cluster 2 with paired tumor tissue being cluster 3, and 5 out of 52 plasma samples (9·6%) classified into cluster 3 with paired tumor tissue being cluster 2. However, both clusters 2 and 3 manifest with high CIN levels and therefore these misclassifications are unlikely to influence response prediction to BVZ12. In conclusion, after refining the bioinformatics pipeline using WisecondorX we were able to correctly cluster 15 additional matching samples compared to using ASCAT. Considering that 7·7% of the plasma samples were incorrectly classified into cluster 1, we obtain an accuracy of 92·3% to distinguish high CNA (cluster 2 and 3) from low CNA (cluster 1) samples in plasma.
For validation of CIN clustering in plasma, subtypes were defined on a second cohort of plasma-derived cfDNA samples from n = 24 mCRC patients who received BVZ ± SOC chemotherapy designated as UMM cohort (Table 1). Since no paired tumor tissue samples were available in this cohort, the mean ratio between the calculated tumor content in plasma and tumor tissue from the AC-ANGIOPREDICT cohort was used as a scaling factor. Nine samples were found to be classified into cluster 1, 7 into cluster 2 and 9 into cluster 3 (Table 3. Although no paired tumor tissue was available, our pipeline with WisecondorX still managed to classify the expected number of samples in the clusters with high CNA levels (cluster 2 and cluster 3).
Table 3 Classification results of the UMM plasma sample cohort, before and after scaling of the copy number profiles, with CIN subtypes shown as P1 (subtype 1), P2 (subtype 2) and P3 (subtype 3)Next, tumor fraction was calculated for all plasma samples in the AC-ANGIOPREDICT cohort using ichorCNA (Fig. 1b) and WisecondorX (Fig. 1c). The tumor fraction as estimated by both tools was similar. The WisecondorX tumor fractions of cluster 1 samples were found to be significantly lower compared to cluster 2 and cluster 3 samples. However, no significant tumor fraction difference between cluster 2 and cluster 3 was found. Given the significant differences between the cluster tumor fractions, these results confirm that correcting for tumor fraction is required to improve CNA classification of mCRC plasma samples, as highlighted above.
Predictive effects of plasma CIN profiles for BVZ in mCRCSurvival within defined clusters of paired samples from the AC-ANGIOPREDICT cohort were assessed in either tumor tissue or plasma (n = 52 samples, see Table 2).
PFS in the AC-ANGIOPREDICT and University of Mannheim (UMM) cohort was defined as the time from start of BVZ therapy to progressive disease or death from any cause (whichever occurred first). For tumor tissue samples, multivariate Cox regression confirmed that both cluster 2 and cluster 3 patients correlated with improved overall survival (Fig. 1d) and progression free survival (Fig. 1e). For overall survival, the hazard ratio’s (HR) for cluster 2 and 3 relative to cluster 1 were 0.02 (confidence intervals (CI) 0.00–0.54, p-value = 0.0213, Cox regression) and 0.01 (CI 0.00–0.41, p-value = 0.0137, Cox regression), respectively. For progression free survival, the HRs for cluster 2 and 3 relative to cluster 1 were 0.01 (CI 0.00–0.41, p-value = 0.0148, Cox regression) and 0.01 (CI 0.00–0.34, p-value = 0.0118, Cox regression), respectively. Thus, data from the prospectively-collected phase II AC-ANGIOPREDICT trial samples corroborate previous findings from the retrospective cohort12. The same effect on overall survival (HR = 0.11, CI 0.01-0.83, p-value = 0.0321 for cluster 2 and HR = 0.13, CI 0.02–0.84, p-value = 0.0323 for cluster 3) and a stronger effect on progression free survival (HR = 0.01, CI 0.00–0.24, p-value = 0.00584 for cluster 2 and HR = 0.01, CI 0.00-0.22, p-value = 0.00533 for cluster 3) was observed for CIN subclusters determined on plasma samples, with an improved response to BVZ in CIN-high (namely cluster 2 and 3) patients (Fig. 1f, g).
Overall, while not all plasma samples were assigned to the same cluster as the corresponding tumor tissue samples, the cluster definition of the plasma samples confirmed that CIN-high mCRC tumors demonstrated improved survival compared to CIN-low tumors under BVZ.
CIN clusters do not manifest distinct nucleosome patternsFragmentation patterns of plasma-derived cfDNA are known to reflect nucleosome positions of cell types contributing to cfDNA15. Since a substantial fraction of cfDNA from cancer patients originates from tumor cells, the cfDNA NF differs between cancer patients and healthy controls28. Here, the AC-ANGIOPREDICT cohort (n = 74, Table 2) was assessed to determine whether NFs could also be used to distinguish mCRC clusters. When plotting the fraction of reads with respect to the distance of each read to the nearest nucleosome center, an M-shaped profile was obtained (Fig. 2a). mCRC plasma samples were observed to be relatively enriched in the center of nucleosomes, while the edges were relatively depleted compared to healthy individuals. Furthermore, when assessing cluster 1 samples only (Supplementary Fig. 3), we observed an enrichment in the center of nucleosomes when compared to healthy control samples. This result confirms that cluster 1 samples represent tumors with low copy number burden (i.e. these results do not merely reflect low tumor purity in these samples).
Fig. 2: Nucleosome footprint in LC-WGS data.
a An M-shaped profile is found when a genome-wide distribution of the distances between the start of each read and the center of the nearest nucleosome is plotted. AC-ANGIOPREDICT mCRC plasma samples are shown in blue lines while healthy control samples are shown in red lines. b Boxplots of the nucleosome scores of mCRC subtypes. The significant differences are depicted using the following P-values: P < 0.05 (*), P < 0.01 (**), P < 0.001 (***) and P < 0.0001 (****).
The degree of nucleosome position deviation in mCRC plasma samples was quantified with respect to reference healthy profiles, whereby a score of 0 corresponds to the healthy profile and a score of 1 corresponds to a mCRC profile. A significant difference (p-value = 0.009, Mann-Whitney test) was observed in the nucleosome scores between cluster 1 and cluster 2 samples (Fig. 2b). In contrast, cluster 3 samples displayed a heterogeneous profile, containing both samples with a low and high nucleosome score. As a result, the nucleosome score profile of cluster 3 samples was not significantly different from cluster 1 (p-value = 0.491, Mann–Whitney test) and cluster 2 samples (p-value = 0.542, Mann-Whitney test). Although it is possible that cluster 1 cfDNA samples consist of different cell types compared to cluster 2 and 3 cfDNA samples, it is more likely that these differences in nucleosome positions correlate with the tumor fraction in these samples. Indeed, we observed strong pairwise correlations between tumor fractions estimated with WisecondorX and nucleosome scores (Spearman’s rho = 0.80, p-value < 0.001), confirming that our nucleosome score reflects the tumor fraction in cfDNA samples.
In addition, we investigated if the combination of NF and CIN data would support improved classification accuracy. Using WisecondorX on the 52 paired samples, we found that CIN was able to classify 37 matching samples out of 52 (71%). When comparing high CNA clusters (cluster 2 and 3) with the low CNA cluster (cluster 1), CIN profiling resulted in an AUC of 0.79. In comparison, using NF for the classification only resulted in an AUC of 0.44 for distinguishing cluster 1 from cluster 2 and 3 samples, possibly owing to the heterogeneous profile of cluster 3 samples shown in Fig. 2b. CIN clusters did not manifest distinct nucleosome patterns. Therefore we did not obtain an improved classification accuracy when combining CIN and NF together (AUC of a CIN/NF combined score = 0.76, down from AUC = 0.79 using CIN alone).
CIN clusters manifest distinct methylation patternsSubtype differences in methylation profiles were also assessed. Targeted bisulphite sequencing was performed on 61 AC-ANGIOPREDICT mCRC plasma samples before treatment and on-treatment (week 6) with BVZ (Table 1), as well as on 41 healthy controls. We first assessed the methylation scores before treatment (Fig. 3a), with samples from cluster 1 demonstrating significantly lower methylation scores compared to cluster 2 and 3 (p-value = 0.000619, Mann-Whitney test). No significant difference between cluster 2 and 3 was found (p-value = 0.235, Mann-Whitney test). There was no correlation between tumor content and the pre-treatment methylation score (Spearman’s rho = 0.29, p-value = 0.083).
Fig. 3: Analysis of targeted methylation profiles.
a Boxplots of methylation score differences at baseline between mCRC clusters. The significant differences are depicted using the following P values: P < 0.05 (*), P < 0.01 (**), P < 0.001 (***) and P < 0.0001 (****). b Comparison of the calculated tumor fractions of the mCRC targeted methylation samples before and after treatment with BVZ. The tumor fractions were determined using ichorCNA from off-target methylation bisulphite sequencing reads. Samples shared by the same patient are connected by grey lines. c Methylation scores of AC-ANGIOPREDICT mCRC samples before and after treatment with BVZ. Samples shared by the same patient are connected by grey lines. d Kaplan–Meier plots and multivariate Cox regression of overall survival (OS) with hazard ratios, 95% confidence intervals (CI-95) and P values for methylation cluster while correcting for relevant covariates across all samples. Methylation cluster “Large decrease” is considered a reference. e Kaplan–Meier plots and multivariate Cox regression of progressive free survival (PFS) with hazard ratios, 95% confidence intervals (CI-95) and P values for methylation cluster while correcting for relevant covariates across all samples. Methylation cluster “Large decrease” is considered a reference.
In addition to CIN clustering, we investigated whether the methylation score from the methylation data and the nucleosome score from LC-WGS can be used for subtype characterization of AC-ANGIOPREDICT plasma samples (n = 40) which were collected pre-treatment. Supplementary Fig. 4 illustrates that in plasma, the methylation score is a more effective metric to distinguish cluster 1 from cluster 2 and 3 samples (AUC = 0.87), compared to the nucleosome score (AUC = 0.75) in this cohort. The efficiency of the methylation score for distinguishing cluster from cluster 2 and 3 samples is comparable to CNA profiling of cfDNA, as we previously found an accuracy of 92·3% using 52 plasma samples paired with tumor tissue. Combining methylation and nucleosome scores into a single combined score using logistic regression did not significantly improve cluster predictability (AUC combined = 0.85) compared to the methylation score alone (AUC = 0.87).
cfDNA methylation changes are predictive of BVZ response outcomeWe next assessed methylation changes in the 40 pre- and on-treatment plasma samples in relation to survival with BVZ. We applied targeted bisulfite sequencing using our in-house developed protocol to reliably assess the methylation status of low concentrations of fragmented cfDNA in plasma. This protocol involved a SeqCap Epi capture assay containing customized capture probes, which were designed to specifically target CpGs that are unmethylated in plasma of healthy subjects and that are hypermethylated in cancer. We performed these analyses for methylation changes, but not CNA subtypes as the latter are unlikely to dynamically change during treatment. Since treatment with BVZ may reduce tumor size and therefore also the amount of cfDNA that is released in the patient blood, the methylation levels of the on-treatment samples were adjusted to accurately identify differentially methylated regions. Figure 3b demonstrates that the tumor content of most samples indeed decreases after treatment with BVZ. Therefore, the methylation values of n = 40 AC-ANGIOPREDICT on-treatment samples were normalized with respect to the tumor content of each plasma sample.
A methylation score was established based on the average methylation levels within each CRC specific probe region and by comparing pre-treatment samples with the methylation levels of healthy individuals. We applied the random forest of the pre-treatment samples to generate methylation scores of the normalized on-treatment samples using the random forest probability, ranging from 0 (healthy) to 1 (tumorigenic), (Fig. 3c). The methylation score of most patient samples decreased following treatment with BVZ, indicating that specific regions undergo hypomethylation during therapy.
Methylation score differences were assessed during treatment to demonstrate their potential in predicting BVZ outcome in the AC-ANGIOPREDICT cohort. Methylation score difference was calculated before and after treatment with BVZ and survival analysis was performed using multivariate cox regression correcting for clinical covariates (e.g. gender, age and TNM-stage). Samples were clustered based on the median of methylation score decreases after treatment (-0.037), with samples above this median categorized into “Small methylation decrease” samples, and samples below this median as “Large methylation decrease” samples. Large methylation score decreases contributed significantly to overall survival (Fig. 3d, p-value = 0.0137). In contrast, samples with a small methylation score decrease were characterized by a shorter median OS. Next, methylation score differences were assessed to see if they influenced PFS. The PFS of “Large methylation decrease” samples was initially improved compared to “Small methylation decrease” samples, but no correlation (p-value = 0.58) was determined (Fig. 3e). As expected, since we normalized methylation values for tumor fraction, we found no significant tumor content differences in the methylation categories, either before (p-value = 0.83) or after (p-value = 0.96) treatment with BVZ. Overall, this demonstrates that hypomethylation of CRC specific regions upon BVZ correlates with improved OS in mCRC.
留言 (0)