
記住我

Patients were diagnosed with breast cancer by biopsy, and the histopathological type proved to be invasive ductal carcinoma. We confirmed their molecular subtype using the immunohistochemical assay, which exhibited ER positivity (> 1%) and HER-2 negativity (score: 0–1+). Specimens that resulted in central HER2 IHC score of 2 + were subsequently subjected to the fluorescence in situ hybridization (FISH) test for further confirmation [17]. Then patients with a HER-2 score of 2 + but negative FISH result were also included. Tumors with other histopathological types and molecular subtypes were excluded from the study. All samples were obtained from the operation without neoadjuvant therapy. Finally, 50 tissue samples from patients with ER + breast cancer was collected for further proteomics analysis, including 25 cancer tissues and corresponding adjacent normal tissues as control. This study was approved by the Ethics Committee of Sun Yat-sen University Cancer Center (SL-G2023-300-01).
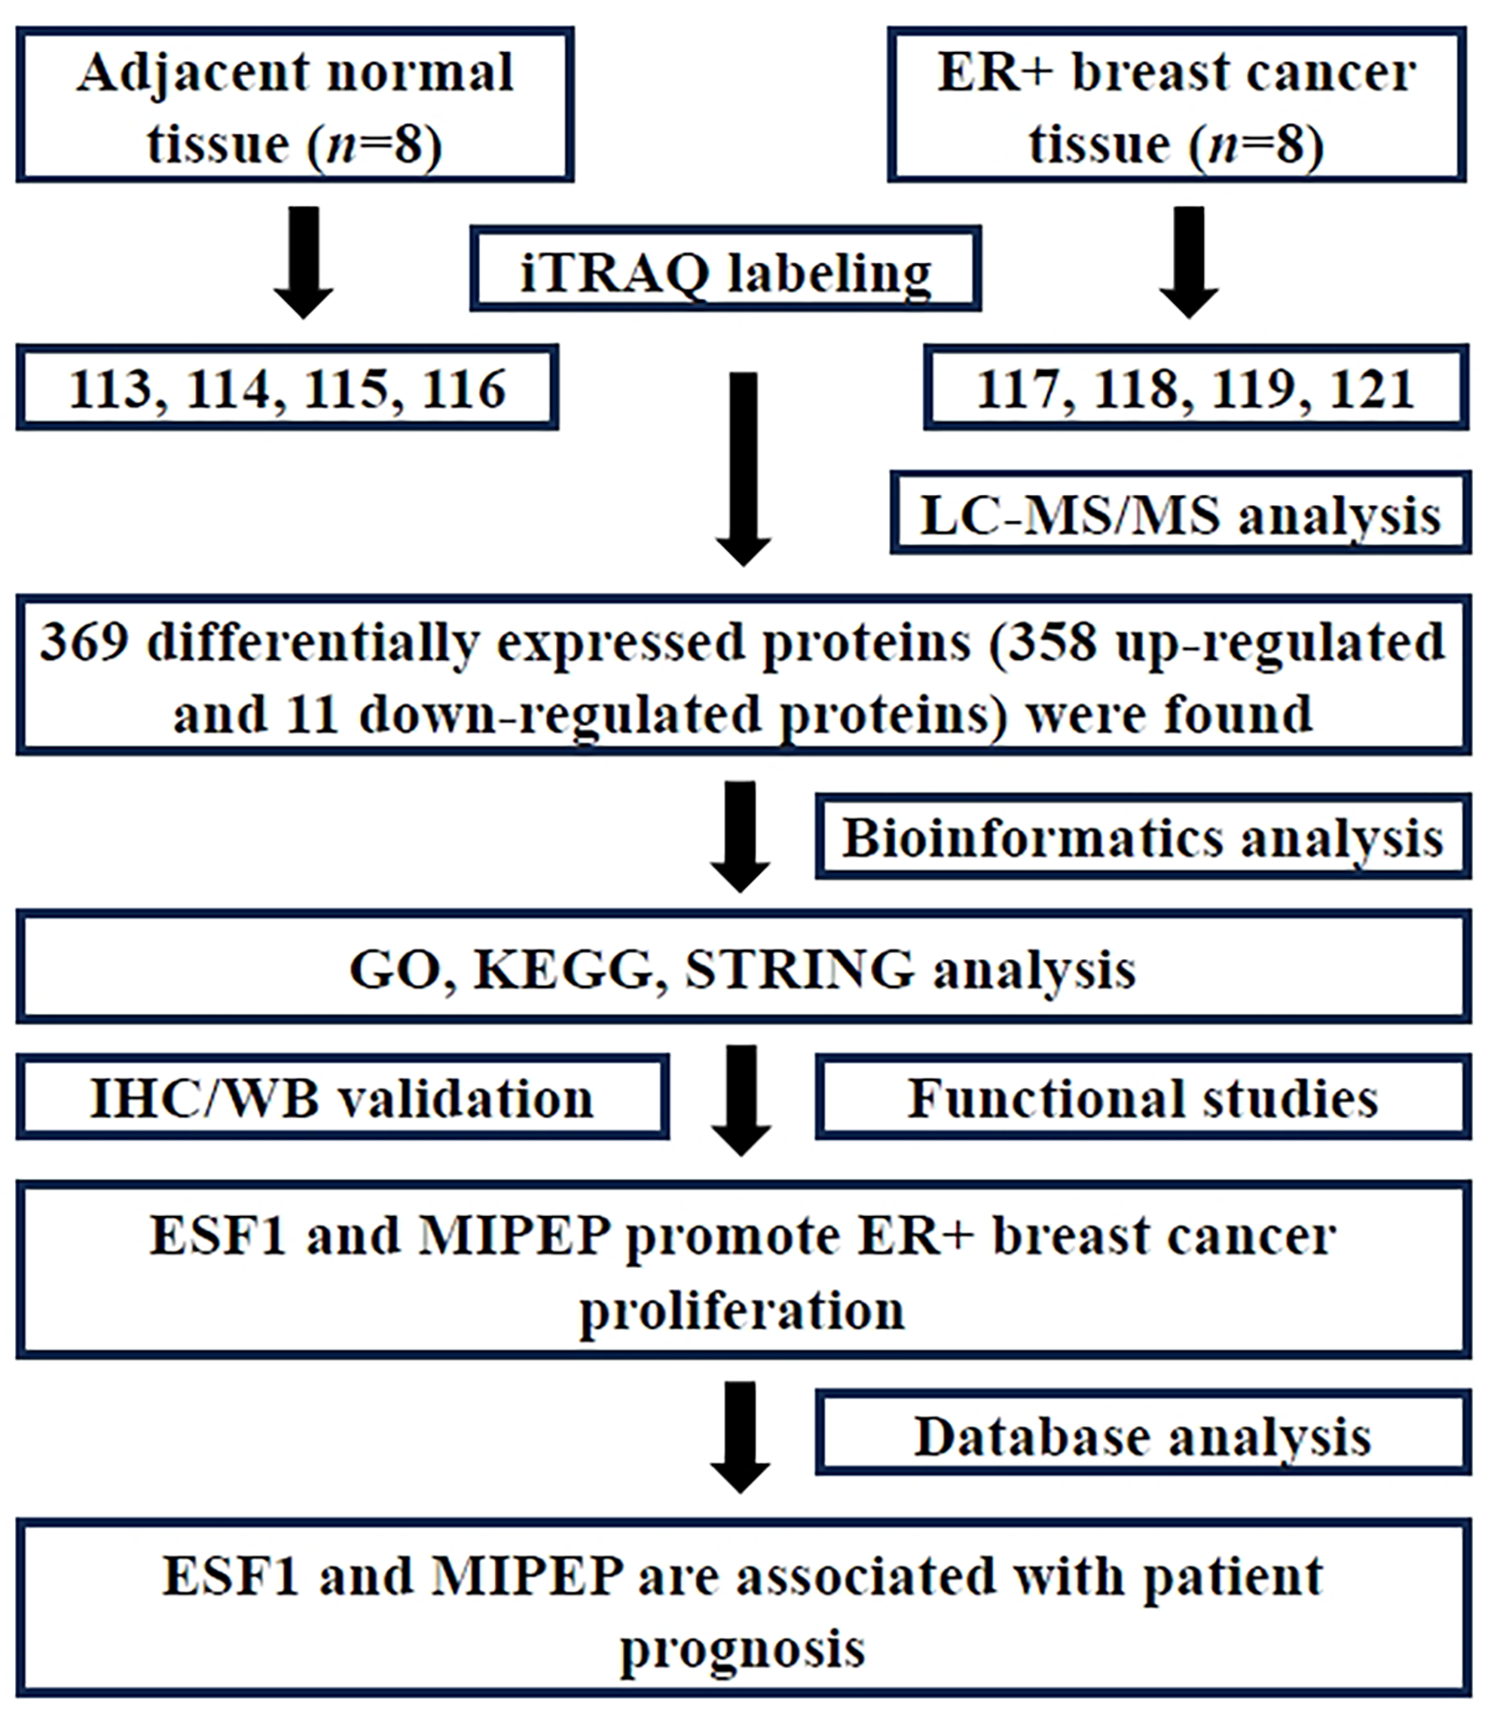
iTRAQ labelingThe control group (adjacent normal tissue) and ER + breast cancer group each provided eight tissue samples, which were then mixed into four pools respectively. We named control group N1, N2, N3, N4, and ER + breast cancer group T1, T2, T3, T4. Then, protein samples (100 µg) were digested into peptides with trypsin (Promega, USA). Next, iTRAQ labeling was performed using the iTRAQ 8PLEX Multiplex kit (Applied Biosystems Sciex, #4,381,664). Groups N1, N2, N3, N4 and T1, T2, T3, T4 were labeled with iTRAQ reagent individually (including N1-iTRAQ 113 reagent, N2-iTRAQ 114 reagent, N3-iTRAQ 115 reagent, N4-iTRAQ 116 reagent, T1-iTRAQ 117 reagent, T2-iTRAQ 118 reagent, T3-iTRAQ 119 reagent, and T4-iTRAQ 121 reagent) following the instructions of the manufacturer.
Mass spectrometric analysisWe carried out mass spectrometric analysis as previously reported [18]. The iTRAQ-tagged peptide was reconstituted and loaded onto Phenomenex columns (Gemini-NX 3u C18 110 A; 150*2.00 mm) using a Dionex UltiMate 3000 HPLC system (A-phase: 20mM HCOONH4, PH 10, B-phase: 20mM HCOONH4, 98%CAN, PH 10). After the peptides were eluted with a linear gradient, 15 fractions were collected at 1-minute intervals. Then, we conducted nano LC-MS/MS analysis adopting Q Exactive HF-X (Thermo Scientific). MS data was acquired using a data-dependent top 20 method, the most abundant precursor ions were chosen, and fragmentation with each component was analyzed for 100 min.
Protein identification and data analysisPD™ Software 2.4 (Thermo Scientific) was used for protein identification and quantification. Database searching parameters were as follows. Sample type: iTRAQ 8 plex (peptide labeled), Cys alkylation: MMTS, digestion: trypsin, FDR < 1%, First level error: 10ppm, Secondary error: 0.02Da. The paired t-test was adopted to identify statistically significant differences (P < 0.05) between breast cancer and controls, with a fold change threshold of ≥ 2.0 or ≤ 0.66. A minimum of two peptide matches in common was considered as differential expression of proteins.
Bioinformatics analysesThe “clusterProfiler” package of R software was used to conduct the functional enrichment analysis on DEPs, which included KEGG and GO analysis. Enrichment analysis was carried out separately for biological process, molecular function, and cellular component categories. We adjusted the P values using the Benjamini - Hochberg (BH) technique. The pathways with an adjusted P value and false discovery rate (FDR) below 0.05 were considered statistically significant. Additionally, we set a threshold of Fold Enrichment ≥ 2 and Gene Number ≥ 5. Statistical analysis and ridge mapping were carried out by the “clusterPro” package in R, which is a non-parametric unsupervised analytic method. It is mainly used to determine whether certain metabolic pathways are enriched across samples by analyzing the expression matrix of gene sets. Protein-protein interaction networks of DEPs, including direct and indirect interactions, were analyzed by STRING analysis (http://www.string-db.org). Then we adopted Cytoscape and cytohHubba platform to identify the hub objects, and all parameters were defaulted during this process.
Immunohistochemical (IHC) stainingAfter de-paraffinization and rehydration, paraffin slides were heated in sodium citrate buffer to unmask the antigen. 3% hydrogen peroxide was used to block endogen peroxidases. Slides were washed twice, then each section was blocked with 5% BSA for 20 min. After washing the slides 3 times, we draw a circle around the tissue section. Slides were blocked for 15 min each with avidin and biotin. Then, slides were incubated with primary antibody ESF1 (proteintech#23496-1-AP) or MIMEP (proteintech#11002-1-AP) overnight. After incubation with secondary antibodies for 30 min, DAB was incubated for 5 min as substrate. The stained slides were imaged under an optical microscope (NIKON ECLIPSE 80i).
Cell culture and siRNA transfectionMCF-7 cells (human breast cancer cells) and MCF-10 A cells (normal human breast epithelial cells), identified by STR, were bought from Cell Bank (Shanghai, China). The culture conditions for these cells involved DMEM supplemented with 10% Fetal Bovine Serum (FBS) and 1% Penicillin-Streptomycin Solution (P.S) under 5% CO2 and 37 °C. The synthesis of siRNA for ESF1 and MIPEP, as well as the transfection reagents RNAi-Mate, were procured from Genepharma (Shanghai, China). The sequences of siRNAs for ESF1 were 5′-CCCAGAAUCGAGUGUUCUA-3′ and 5′- UAGAACACUCGAUUCUGGG-3′. The sequences of siRNAs for MIPEP were 5′-GGUGCGAGAAGCUGCUUAU-3′ and 5′-AUAAGCAGCUUCUCGCACC-3′. The siRNA powder was dissolved in DEPC-treated water. As instructions provided by the manufacturer, the siRNA was blended with transfection reagents and thoroughly mixed with the resuspended logarithmically growing MCF-7 cells before being seeded onto plates. Cells were collected after a 36-hour transfection period. Their RNAs and proteins were extracted to assess the expression levels of ESF1 and MIPEP in both the control and knockdown groups by qPCR and western blot.
RT-qPCRRNA was extracted from the cells using an RNA extraction kit (Accurate Biology, AG21023) 36 h after transfection. Subsequently, the RNA was reverse transcribed into cDNA using the reverse transcription kit (Accurate Biology, AG11728), followed by quantitative PCR using real-time PCR kits (Beyotime, D7260). The primer sequences for the internal control β-actin were 5′-AACACCCCAGCCATGTACGT-3′ and 5′-CCCTCGTAGATGGGCACAGT-3′. For ESF1, the primer sequences were 5′-TGGTAGGACTGCGGACGTAT-3′ and 5′-ATCTCGGGTCCTTTGCAACC-3′. The primer sequences for MIPEP were 5′-GTTGGAGGAAGGGACTGCTC-3′ and 5′-ACTCCAAAAAGACCCCGGC-3′.
Western blotThe cells were lysed directly by protein lysis buffer (Beyotime, Cat#P0013B, Shanghai, China). Subsequently, protein loading buffer (Beyotime, Cat#P0015, Shanghai, China) was added, and the mixture was boiled for 5 min to prepare the protein loading samples. These protein samples underwent separation using a sodium dodecyl sulfate-polyacrylamide gel electrophoresis (SDS-PAGE) gel and were subsequently transferred onto a polyvinylidene fluoride (PVDF) membrane. The membrane carrying the proteins was blocked using a fast-blocking buffer (Beyotime, Shanghai, China), and then incubated overnight at 4℃ with primary antibodies ESF1 (proteintech#23496-1-AP) or MIPEP (proteintech#11002-1-AP) overnight. Secondary antibodies conjugated with horseradish peroxidase (HRP) were adopted. Following a washing step, the ECL Chemiluminescence Reagent Kit (Beyotime, Shanghai, China) was applied to detect the target protein.
Wound healing assayTransfected MCF-7 cells were seeded into 12-well plates until they reached full confluence. Wounds were created using sterile and clean pipette tips, followed by replacing the medium with DMEM containing 1% FBS. Subsequently, digital images were captured using an inverted microscope at 0, 24, 48, and 72 h after medium replacement. The relative migration rate was determined by normalizing the wound area distance measured at 0 h.
Colony formation assayCells were plated at a density of 1500 cells per well in 6-well plates containing 2 mL of DMEM medium supplemented with 10% FBS 48 h after siRNA transfection. After a two-week incubation time at 37 °C, the culture medium was aspirated, and the cells in plates were fixed by ice-cold methanol. Subsequently, cells were stained with crystal violet solution (Beyotime, Cat#C0121, Shanghai, China) for 20 min. We used a camera to capture the photographs of cell-stained images of each well. The ImageJ software was employed to analyze the number and relative area of cell colonies in each well. The number and size of cell colonies in each group were compared with the control group, and their relative colony number and size were calculated.
Cell cycle and apoptosis assayCells were seeded into a 6-well plate 48 h after transfection. They were harvested and resuspended using trypsin without EDTA 24 h after seeding. The cells were divided into two portions, following instructions provided by the manufacturer. One portion was subjected to the cell cycle detection kit (KeyGene, Cat#KGA512, Nanjing, China), while the other portion was processed using the annexin V-AF647/PI apoptosis detection kit (Goonie, Cat#100–102, Guangzhou, China). Flow cytometry (BD FACS Aria II, CA, USA) was adopted to assess the changes in cell cycle arrest and apoptotic cell populations.
Statistical analysisNormally or near normally distributed variables were reported as means with standard deviations (SD) and were compared using Student’s t-tests when applicable. Non-normally distributed continuous data were reported as medians with ranges and were compared using Mann–Whitney U-tests. GraphPad Prism 8 (GraphPad Software, USA) was used for all statistical analyses. A P-value less than 0.05 was considered statistically significant. *P < 0.05, **P < 0.01, and ***P < 0.001.
ResultClinical characteristics of enrolled patientsAll tissue samples were obtained from female patients diagnosed with ER + breast cancer by the Sun Yat-sen University Cancer Center. The patients enrolled in this study ranged from 26 to 80 years old. According to the TNM classification system, all patients were stage I - IIIc with histopathological grade 2–3. By Immunohistochemical staining and fluorescence in situ hybridization (FISH), we confirmed that the collected breast cancer tissue was ER-positive and HER-2-negative (Table 1).
Table 1 Clinical characteristics of patients diagnosed with estrogen receptor-positive breast cancerDifferential expression proteins screened by iTRAQ proteomicsThe iTRAQ labeling identified a total of 136,944 peptide spectrum matches (PSMs), which were present in 37,203 proteins. Due to the presence of common peptide sequences among certain proteins, it was necessary to group them based on sequence homology and isoforms, resulting in the identification of 4267 protein groups (Fig. 2A). Continuing the analysis of protein sequence coverage, 308 proteins exhibited coverage between 50 and 100%, 472 proteins between 30 and 50%, 1106 proteins between 10 and 30%, and 2381 proteins below 10% (Fig. 2B). According to the criteria of ratio fold change ≥ 2.0 or ≤ 0.66, it was defined as the differential expression protein of interest when its P < 0.05. Compared with adjacent normal tissue, there were 358 proteins up-regulated and 11 proteins down-regulated in ER + breast cancer tissue (Supplementary Table 1).
Fig. 2
Proteomic profiling of ER + breast cancer. (A) Number of identified peptides and proteins acquired from iTRAQ analysis. (B) Identified proteins were classified based on the percent coverage of protein sequences, displayed as follows. Percent coverage of protein sequences (%), number of proteins (n), total proportion (%)
The GO and KEGG analysis of differential expression proteinsWe conducted GO (Gene Ontology) and KEGG (Kyoto Encyclopedia of Genes and Genomes) analysis on differentially expressed proteins. GO analysis included three dimensions: biological processes (BP), cellular components (CC), and molecular function (MF). In the BP group, differentially expressed proteins were mainly enriched in mRNA processing, RNA splicing, and their regulation. Certain proteins particularly accumulated in mitochondrial matrix and nuclear envelope within the CC category. At the same time, related proteins mainly aggregated in cadherin binding and single-stranded RNA binding in the MF group (Fig. 3A). The KEGG analysis result indicated that differentially expressed proteins were mainly enriched in mRNA processing and metabolic regulation pathways (Fig. 3B). Notably, significantly upregulated proteins related to metabolism included phosphomevalonate kinase, ribokinase, phosphopentomutase, and glyceraldehyde-3-phosphate dehydrogenase.
Fig. 3
The GO and KEGG analysis of differentially expressed proteins in ER + breast cancer. (A) Gene Ontology analysis revealed the enrichment of differentially expressed proteins in biological processes, cellular components, and molecular function categories. (B) The KEGG analysis showed signaling pathway enrichment. Circle area represented the number of differentially expressed proteins in each pathway term, and color represented the adjusted P-value
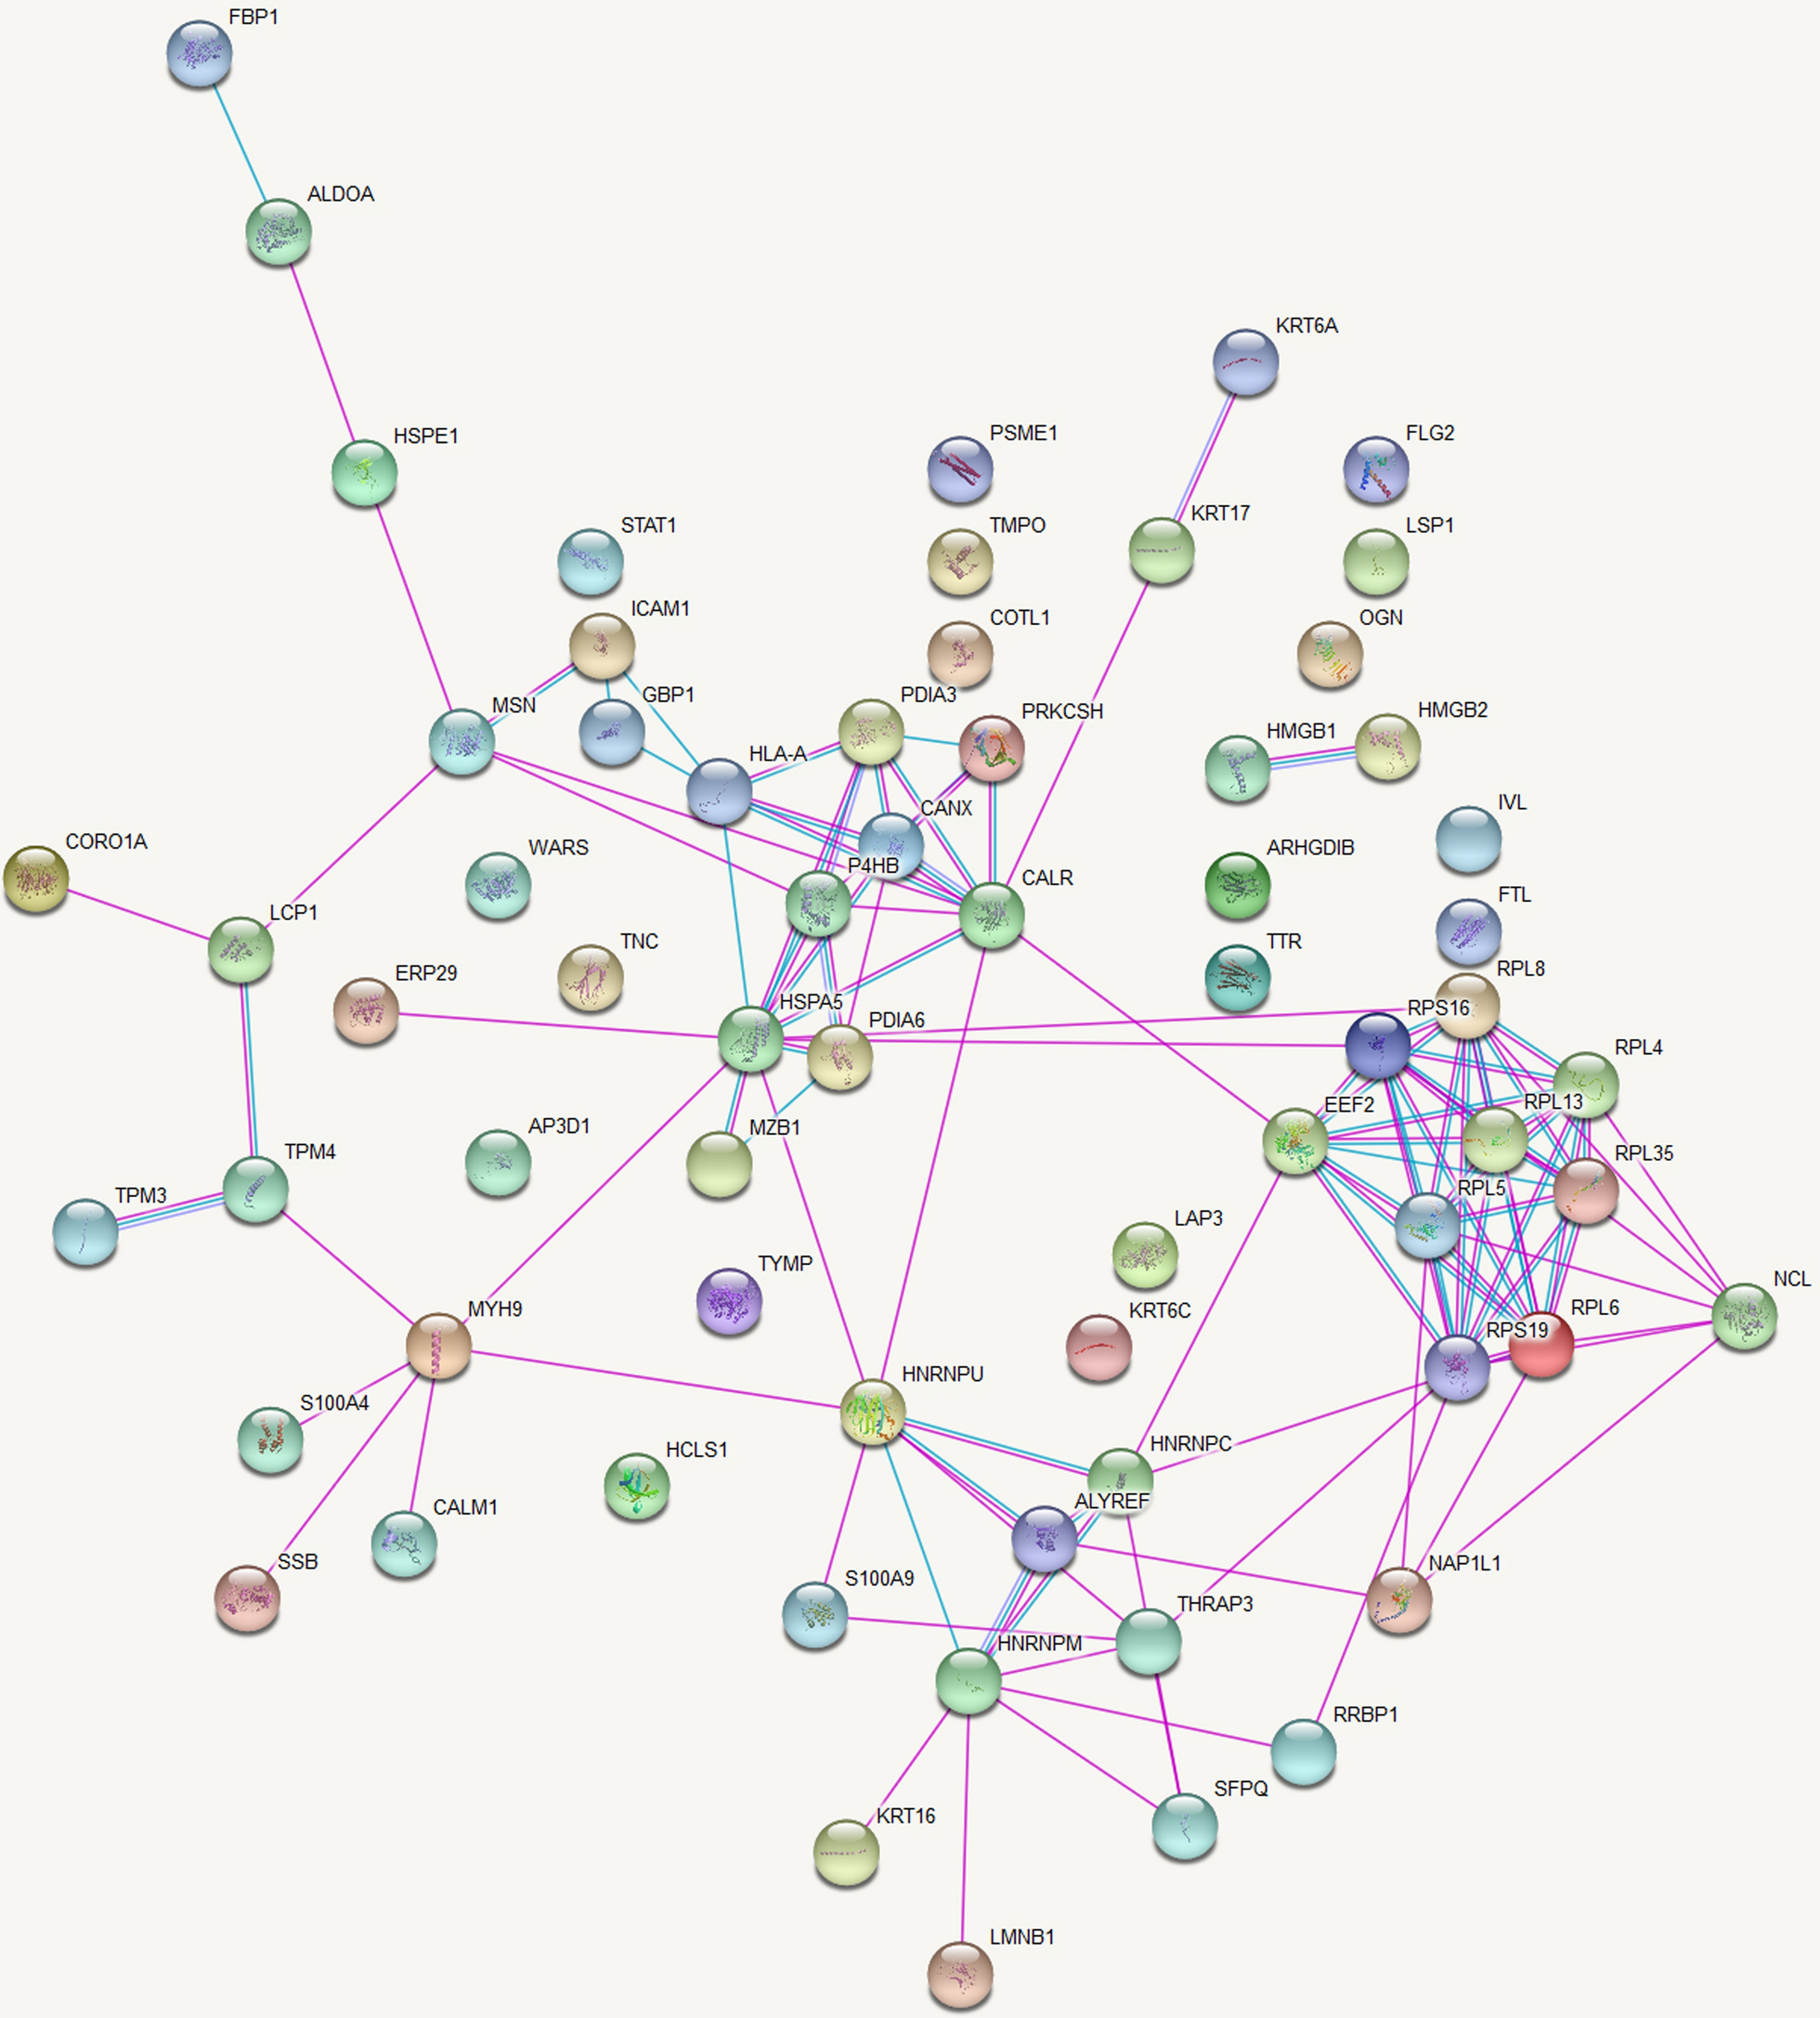
STRING analysis selected candidate proteinsBiological processes are regulated through complex network systems in which components interact with each other through various pathways. STRING analysis of differentially expressed proteins was constructed to better understand ER + breast cancer’s pathogenesis. The top 200 hub proteins proteins were displayed (Fig. 4). As could be seen from the network diagram, numerous proteins were distributed at the intersections of core transportation hubs, such as ESF1 (ESF1 nucleolar pre-rRNA processing protein homolog), MIPEP (mitochondrial intermediate peptidase), TMEM24 (C2 calcium dependent domain containing 2 like, also named C2CD2L), and SART1 (Spliceosome associated factor 1 recruiter of U4/U6.U5 tri-snRNP). This indicated that they might play an important role in the development of ER + breast cancer. To identify novel tumor antigens and potential therapeutic targets, the functions of candidate proteins were further analyzed through PubMed literature retrieval. We found that the ESF1 and MIPEP proteins have never been reported in the field of breast cancer research.
Fig. 4
The protein-protein interaction network analysis. The top 200 hub proteins were displayed. Nodes are proteins, and lines represent functional associations between proteins. Red indicates that the protein is more functionally related to other proteins
ESF1 and MIPEP expression upregulated in ER + breast cancerTo further confirm the expression of candidate proteins, iTRAQ quantification in the MS/MS spectrogram was analyzed. We discovered that both ESF1 and MIPEP were upregulated 2.91-fold and 3.26-fold in the ER + breast cancer group, respectively (P < 0.01) (Fig. 5A-B). Subsequently, we conducted IHC staining to confirm the expression of ESF1 and MIPEP (Fig. 5C). 25 pairs of tissue sections derived from patients with ER + breast cancer were included. Compared with the adjacent normal tissue group, the expression of ESF1 in the ER + breast cancer group was increased by 1.91 times (P < 0.001) (Fig. 5D). Similarly, MIPEP demonstrated a 2.92-fold upregulation in ER + breast cancer tissue (P < 0.001) (Fig. 5E). The expression of ESF1 and MIPEP proteins was further validated in an independent cohort (CPTAC dataset, https://ualcan.path.uab.edu/analysis-prot.html) (Supplementary Fig. 1A-B). These results indicated that the expression of ESF1 and MIPEP was upregulated in ER + breast cancer.
Fig. 5
Verification of ESF1 and MIPEP expression in human breast cancer tissue. (A-B) A representative MS/MS spectrum indicated important peptide segments for ESF1 and MIPEP. iTRAQ tags showed the relative expression of these proteins individually in ER + breast cancer compared to the control. (C) Representative images of ESF1 and MIPEP immunohistochemical staining in ER + breast cancer tissue. Scale bars, 200 μm. (representative images are from 25 pairs of tissue sections). (D-E) Statistical analysis of ESF1 and MIPEP expressions in breast cancer tissues compared to corresponding adjacent normal tissue. Statistical analysis was performed using the paired t-test. All data were represented as mean ± s.d. (n = 25 per group). ***P < 0.001
ESF1 and MIPEP promote breast cancer cell proliferationTo better understand the functions of ESF1 and MIPEP in ER + breast cancer, we performed a series of in vitro experiments. Firstly, we confirmed that ESF1 and MIPEP expression were upregulated in MCF-7 cells compared with MCF-10 A cells (Fig. 6A). After siRNA transfection, ESF1 gene and protein expression decreased dramatically in MCF-7 cells, which were detected by RT-qPCR and western blot (Fig. 6B-C). Similarly, a significant reduction in MIPEP gene and protein expression was observed post-transfection (Fig. 6D-E). The number and size of cell colonies decreased obviously after ESF1 and MIPEP knockdown, which were verified by the colony formation assay (Fig. 6F-H). In the wound healing assay, ESF1 knockdown compromised the wound healing rate, whereas MIPEP knockdown showed no significant changes (Fig. 6I-J). Besides, cell cycle analysis revealed that the S phase cells in the ESF1 knockdown group reduced significantly, while the G1 phase cells in the MIPEP knockdown group decreased obviously (P < 0.01) (Fig. 6K-L). In addition, the knockdown of ESF1 and MIPEP resulted in increased cell apoptosis rates (P < 0.05) (Fig. 6M-N). These findings proved that ESF1 and MIPEP played a crucial role in promoting breast cancer cell proliferation.
Fig. 6
Functional effects of ESF1 and MIPEP on breast cancer cells. (A) The ESF1 and MIPEP proteins expression in human breast cancer cell line MCF-7 and human normal breast epithelial cell line MCF-10 A assessed by western blot. (B-C) The expression of ESF1 was verified by real-time PCR (B) and western blot (C) after ESF1 siRNA transfection in MCF-7 cells (n = 3 independent experiments). (D-E) The expression of MIPEP was tested by real-time PCR (D) and western blot (E) after MIPEP siRNA transfection in MCF-7 cells (n = 3 independent experiments). (F-H) The colony formation assay of MCF-7 cells (F). The relative number (G) and relative area (H) of colonies in different groups were calculated and compared with the scramble group (n = 3 independent experiments). (I-J) The wound healing assays of MCF-7 cells (n = 3 independent experiments). Digital images were captured at 0, 24, 48, and 72 h by using an inverted microscope (I). Compared with the scramble group, cell migration rates of different groups were quantified (J). (K-L) The cell cycle assay of MCF-7 cells (n = 3 independent experiments). The represented results in each group (K). Comparison of cell percentage in the G1 and S phases among different groups (L). (M-N) The cell apoptosis assay of MCF-7 cells (n = 3 independent experiments). The represented results of detection in each group (M). Comparison of normal cells (Q1 region) and early apoptotic cells (Q3 region) among different groups (N). Statistical analysis was performed using the paired t-test. All data were represented as mean ± s.d. ns, not significant. *P < 0.05. **P < 0.01. ***P < 0.001. ****P < 0.0001
ESF1 and MIPEP are associated with patient prognosisTo clarify the clinical significance of ESF1 and MIPEP, we searched and analyzed the online database, such as the Kaplan Meier (KM) plotter. We found that patients with higher ESF1 protein expression were inclined to have worse overall survival (OS) (Fig. 7A). The high MIPEP protein expression group tended to have a shorter OS period compared with the low expression group (P = 0.08) (Fig. 7B). Due to the limited sample size of the online database, no significant difference was found between the high and low expression groups. However, the curves of the two groups were separated clearly, indicating that the expression of ESF1 and MIPEP proteins might be related to patient’s prognosis.
Fig. 7
The clinical value of ESF1 and MIPEP proteins. (A) Kaplan-Meier plot of overall survival (OS) between patients with high and low ESF1 protein expression. (B) Kaplan-Meier plot of OS between patients with high and low MIPEP protein expression. Statistical analysis was performed using the log-rank test (n = 32)
留言 (0)