
記住我
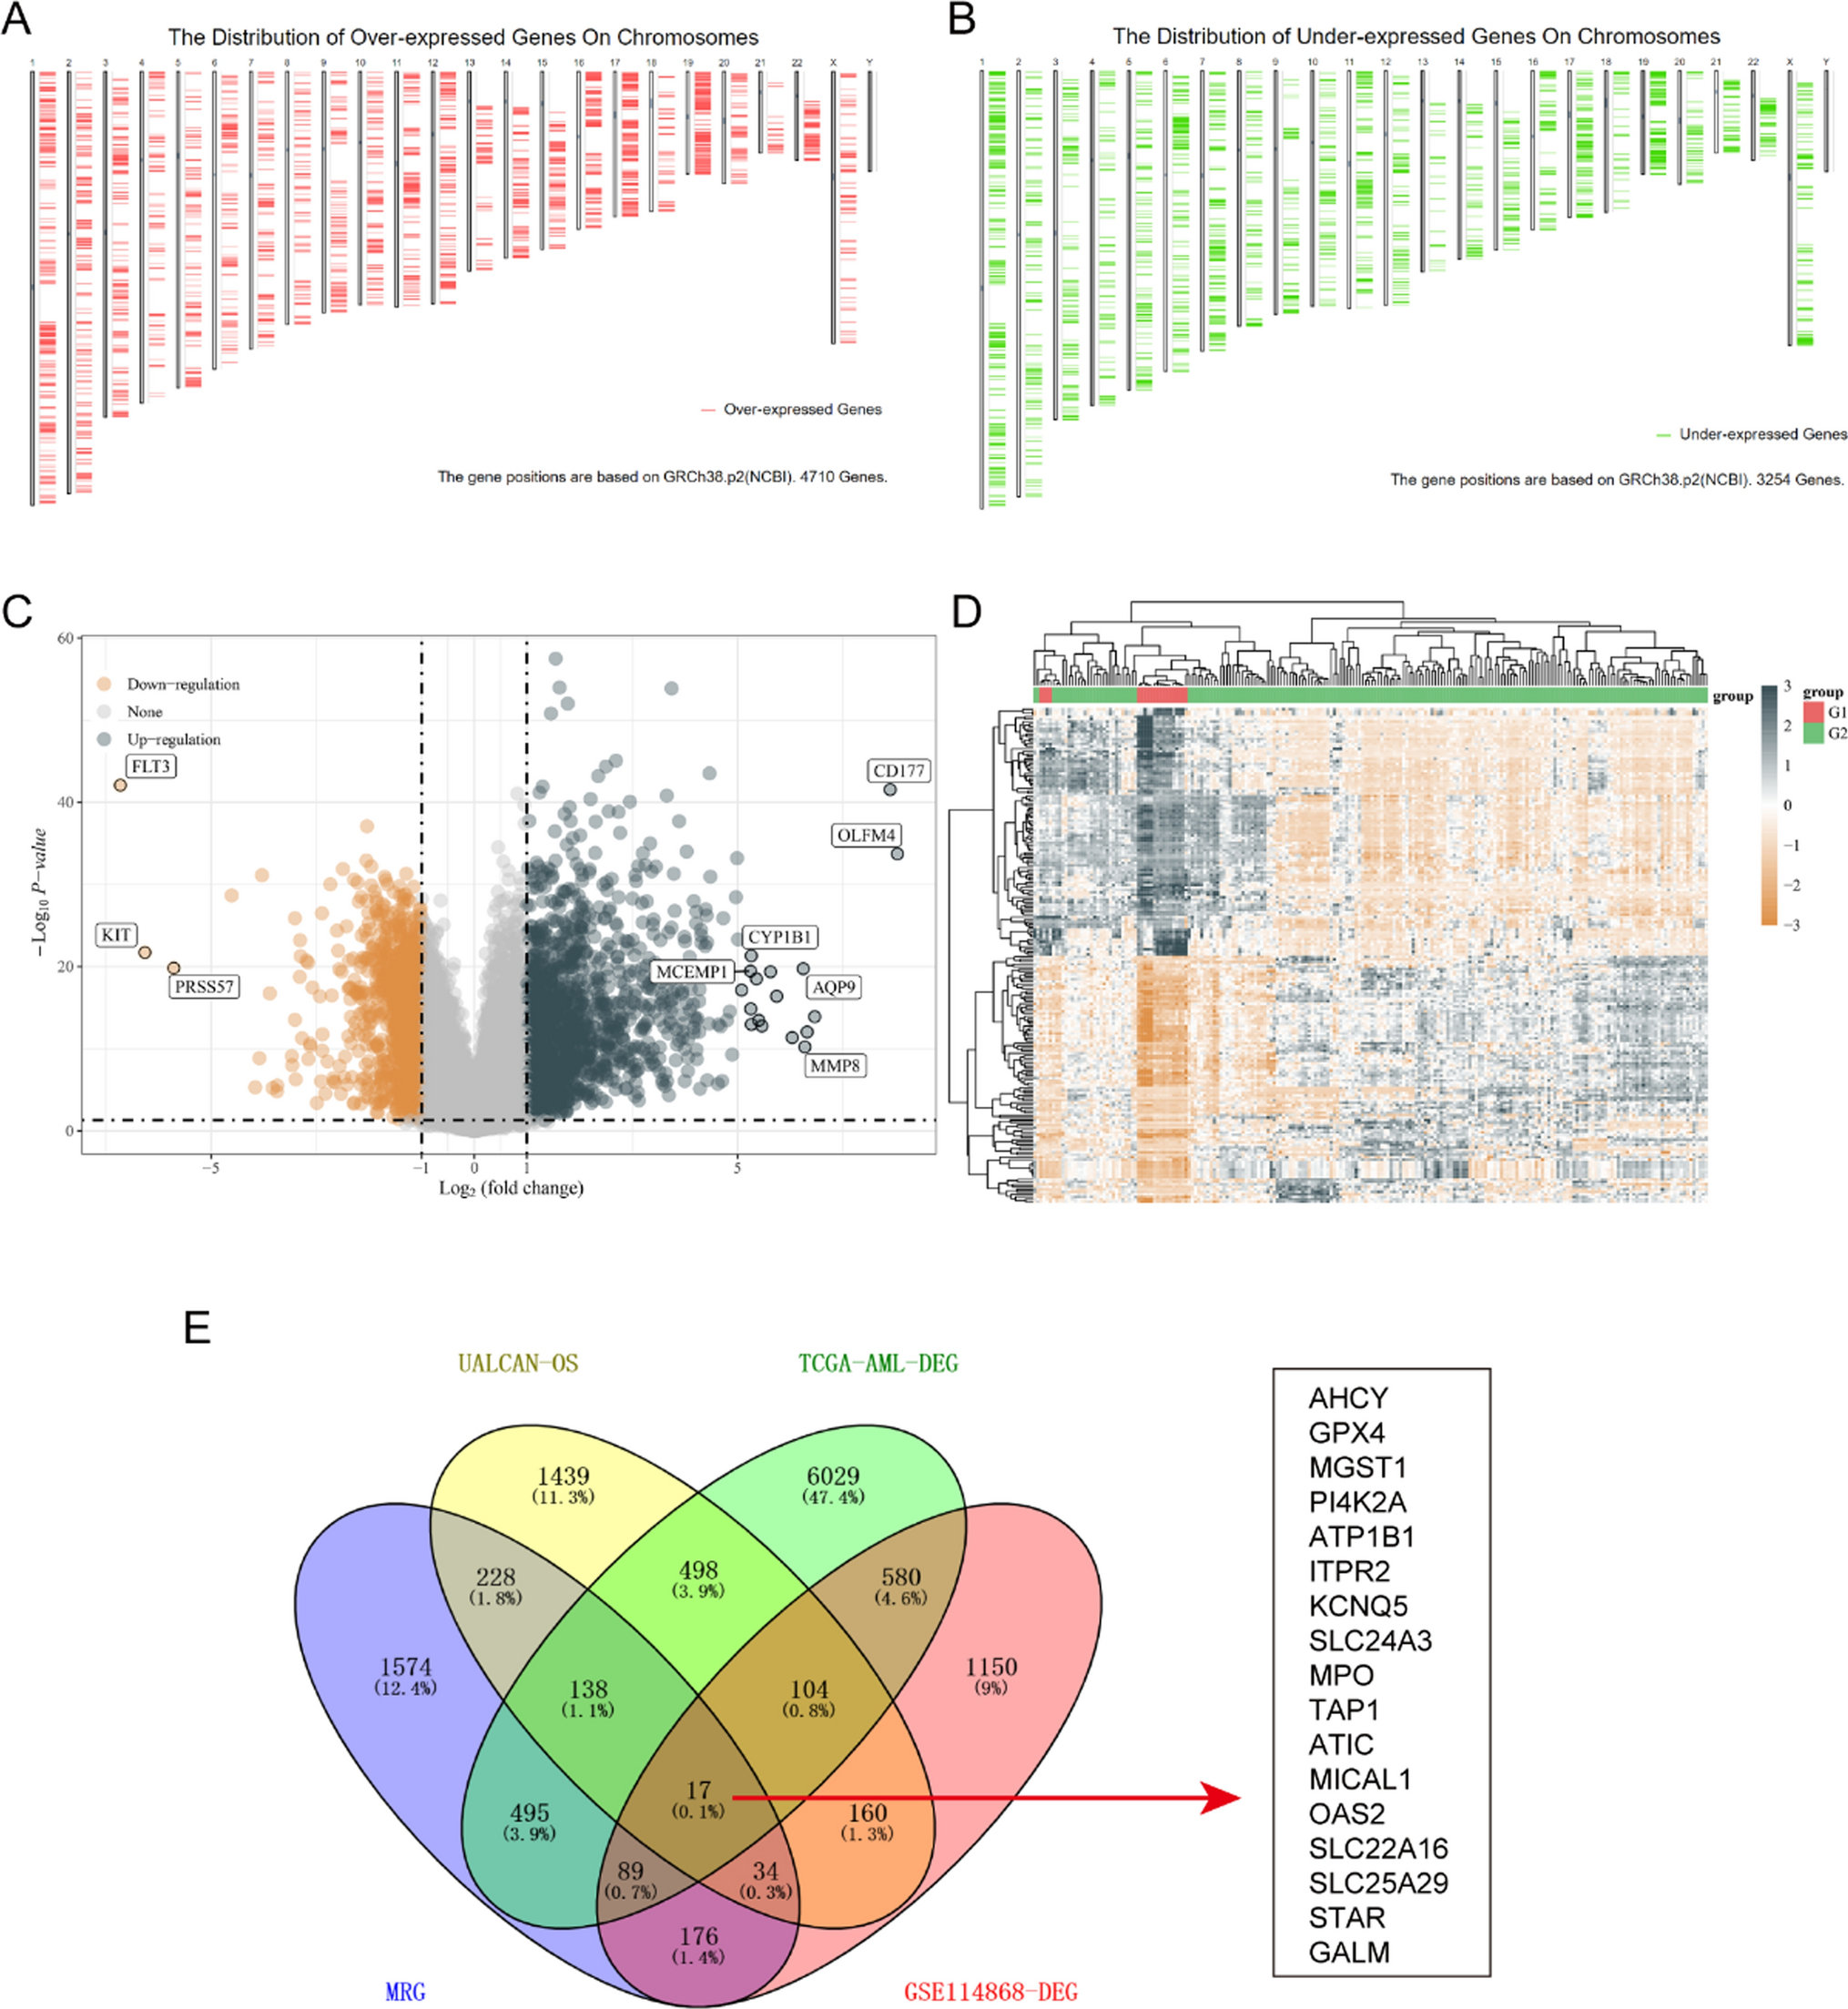
To discover the potential genes which might be selected as possible therapy targets in AML, we first downloaded the over-expressed and down-expressed in AML tumor samples using GEPIA database. Since there were no paired normal sample data of AML in TCGA database, the GEPIA database used GTEx data, and there were 173 AML tumor samples from TCGA datasets and 70 normal samples from GTEx datasets. The distribution of over- and down-expressed genes on chromosomes were respectively presented in Fig. 1A and B, and the total DEGs in AML (named TCGA-AML-DEGs) were 7964 (|logFC|> 1). Afterwards, we analyzed the GSE114868 data to further verify the deferentially genes (DEGs) in AML, and 1273 up-regulated and 1037 down-regulated genes were obtained. The corresponding volcano plot and heatmap of these DEGs from GSE114868 data were displayed respectively in Fig. 1C and D. Then, we sought to obtain the overlap genes of MRGs (2752 genes), TCGA-AML-DEGs (7964 genes), GSE114868-DEGs (2310 genes) and UALCAN-OS (2618 genes with significant overall survival in AML from UALCAN database) using venny website, and 17 overlap MRGs were identified (Fig. 1E).
Fig. 1
Overlap MRGs obtainment. A and B The distribution of over- and down-expressed genes on chromosomes were respectively presented. C Volcano plot of DEGs in GSE114868. D DEGs’ heatmap in GSE114868. E The overlap genes of MRGs, TCGA-AML-DEGs, GSE114868-DEGs and UALCAN-OS
3.2 The expression and survival analyses of 17 overlap MRGs across cancer typesNext, we employed GSCA database to study the 17 overlap MRGs’ expressions in pan-cancers. We observed that the 17 overlap MRGs exhibited different expression levels in different cancers (Fig. 2A). For instance, genes like SLC24A3, GALM, MPO, and ATP1B1 appear to be commonly down-regulated across various solid cancers, while other MRGs are frequently up-regulated in many cancer types. The expression patterns of these 17 overlapping MRGs were further investigated in relation to clinical and pathological stages. The data demonstrated that nearly all the genes had no significant difference between different clinical stages in pan-cancers, and half of the 17 overlap MRGs had obvious expression difference in pathological stages in KIRC, KIRP, THCA and BLCA but no significant difference in other cancers’ pathological stages (Fig. 2B). Moreover, the OS and PFS of the 17 overlap MRGs in cancers were assessed, and the data revealed that most of the 17 overlap MRGs had significant OS or PFS in kinds of cancer types (Fig. 2C).
Fig. 2
Expression and survival analysis of 17 overlap MRGs in cancers. A The relative mRNA levels of 17 overlap MRGs in pan-cancers. B The expression of the 17 overlap MRGs in clinical stages and pathological stages. C The analysis of the OS and PFS of the 17 overlap MRGs in cancers
3.3 Genetics changes and methylation analyses of 17 overlap MRGs in pan-cancersGenetic changes including the SNV and the CNV were further evaluated. The SNV percentage heatmap from USCA database based on TCGA data elucidated that most of the 17 overlap MRGs had SNV mutation in UCEC, SKCM and COAD, while the the 17 overlap MRGs had no SNV in the majority of cancer types (Fig. 3A). Additionally, the CNV mutation frequencies of the 17 overlap MRGs were assessed, and the results of the pie plots suggested that most of 17 overlap MRGs had CNV in most cancer type except in AML, PCPG and THCA, and the CNV type of these genes was mainly heterozygous amplification (Fig. 3B). Subsequently, 17 overlap MRGs’ methylation levels were evaluated, and we found that more than half of the 17 overlap MRGs’ methylation levels in tumor samples of the majority of cancer types were higher than that in the corresponding normal tissues (Fig. 3C).
Fig. 3
SNV, CNV and methylation analyses of overlap MRGs. A The SNV analysis. B The CNV analysis. C Methylation difference in each cancer types
3.4 GSVA analysis of the 17 overlap MRGsThe 17 overlap MRGs as a whole were then subjected for GSVA analysis. As the data presented in Fig. 4A, the GSVA scores of the 17 overlap MRGs were higher in tumor samples of the most cancer types than that in the corresponding normal tissues. Then, the GSVA scores in clinical stages and pathological stages of kinds of cancer types were also estimated (Fig. 4B). Furthermore, the correlations between the GSVA scores and many signaling pathway activity was also determined, and the results proved that the GSVA score consisted with 17 overlap MRGs was positive correlation with apoptosis, EMT, hormone ER, and negative correlation with DNA damage and cell cycle in many tumors (Fig. 4C). Finally, the survival analyses of the high and low GSVA score suggested that higher GSVA score had poor OS, PFS, and DSS in COAD and KIRC, and there seemed to be no significant difference in other cancer types (Fig. 4D).
Fig. 4
Overlap MRGs’ GSVA (Gene Set Enrichment Analysis) analysis. A GSVA scores of the 17 overlap MRGs in pan-cancers. B The analysis of the GSVA scores in clinical stages and pathological stages of pan-cancers. C The correlations between the GSVA scores and many signaling pathway activities. D The survival analyses of the high and low GSVA score groups in pan-cancers
3.5 Identification of metabolism-related genes molecular subtypes of AMLWe next attempted to clarify the potential molecular subtypes of AML based on these 17 overlap MRGs. CDF, or cumulative distribution function, was the method that was used to get an agreement on the best number of clusterings. Cluster number k = 3, as indicated by the area under the CDF curve in different cluster numbers, was shown to clearly classify samples into three different molecular subtype groups (Fig. 5A and B). The heatmap in Fig. 5C presented that the 150 AML tumour samples were divided into these 3 molecular subtypes including clustering 1 (C1, 40 AML samples), clustering 2 (C2, 65 AML samples), and clustering 3 (C3, 45 AML samples). Then, the relative expression of the 17 overlap MRGs in the three molecular subtypes of AML was displayed using a heatmap (Fig. 5D).
Fig. 5
Identifcation of three AML molecular subtypes based on 17 overlap MRGs. A CDF from a consensus clustering sample with k between 2 and 6 subtypes. B Difference between the area under the k = 2 and k = 6 CDF curves. C Heatmap of sample clustering under k = 3. D the heatmap of 17 overlap MRGs in three AML molecular subtypes (C1: clustering 1; C2: clustering 2; C3: clustering 3)
3.6 Ferroptosis, cuproptosis and m6A related genes’ expression in the three molecular subtypes of AMLEmerging studies had revealed that ferroptosis- and m6A-related genes, particularly the newly discovered cuproptosis-related genes, were critical regulators in cancer development and progression. Therefore, we next sought to investigate the relative expressions of the related genes involved in ferroptosis, cuproptosis and m6A processes in the three molecular subtypes of AML. It was found that the expressions of most ferroptosis-related genes was significantly different in the three molecular subtypes of AML (Fig. 6A). In addition, all the 9 cuproptosis-related genes had obvious difference in the three AML molecular subtypes (Fig. 6B). The m6A-related genes’ expressions in the three AML molecular subtypes were also explored, and similar results with the ferroptosis-related genes were also observed that most m6A-related genes’ expressions had markedly difference in the three AML molecular subtypes (Fig. 6C).
Fig. 6
The expression of ferroptosis, cuproptosis and m6A related genes in three AML molecular subtypes. A Ferroptosis-related genes expression in three AML molecular subtypes. B Cuproptosis-related genes. C The m6A-related genes
3.7 The immune analysis in the three AML molecular subtypesWe next sought to perform the immune analysis in three AML molecular subtypes using the CIBERSORT algorithm. According to the data, we found that the immune scores of several immune cells including Monocyte, Macrophage M2, Eosinophil, T cell CD4 + memory resting, Mast cell activated and B cell plasma were remarkably different in the three AML molecular subtypes (Fig. 7A). In addition to this, we analyzed the proportion of immune cells present in each of the three molecular subtypes of AML (Fig. 7B). Besides, the relative expression of immune checkpoints in the three AML molecular subtypes were evaluated and the data suggested that nearly all the immune checkpoints including LAG3, PDCD1, PDCD1LG2, CD274, CTLA4, HAVCR2 and SIGLEC15, had remarkable difference in the three AML molecular subtypes (Fig. 8A). Then, we evaluated the potential ICB response with TIDE algorithm, our group observed that the TIDE scores were significantly higher in group 3 of AML molecular subtypes when compared with group 1 and group 2, which indicated that group 3 of AML molecular subtypes were more sensitive to ICB therapy (Fig. 8B). Additionally, the immune interacting networks of each three AML molecular subtype-groups and the 17 overlap MRGs were also separately constructed based on EPIC algorithm (Fig. 8C–E).
Fig. 7
The immune scores and distribution of immune cells in three AML molecular subtypes. A The assays of the immune scores of diverse immune cells in three AML molecular subtypes. B The analysis of the distribution of immune cells in three AML molecular subtypes
Fig. 8
The relative expression of immune checkpoints, ICB response and the immune interacting networks construction. A The expressions of immune checkpoints in the three AML molecular subtypes. B The potential ICB response in the three AML molecular subtypes. C–E The immune interacting networks of each three AML molecular subtype-groups and the 17 overlap MRGs were also separately constructed based on EPIC algorithm. G1: Group 1; G2: Group 2; G3: Group 3
3.8 Comparison of the gene and function enrichment differences in each AML molecular subtype-groupsConsidering our above data indicated that there were obvious difference between group 3 (G3) and group 1 (G1) or group 2 (G2) of AML molecular subtype, we thus next attempted to investigate gene and function enrichment differences between G3 and G1 or G2. The DEGs of G1 and G3 were firstly analyzed, and 487 up-regulated genes and 50 down-regulated genes in G3 AML samples (compared with G1) were identified, and the volcano plot and heatmap were presented in Fig. 9A and B, respectively. Then, these DEGs were applied for analyzing the functional enrichment assays. The KEGG analysis indicated that the up-regulated genes were relevant with Staphylococcus aureus infection, Viral myocarditis, Type I diabetes mellitus, Tuberculosis, Toxoplasmosis and Th1 and Th2 cell differentiation, while the down-regulated genes were correlated with Renal cell carcinoma, Renin-angiotensin system, Thiamine metabolism and Thyroid cancer (Fig. 9C and D). Afterwards, the GO analysis demonstrated that the up-regulated genes were related with response to molecule of bacterial origin, regulation of mononuclear cell proliferation and regulation of lymphocyte proliferation, while the down-regulated genes were correlated with response to ketone, response to lipopolysaccharide, response to molecule of bacterial origin, segment specification and skeletal system morphogenesis (Fig. 9E and F). Afterwards, DEGs of these two groups were firstly identified, and they contained 523 up-regulated genes and 194 down-regulated genes. The comparison between G3 and G2 molecular subtypes was carried out, and both groups' DEGs were examined. The corresponding volcano map and heatmap were respectively displayed in Supplementary Figure S1A and B. The up- and down-regulated genes’ KEGG analysis were respectively presented in Supplementary Figure S1C and D, and it demonstrated that the DEGs were correlated with Systemic lupus erythematosus, Tuberculosis, Th17 cell differentiation, Type I diabetes mellitus, Viral myocarditis, Proteoglycans in cancer, Rap1 signaling pathway, Ras signaling pathway, Renin-angiotensin system and Transcriptional misregulation in cancer. In addition, the GO analysis revealed that the DEGs were relevant with regulation of T cell activation, regulation of cell–cell adhesion, response to interferon-gamma, synapse organization, xenobiotic metabolic process Supplementary Figure S1E and F).
Fig. 9
Comparison of the gene and function enrichment differences in G1 and G3 of AML molecular subtypes. A Volcano map. B Heatmap. C and D KEGG analysis. E and F GO analysis. G1: Group 1; G3: Group 3
3.9 A prognostic model for AML was constructed based on the 17 overlap MRGsIn order to develop a risk score model for the purpose of predicting overall survival in patients with AML, the LASSO Cox regression model was applied to generate a prognostic classifier using the 17 overlap MRGs. This was done in order to fulfill the aforementioned goal. Under LASSO Cox regression analysis (Supplementary Figure S2A and B), a nine-gene signature was constructed, and the risk score formula was: Riskscore = (0.3644)*GPX4 + (− 0.2696)*ITPR2 + (− 0.0588)*SLC24A3 + (− 0.0845)*MPO + (0.1371)*ATIC + (0.0703)*OAS2 + (− 0.0367)*SLC22A16 + (− 0.0236)*STAR + (0.0768)*GALM. The samples of AML were then classified into high-risk and low-risk categories based on predetermined threshold values for risk scores. There will be more fatalities and cases of disease if the risk score is high(Supplementary Figure S2C). In addition, Patients with AML who had a high risk score had a shorter overall survival (Supplementary Figure S2D). Then, the model reliability was verified via the ROC curves analysis, and the AUC values of 1-, 3- and 5 year OS were 0.8, 0.802 and 0.81, respectively (Supplementary Figure S2E). Besides, an another method called Multivariate cox regression analysis was also utilized for obtain the prognostic model for AML based on the 17 overlap MRGs. Multivariate cox regression analysis did not reduce the gene number. Therefore, the prognostic model included 17 genes and the risk score formula was: Riskscore = (0.073)*AHCY + (0.578)*GPX4 + (− 0.0181)*MGST1 + (− 0.0374)*PI4K2A + (0.1468)*ATP1B1 + (− 0.4371)*ITPR2 + (− 0.1177)*KCNQ5 + (− 0.1157)*SLC24A3 + (− 0.0819)*MPO + (− 0.0805)*TAP1 + (0.3747)*ATIC + (− 0.1247)*MICAL1 + (0.1131)*OAS2 + (− 0.0776)*SLC22A16 + (0.0038)*SLC25A29 + (− 0.0859)*STAR + (0.2106)*GALM. After that, the training cohort was also divided into high- and low-risk groups, and the analysis of the data revealed that the high-risk group had a larger frequency of poor survival outcomes compared to the low-risk group. Additionally, a heatmap of 17 genes involved in AML was created (Supplementary Figure S2F). According to the findings of the analysis of overall survival, individuals with high risk AML had a lower overall survival time (Supplementary Figure S2G). Besides, the AUC values of 1-, 3- and 5 year OS were 0.815, 0.803 and 0.791, respectively (Supplementary Figure S2H).
留言 (0)