Cell cultures
Pheochromocytoma PC12 cell cultures, purchased from IRCCS San Martino Institute (Genova, Italy), were kept in a wet atmosphere with 5% CO2 at 37 °C and they were grown in RPMI 1640 medium (Sigma-Aldrich, St. Louis, MO, USA), supplemented with horse serum (HS, Sigma-Aldrich), fetal bovine serum (FBS, Sigma-Aldrich), and antibiotics (streptomycin and penicillin). Experiments were carried out when PC12 cells were in the log-phase of growth, corresponding to 70% confluence (Qiao et al. 2001; Song et al. 1998). Before experimental treatments, cells were seeded according to the different experimental procedures and incubated for 24 h at 37 °C in 5% CO2. In detail, for light microscopy staining procedures, 1 × 10⁴ or 5 × 10⁴ PC12 cells were seeded in 24-well plates in a final volume of 1 mL/well. For TEM, 1 × 10⁶ cells were seeded in culture dishes in a final volume of 5 mL.
Cell treatments
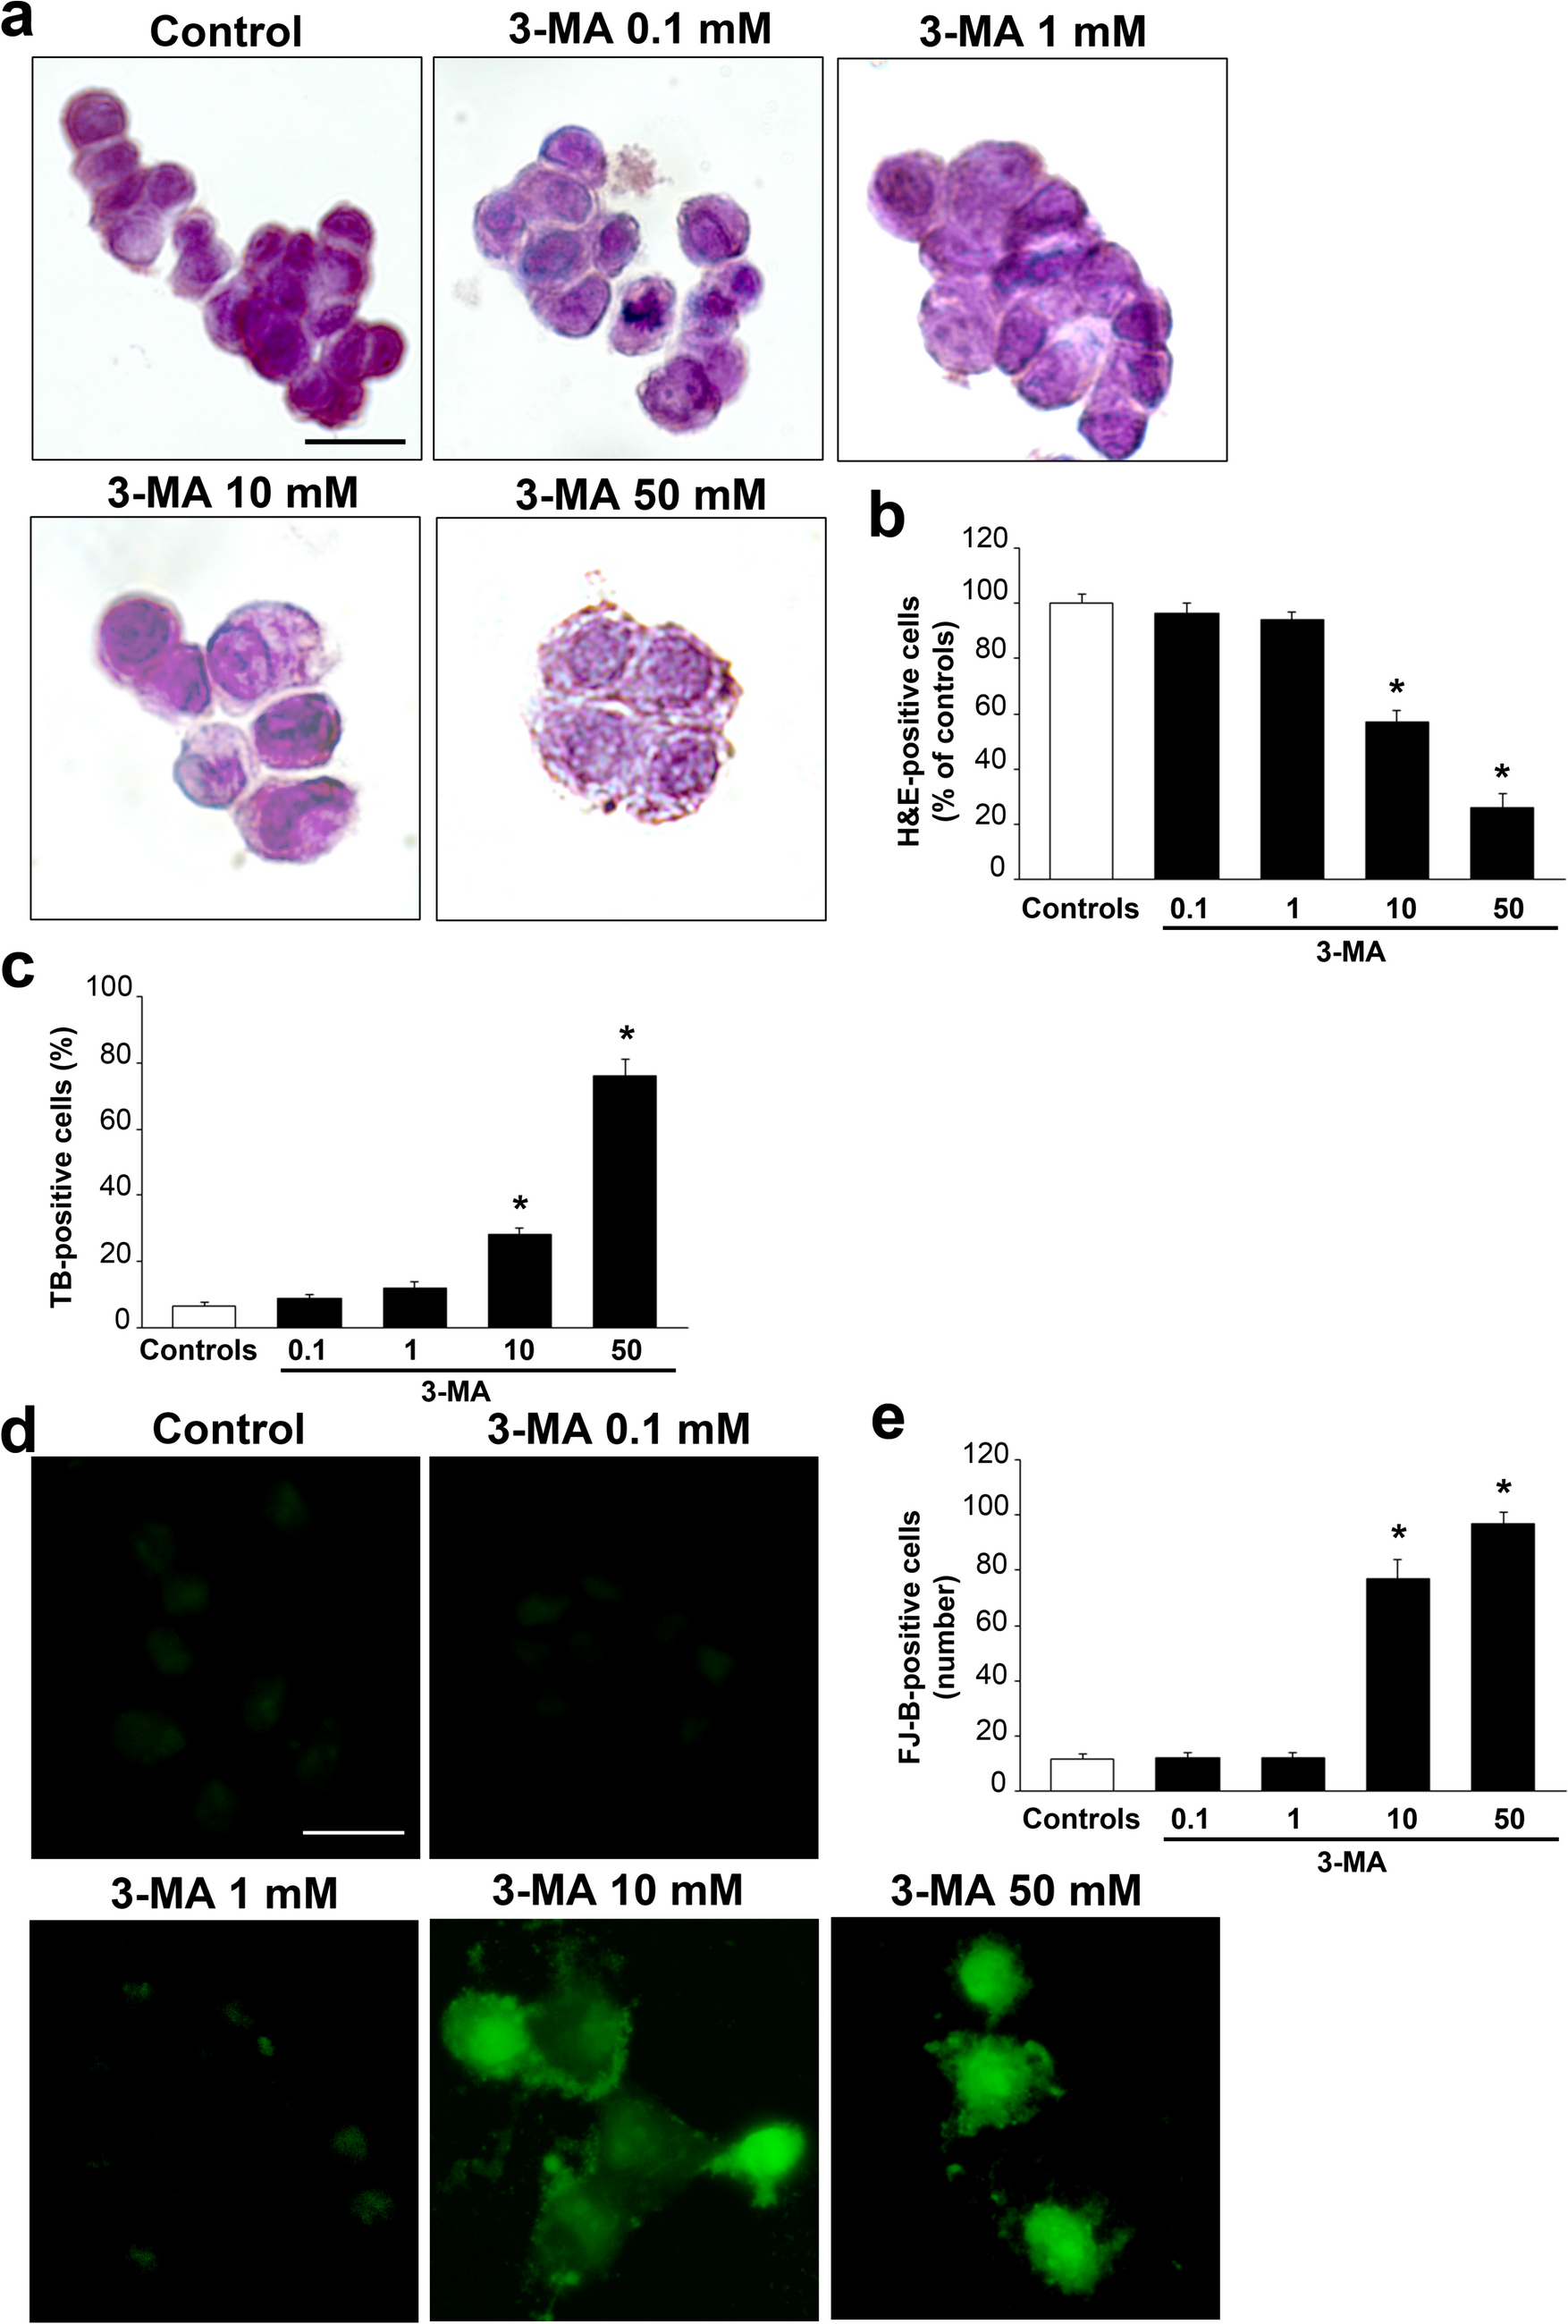
When cells reached the log-phase of growth, they were treated with the autophagy inhibitor 3-methyladenine (3-MA), which was dissolved in the culture medium at four concentrations (0.1 mM; 1 mM; 10 mM; 50 mM) to be used for histochemistry (H&E and TB) and histofluorescence (FluoroJade-B, FJ-B). Based on the effects induced by specific doses of 3-MA on cell integrity, a gold-standard dose of 3-MA of 10 mM for 72 h was selected to analyze the cells at immunohistochemistry and immunoelectron microscopy.
In experiments aimed at assessing the inhibition of autophagy, the autophagy inhibitor bafilomycin A1 (100 nM, Sigma-Aldrich) was added to the culture medium 3 h before the end of the treatments with 3-MA.
Histochemistry and immunohistochemistryTrypan blue (TB)
To assess the percentage of dying cells, following various doses of 3MA, TB staining was carried out. Twenty-four hour before treatment, 1 × 10⁴ PC12 cells were placed within 24-well plates in 1 mL culture medium without any fixing procedure. After treatment with various doses of 3-MA, cells were collected and centrifuged at 800×g for 5 min, cell pellets were suspended in 0.5 mL of culture medium, and 25 µL of cell suspension were incubated, for 5 min in a solution of 1% TB (62.5 µL) and PBS (37.5 µL). Ten µL aliquot of this solution were analyzed using a Bürker chamber under Olympus CKX 41 inverted microscope (Olympus Corporation, Tokyo, Japan). Viable and non-viable cells were counted, and cell death was expressed as the mean percentage ± SEM of TB-positive cells out of total cells. For each treatment group data are expressed as the mean of three chambers counts, which were replicated for three independent experiments and counted by two blind investigators.
Further histochemical techniques (H&E and FJ-B) and immunohistochemistry
All these procedures are described apart since, differing from TB, they were carried out on paraformaldehyde fixed cells. In detail, 5 × 10⁴ PC12 cells were seeded on poly-lysine coverslips and placed in 24-well plates (final volume: 1 mL/well). These cells were fixed with 4% paraformaldehyde in PBS for 15 min.
H&E
Post-fixed cells were immersed within hematoxylin (Sigma-Aldrich) solution for 15 min. After water washing, cells were immersed a few seconds within eosin (Sigma-Aldrich) solution. Then, cells were dehydrated through increasing alcohol solutions, clarified by xylene and finally mounted with a coverslip using DPX (Sigma-Aldrich) and observed using a Nikon Eclipse Ni light microscope (Nikon, Tokyo, Japan), equipped with a digital camera connected to the NIS Elements software for image analysis (Nikon, Tokyo, Japan).
H&E-positive cell counts were performed on one slide per experimental group under 20 × magnification, where 3 different microscopic fields were selected containing distinct, not overlapped cells. Cell counts were carried out by two independent investigators and values expressed as mean percentage ± SEM percentage (assuming controls as 100%). Data refer to three independent experiments.
FJ-B histofluorescence
Cells were fixed in a paraformaldehyde (4%) solution for 15 min, washed in PBS and incubated with 0.06% potassium permanganate (10 min, at 21 °C). After washing in distilled water, cells were incubated for 20 min in a FJ-B solution prepared by dissolving 0.01% FJ-B (Merck Millipore, Billerica, MA, USA) in acetic acid. Cells were incubated in 4 × 10⁻⁴% of FJ-B solution for 20 min and then cover-slipped with a mounting medium. FJ-B-positive cells were analyzed using a Nikon Eclipse Ni light microscope (Nikon, Tokyo, Japan), equipped with a florescence lamp and a digital camera connected to the NIS Elements software for image analysis (Nikon, Tokyo, Japan).
Cell were counted through the fluorescence microscope at 20 × magnification. The number of FJ-B-fluorescent cells was expressed as the mean number ± SEM for each experimental group. Data refer to three independent experiments counted by two independent investigators.
Adobe Photoshop CS4 Extended program (version 11.0, Adobe Systems Inc., San Jose, CA, USA) was used for artwork.
For immunohistochemistry, cells administered 3-MA (10 mM) or vehicle were permeabilized with 0.1% TritonX-100 (Sigma-Aldrich), This was followed by 1 h incubation in a blocking solution (to prevent non-specific binding of primary antibodies). Then, PC12 cells were incubated at 4 °C overnight within a solution containing primary antibodies anti-alpha-syn (Abcam, Cambridge, UK), anti-p62 (Life Technologies, Carlsabad, CA, USA), anti-Poly-ub (Abcam); anti-P20S (Abcam); anti-LC3-II (Abcam). All primary antibodies were diluted 1:100 in a PBS solution containing 1% normal goat serum. Then, cells were immersed for 1 h in the solution containing secondary fluorescent antibodies Alexa 488 (Life Technologies) or Alexa 594 (Life Technologies) diluted 1:200. These cells were transferred on coverslip and finally mounted with the medium Fluoroshield (Sigma-Aldrich). Cell nuclei were stained with the fluorescent dye DAPI (Sigma-Aldrich). Slides were observed under Nikon Eclipse Ni light microscope (Nikon) equipped with a fluorescent lamp and a digital camera connected to the NIS Elements Software for image analysis (Nikon). Detailed information concerning all primary and secondary antibodies used in these experiments, including catalogue number and RRID code, are reported in the Supplementary Information (Supplementary Table S1).
Merging areas of immunofluorescence were measured by using Image J software (NIH, Version 1.8.0_172, Bethesda, MD, USA) and they were expressed as mean percentage ± SEM where controls were considered as 100.
Densitometry of the LC3-II- and the p62-fluorescence was measured within the very same cell by using Image J software (NIH, Version 1.8.0_172, Bethesda, MD, USA). Data were expressed as the mean percentage ± SEM percentage of 60 cells per group, assuming 100% the intensity measured in controls.
Comparisons between groups were carried out by ANOVA with Sheffe’s post-hoc analysis; the null hypothesis H0 was rejected for p < 0.05.
Transmission electron microscopy (TEM)
For TEM analysis PC12 were centrifuged at 1000×g for 5 min, they were rinsed in PBS, and fixed within paraformaldehyde 2.0%, and glutaraldehyde 0.1%, which were both diluted in a 0.1 M PBS solution, pH 7.4 for 90 min at 4 °C. After repeated washing in PBS (0.1 M), samples were further fixed in 1% osmium tetroxide (OsO4) for 1 h at 4 °C. Then, samples were dehydrated in gradient solutions of ethanol (30%, 50%, 70%, 90% and 95%, 5 min each, and 100%, 60 min). Finally, samples were embedded in epoxy-resin. The concentration of the fixing solutions, and the procedure to embed the samples within epoxy-resin, were validated in previous studies, where both plain and immuno-gold-based ultrastructural morphometry were carried out (Fornai et al. 2001a, b; Lazzeri et al. 2007). In fact, combining these aldehydes, OsO4, and epoxy-resin allows a minimal epitope covering (which is useful for stoichiometry counts with immuno-gold), while preserving sub-cellular architecture (which allows to define the specific organelles where counts were carried out in situ).
Ultra-thin (90 nm thick) slices were collected on nickel grids and they were used either for plain, or post-embedding immuno-gold electron microscopy.
Plain electron microscopy
When plain electron microscopy was carried out, ultra-thin slices on nickel grids were stained with uranyl acetate (to enhance the contrast of nucleic acids and amino acids) and lead citrate (to enhance the staining of heavy metals). These samples used for plain electron microscopy were directly observed at Jeol JEM SX100 electron-microscope (Jeol, Tokyo, Japan).
Immuno-electron microscopy
When stoichiometry antigen detection was needed, ultra-thin (90 nm thick) slices placed on nickel grids and they were layered on droplets of aqueous sodium metaperiodate (NaIO4), for 30 min, at 22 °C. This specific step was aimed at removing a potential excess of OsO4, which may cover antigen epitopes. In order to remove residual NaIO4, reiterated washing of the grid in PBS (three times, 5 min each) was carried out. At this point, grids were further layered on droplets containing a so-called blocking solution to prevent non-specific immunostaining (the blocking solution consists of 10% goat serum, which enables to access tissue through 0.2% saponin acting as a surfactant) components of the blocking solution were dissolved in PBS 1 M and persisted in contact with the grid for 20 min, at 22 °C. Other drops were prepared containing the primary antibody on which grids were further layered. This step occurred with specific conditions of humidity, at a temperature of 4 °C overnight. This drop-mediated incubation may involve single or double primary antibody(ies). In the present experiment the following drops were used: alpha-syn 1:100; p62, 1:100; Poly-ub 1:100, P20S 1:100. All primary antibodies reported below are the same used for the immunohistochemistry. The drops contained the antibody dissolved in ice-cold PBS solution also containing 1% goat serum and 0.2% saponin to improve antigen binding. The day after, grids were washed in cold PBS (three times, 5 min each). Thus, grids where ultrathin sections were layered, were further layered on drops containing gold-conjugated secondary antibodies. The size of gold particles varies specifically featuring either 10 nm or 20 nm diameter. All secondary, gold- conjugated antibodies were provided by BB International (Cardiff, UK). In the drop, the concentration of the secondary antibody was 1:100 within a blocking buffer (1% goat serum and 0.2% saponin) in PBS. Drops were exposed for 1 h, at 22 °C. At this point, after previous rinsing grids prepared for immuno-gold detection were layered on drops of 1% glutaraldehyde, for 3 min before being washed in distilled water to be exposed to the classic processing for plain electron microscopy, which consists of staining with uranyl acetate and lead citrate, as reported above. Ultra-thin sections were finally observed at TEM (JEOL JEM SX100). Control ultra-thin sections were incubated with secondary antibodies only. The number of immuno-gold particles relates stoichiometry to the number of molecules of each specific antigen (alpha-syn, p62, Poly-ub, P20S).
Detailed information concerning all primary and secondary antibodies used in these experiments, including catalogue number and RRID code, are reported in the Supplementary Information (Supplementary Table 1).
Extended statistical analysis (procedures validation, sampling method, bias avoidance, description within each group and inference between groups)
The statistical relevance of combining various histochemical procedures (TB; H&E; FJ-B) to detect gross effects induced by various doses of the autophagy inhibitor 3-MA on cell death and cell pathology includes a number of issues. In fact, each method provides some specific information. For instance, the amount of severe cell damage assessed by H&E is based on actual lack of cell structures (uniquely visible among light microscopy procedures) and the presence of remarkable alterations. These concern abnormal cell size and shape, cytosol staining and nuclear staining frankly differing from standard control cells even during spontaneous degeneration. In this case the authentic counts rule out some cell degeneration, which also occur in control conditions. In keeping with H&E staining, the amount of cell alterations required to call a cell out of the viable range is severe and needs to be clearly evident at light microscopy, which may conversely reduce the count of irreversible cell damage when this is finely detected at sub-cellular level. The use of TB allows to establish the loss of membrane integrity as an index of cell damage. In fact, this method provides data based on the staining with a dye (TB) which penetrates the cell based on the loss of membrane permeability and/or integrity. In the case of FJ-B, we still lack an in-depth knowledge of which and how many markers are responsible for FJ-B-induced fluorescence. In this context, non-pathological staining may be induced by some molecules, which target FJ-B providing some false positive results. This potential bias may lead to non-degeneration dependent FJ-B positivity. This may explain why cell damage detected by FJ-B-staining is the highest compared with all other methods. The relevance of autophagy for the expression of markers stained by FJ-B is presently unknown, which also leaves other question marks on data interpretation. Nonetheless, the dose–response curve for 3-MA provides an evidence, which is quite similar for all histochemical measurements, this contributes to the validation of cell damage independently by the kind of method being considered. The integration of three different approaches and the general consistency, concerning the detrimental effects of various doses of 3-MA, is statistically relevant to infer on the dose–response curve for 3-MA-induced degeneration. In particular, FJ-B was never used so far to mark degeneration following autophagy inhibition, the present data inherently validates FJ-B as a marker of autophagy-dependent neurodegeneration. The histochemical data were similarly treated in descriptive statistics. In detail, for TB histochemistry viable and non-viable cells were counted under reversed microscopy, and cell death was expressed as the mean percentage ± SEM of TB-positive cells out of total cells in the same chamber. Data from each group are reported as the mean of three separate counts in different though equivalent chambers. These three independent experiments were counted by two blind investigators. For H&E, viable H&E-stained cells in each experimental group were counted and they were expressed as mean percentage ± SEM of control (corresponding to 100%). Data refer to three independent experiments. When considering viable H&E-stained cells an important issue needs to be clarified since dramatic alterations of cell morphology such as faint cells, highly vacuolated cells, and disrupted cell membranes rule out the inclusions in the count of viable cells.
When comparing the effects of various doses of 3-MA and controls the inference was based on ANOVA with Sheffè’s post-hoc analysis considering unlikely the null hypothesis H0 when p < 0.05.
For the semi-quantitative assessment of the autophagy flux, the intensity of the LC3-II- and the p62-fluorescent signal was measured within the very same cell by using Image J software (NIH, Version 1.8.0_172, Bethesda, MD, USA) and was reported as the mean percentage ± SEM percentage of 60 cells per group, assuming 100% the intensity measured in controls. Comparison between groups were carried out by ANOVA with Sheffe’s post-hoc analysis; the null hypothesis H0 was rejected for p < 0.05. For immunohistochemistry, descriptive analysis for each immunostaining was based on the surface of the immunopositive area in each cell group. This area was reported as a percentage of the area measured in control (100%) to provide a sudden comparison for all antigens. Areas of immunofluorescence were defined by using Image J software (NIH, Version 1.8.0_172, Bethesda, MD, USA). Comparisons between groups were carried out by ANOVA with Sheffe’s post-hoc analysis; the null hypothesis H0 was rejected for p < 0.05.
The real size of the area was also counted and it was expressed in µm2 as reported in Table 1. These data were reported as the mean ± SEM of 90 cells per group (30 cells for each experiment carried out in triplicate). The inference concerning different percentage and different absolute numerical values between groups was carried out by using one way ANOVA with Sheffe’s post-hoc analysis. Adobe Photoshop CS4 Extended program (version 11.0, Adobe Systems Inc., San Jose, CA, USA) was used to create the artwork.
Table 1 Immunofluorescence areas for each antigen observed at light microscopy were measured in µm2 in control cells and cells administered 3-MA (10 mM)At any rate, the semi-quantitative non-linear distribution of immunostained areas and antigen amounts remain a limit inherent to immunohistochemistry, which moved the present study towards the achievement of a stronger statistical power provided by sub-cellular stoichiometry. Thus, during sub-cellular analysis at TEM, areas were sampled based on the accumulation of specific antigens such as alpha-syn, p62 and Poly-ub within each antigen-rich domain averaging 2 µm2 cell area. Thus, these areas, where clusters of immunogold were mostly represented and were selected for in situ stoichiometry. In this way, the amount of each antigen (alpha-syn, p62, Poly-ub, P20S) represents the authentic number of protein molecules deriving from a 1:1 ratio between a protein and an immunogold particle, which allows in situ quantification according to specific antigen stoichiometry. This approach allows a quantitative measurement of specific protein amount within the cell densest spots (2 µm2) providing reliable values counted in situ (Bergensen et al. 2008).
Counts of immunogold particles (either 10 nm and/or 20 nm) were carried out at TEM by using a magnification (8000 ×), which allows to recognize concomitantly immuno-gold particles along with cell organelles for in situ stoichiometry under the same magnification. Descriptive values for each antigen were expressed as the mean ± SEM within selected areas from n = 30 cells per group (3MA-treated cells and controls). The 2 µm2 area was also quantified concerning non-protein tubulo-vesicular structure, which is intended as the areas covered by membranous organelles and vesicular structures (tubulo-vesicular membranes). Comparisons were carried out by ANOVA with Sheffe’s post-hoc analysis.
Comparison between alpha-syn, p62, Poly-ub and P20S immuno-gold were carried out by using ANOVA with Sheffe’s post-hoc analysis; the null hypothesis H0 was rejected for p < 0.05.


留言 (0)