Reagents and chemicals
L-Tryptophan (T8941, purity > 99%) and lipopolysaccharide (LPS, Escherichia coli 055:B5) were acquired from Sigma‒Aldrich (St. Louis, MO, USA). The full-length coding sequence of ACE2 (NM_001130513.1, 2418 bp) was cloned and inserted into the pEGFP-C3 expression vector. HRP-labeled goat anti-rabbit IgG (H + L) was purchased from Beyotime (Shanghai, China). The following antibodies were used in this work: anti-β-actin, anti-ACE2, anti-AhR, anti-mTOR, anti-p-mTOR (Wanleibio, Shenyang, China), anti-B0AT1, anti-4EBP1, anti-p-4EBP1, anti-S6K1, anti-p-S6K1 (Abcam, Massachusetts, USA), anti-ZO-1 and anti-Occludin (Proteintech, Chicago, USA). The antibodies used for western blotting are listed in Table S4.
Cell culture and treatment
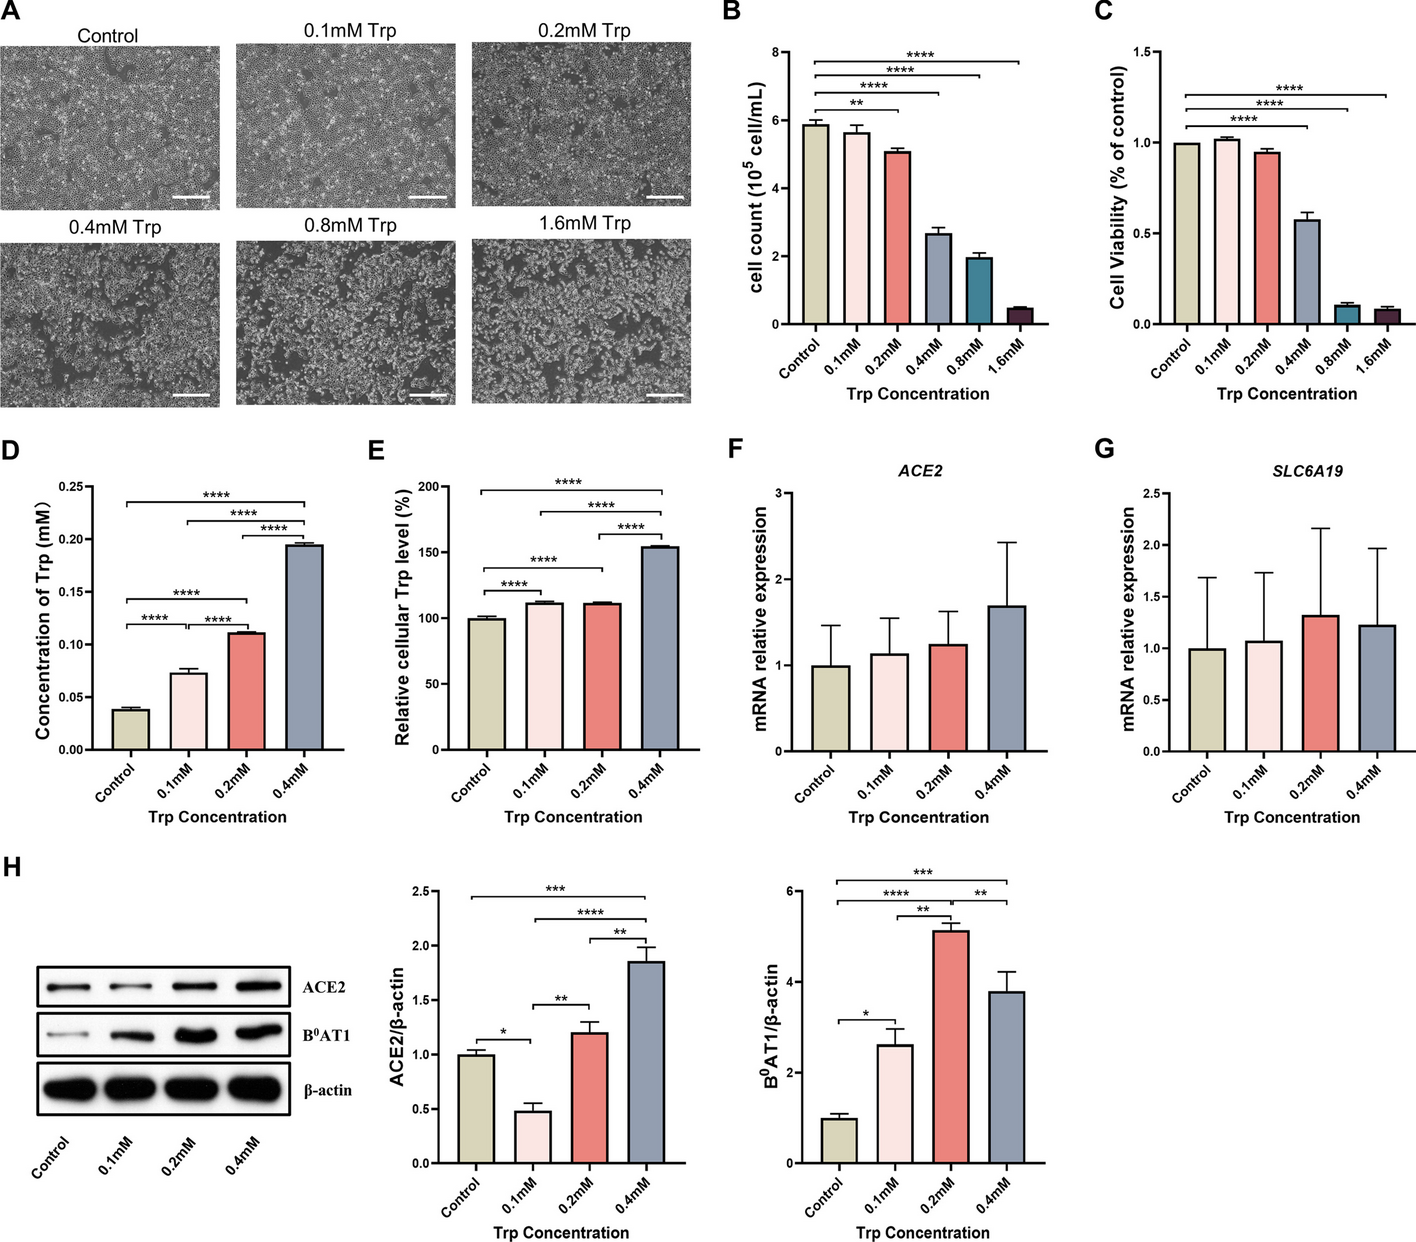
IPEC-J2 cells were obtained from the Key Laboratory of Food College, Northeast Agricultural University. The cells were cultured in Dulbecco’s modified Eagle’s medium [DMEM/Ham’s F12 (1:1)] supplemented with 10% FBS and 1% penicillin–streptomycin at 37 ℃ under 5% CO2 in a humidified incubator. After reaching 70–80% confluence in cell culture plates, the cells were starved in Trp-free DMEM/F12 media for 4 h and then supplied with different treatment solutions.
Cell viability assay
At a density of 5 × 10³ cells per well, IPEC-J2 cells were grown in 96-well plates. The cells were treated with various dosages of Trp for 48 h before being subjected to the Cell Counting Kit-8 (CCK8, Dojindo, Japan) assay. It was expected that all of the cells in the control group would survive, and its absorbance at 450 nm was used as the reference value for the other groups’ absorbance at 450 nm.
RNA isolation and quantitative RT-qPCR
Total RNA from homogenized intestinal tissues or cell lines was isolated with RNAiso Plus reagent (9109, Takara Bio, Inc., Otsu-Shiga, Japan). Then, RNA was reverse transcribed and amplified using the PrimeScript RT Master Mix Kit according to the manufacturer’s instructions. Quantitative real-time PCR was performed using TB Green Premix Ex Taq (Takara Code: RR420A, Dalian, Liaoning, China). The primers used in this study are listed in Table S5. The 2−ΔΔCt method was used to calculate the relative mRNA expression levels.
Western blot analysis
RIPA buffer mix containing 1% PMSF was used to extract the total protein from the cells or intestinal tissues (0.1 g), and the protein lysates were then denatured at 95 ℃ for 10 min. After the concentration was evaluated using a BCA protein assay kit (Solarbio, Beijing, China), equal amounts of protein from each sample were separated on 8–12% SDS‒PAGE gels and then transferred onto polyvinylidene fluoride membranes. After blocking with 5% nonfat milk for 2 h, the membranes were immunoblotted with the designated primary antibodies overnight at 4 ℃. At room temperature, the membranes were incubated with secondary antibodies conjugated to HRP for 1 h before signal detection with enhanced chemiluminescence (ECL) substrate (P0018AS, Beyotime). ImageJ software was used to quantify the band intensity, and actin was then utilized to normalize the relative intensity of the target proteins.
Immunofluorescence
IPEC-J2 cells were cultured on coverslips and treated with Trp and LPS for 24 h. Afterward, the coverslips were rinsed with PBS and fixed in 4% paraformaldehyde (Solarbio, Beijing, China) for 10 min at room temperature. After a second rinse with PBS, the coverslips were submerged in 0.3% Triton X-100 (Solarbio, Beijing, China) for 5 min before they were rinsed with PBS 3 times and then blocked in 5% BSA for 1 h. Afterward, the cells were incubated with the primary antibody diluted in 5% BSA, as mentioned above, overnight at 4 ℃. The coverslips were washed with PBST before incubation at room temperature with a secondary antibody diluted in PBST for 1 h and washed again with PBST as described above. The DNA in the nucleus was stained with DAPI (Beyotime Biotechnology, Shanghai, China). The fluorescence intensities were detected by a Nikon Eclipse Ti2 fluorescence microscope (Nikon, Japan).
B0AT1 blocking
IPEC-J2 cells were treated with the B0AT1 blocker benztropine at different concentrations (0, 20 and 30 μM) for different times (15, 30 and 45 min) to establish a B0AT1 blocking model and to detect the expression of related proteins.
pEGFP-C3/ACE2 recombinant plasmid transfection and overexpression
The recombinant plasmid pEGFP-C3/ACE2 that we constructed was transiently transfected into IPEC-J2 cells using Lipofectamine 3000 (Thermo Fisher Scientific, USA) at a dose of 0.5 μg/well (in six-well plates) following the manufacturer’s instructions. An equal amount of the empty vector pEGFP-C3 was used as a negative control. At 24 h posttransfection, the mRNA and protein expression levels of ACE2 and related genes were evaluated by RT‒qPCR and western blotting following ACE2 protein overexpression.
ACE2 siRNA design and transfection
In this study, a double-strand RNA molecule containing 21 nucleotides was synthesized artificially based on the mRNA sequence of ACE2 with 2 bases of dTdT protruding from the 3′ end of both the sense and antisense strand nucleotide sequences. This was the first effective disruption of porcine ACE2 achieved. The porcine ACE2 RNA interference fragment siRNA was designed by Guangzhou RiboBio Co., Ltd., and three pairs were designed, in which the corresponding negative control was provided by the company. The sequences of the siRNAs are shown in Table S6. The cells were seeded at 2.0 × 10⁵/well in 6-well plates overnight, the cell culture medium was removed, the cells were washed twice with 5 mL of prewarmed PBS at 37 ℃, and a fresh complete medium was added. Then, the ACE2 RNA interference sequence was transfected into IPEC-J2 cells according to the instructions for transfection with Lipofectamine RNAiMAX (Invitrogen).
Ethics approval
The procedure of the present study was approved by the Animal Ethics Committee of South China Agricultural University (SCAU-10564). All protocols were carried out according to the guidelines of Guangdong Province on the Review of Welfare and Ethics of Laboratory Animals.
Animals and experimental design
The animal study was carried out at the Hunan New Wellful Co., Ltd., Yongan Branch Office (Liuyang, China). Forty 28-day-old male piglets (Yorkshire × Landrace, initial body weight 7.79 ± 0.75 kg) were randomly divided into five groups with eight replicate pens for each treatment group and one pig for each pen. Piglets were individually caged in 1.80 × 1.10 m pens and allowed ad libitum access to feed and water in an environmentally controlled house. Piglets were fed a corn and soybean meal-based diet that met the nutritional requirements (National Research Council [NRC], 2012) of piglets (NRC, 2012; Table S7). The experiment included five treatments: CON, LPS, 0.2% Trp, LPS + 0.2% Trp and LPS + 0.4% Trp. The specific process is shown in Fig. 5A.
Growth performance
Pigs were weighed on Days 0 and 29 postweaning. The feed intake was recorded on a pen basis during the experiment to calculate the average daily gain (ADG), average daily feed intake (ADFI) and feed gain ratio (F/G). The diarrhea rate was calculated using the following formula: diarrhea rate (%) = (number of pigs with diarrhea × diarrhea days)/(number of pigs × total experiment days) × 100.
Sampling and measurements
At the end of the trial, blood was collected from the jugular vein and serum samples were obtained by centrifugation at 2000 × g for 10 min at 4 ℃. Then, the pigs were anesthetized with sodium pentobarbital intravenously (50 mg/kg body weight) and bled by exsanguination. After the carcass and internal organs were weighed, liver, duodenum, jejunum and ileum samples were collected into sterilized tubes, snap-frozen in liquid nitrogen and then stored at − 80 ℃. A 3 cm section of jejunum and ileum tissues was fixed in 4% paraformaldehyde for examination of intestinal morphology.
Sample analysisSerum biochemical indicators
Total protein (TP), urea (UREA), alkaline phosphatase (ALP), alanine aminotransferase (ALT), aspartate aminotransferase (AST), globulin (GLB), albumin (ALB), glucose (Glu) and albumin/globulin (A/G) in the serum were measured using the biochemical analytical instrument TBA-120FR (Toshiba, Otawara-shi, Japan) and respective commercial assay kits (Daan Clinical Inspection Center, Guangzhou, China).
Hematoxylin and eosin staining
The intestine samples were embedded in paraffin, sectioned at a thickness of 5 μm, and preserved in 4% paraformaldehyde at 4 ℃. Hematoxylin and eosin (H&E) staining was applied to the slices, and light microscopy images were taken using a US Moticam 3000 photomicrography imaging system and quantified using a Motic Images Advanced 3.2 pathology image analysis system.
Transmission electron microscopy
Samples of the jejunum were fixed in 2.5% glutaraldehyde in the dark. The samples were washed three times with sodium phosphate buffer (0.1 M, pH 6.8) and then immersed in 1% osmium tetroxide for 1 h. All of the above steps were performed at 4 ℃. Then, the samples were rewashed three times and dehydrated in an increasing gradient of ethanol solutions for more than 15 min at each step. After staining with uranium acetate and lead citrate, the samples were examined with a transmission electron microscope (TEM, Hitachi HT7700, Japan).
Statistical analysis
For all in vivo and in vitro sample studies, n represents the number of biological replicates per group (as detailed in the Figure Legends) in accordance with the actual situation. All of the data are expressed as the mean ± SEM. Statistical significance was determined by two-tailed Student’s t test for two groups and one-way ANOVA with Tukey’s post hoc test for univariate comparisons. GraphPad Prism 8.0 software was used for statistical analysis, and statistical charts were generated. The statistical significance was set at *, P < 0.05, **, P < 0.01, and ***, P < 0.001. Figdraw (https://www.figdraw.com) was used to construct the mechanistic diagrams.


留言 (0)