
記住我


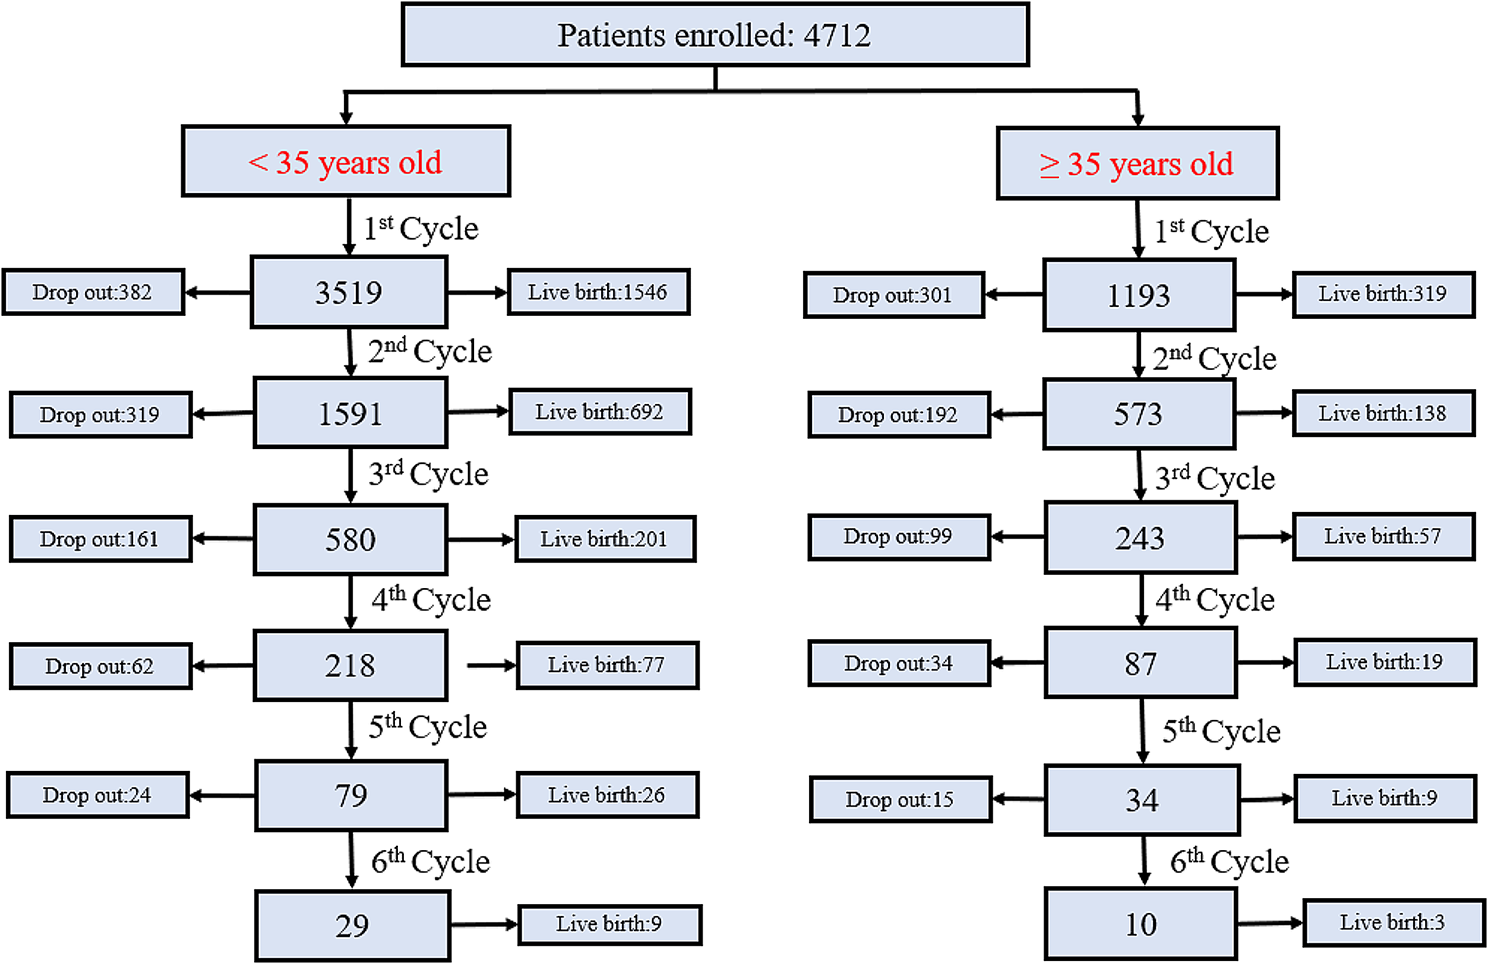


Between January 1, 2014 and June 30, 2020, we conducted a retrospective analysis of women undergoing IVF or intracytoplasmic sperm injection (ICSI) treatment at the Reproductive Medicine Center of Jiangxi Maternal and Child Health Hospital Affiliated to Nanchang Medical College. A total of 32,306 treatment cycles derived from 29,023 couples were included. All data of the subjects were retrieved from the electronic medical records of our center. The study protocol was approved by the Reproductive Medicine Ethics Committee of Jiangxi Maternal and Child Health Hospital (SZYX-202,306). The inclusion and exclusion criteria and study design are shown in Fig. 1.
Fig. 1
Flowchart of selection for the study
IVF/ICSI treatment procedureBefore commencing IVF treatment, couples underwent standard infertility assessments, including serum test and transvaginal ultrasound (TVUS). Ovarian stimulation was performed using recombinant follicle stimulating hormone and/or urinary human menopausal gonadotropins (rFSH/hMG). The main stimulation regimens included follicular phase gonadotropin-releasing hormone (GnRH) agonist protocol [24], luteal phase GnRH agonist protocol, and GnRH antagonist protocol. Follicular development was monitored by ultrasonography, and final oocyte maturation was induced by human chorionic gonadotrophin (hCG) when at least three follicles of 18 mm in diameter were observed. TVUS-guided follicular aspirations were performed 36 h after triggering.
Fertilization was carried out in vitro by either conventional IVF or ICSI depending on semen parameters. Embryos were cultured in sequential medium, with incubation conditions set at 6% CO2, 5% O2, and 37.0 °C. Recorded morphological characteristics included fragmentation, cell number and symmetry of all day 3 embryos with implantation potential.
Fresh embryo transfers were carried out under ultrasound guidance on day 3, day 5 or day 6. Supernumerary embryos were cryopreserved. The vitrification procedure was performed using the Cryo Bio System (France). Subsequent frozen-thawed transfer was performed through a natural cycle with hCG or through an artificial cycle with or without GnRH agonist pre-treatment [25]. The number of embryos transferred varied from one to two based on patient features.
Main outcome measuresThe main outcome was the CLBR of a complete IVF treatment cycle. The birth of at least one live-born baby per initiated cycle was defined as a live birth, and all the other adverse outcomes were classified as no live birth. A complete cycle included a fresh embryo transfer and associated frozen embryo transfers resulting from a single episode of ovarian stimulation.
Statistical analysisWe developed three predictive models divided by three consecutive stages of a complete cycle, namely pre-treatment, post-stimulation and post-treatment.
Pre-treatment modelFor a couple ready to embark on IVF treatment, we estimated the CLBR using the couple’s baseline characteristics and fertility check-up.
Post-stimulation modelFor a couple who finished the initiated cycle and successfully retrieved oocytes (the number of oocytes > 0), we included stimulation treatment characteristics along with the features from the pre-treatment model.
Post-treatment modelFor a couple who obtained implantable cleavage embryos after embryo culture, we assessed the CLBR based on the characteristics of post-stimulation model and cumulative Day-3 embryos live birth capacity. The cumulative Day-3 embryos live birth capacity indicates the potential for live births of all Day-3 embryos obtained from a single cycle. Specifically, we collected data about embryos morphology and outcomes of fresh single Day-3 embryo transfer from all complete cycles (n = 2594). We chose cell number, fragmentation and symmetry of Day-3 embryo as explanatory variables to develop logistic regression model of live birth probabilities. Then we imported relative data of all Day-3 embryos in every eligible complete cycle, calculated cumulative Day-3 embryos live-birth capacity of all cycles, and treated it as a new variable added to post-treatment model. The model information and calculation formula were shown in Supplemental text 1.
Continuous data were presented as the mean value ± standard deviation (SD) or median with interquartile range, and categorical data were described as the number of cases and percentages. Comparisons between the live birth and non-live birth groups were determined using Student’s t-test for continuous variables and Chi-squared test for categorical variables. To detect any possible linear or non-linear correlation between female age, AFC, number of oocytes retrieved, cumulative Day-3 embryos live birth capacity and the CLBR and to allow for a flexible interpretation of the relationships, continuous changes in these variables were assessed through restricted cubic splines (RCSs) [26]. We put 3, 4, 4, 3 cut-off points for female age, AFC, number of oocytes retrieved and Cumulative Day-3 embryos live birth capacity as the knots, respectively. Other continuous variables, including female body mass index (BMI) (< 18.5, 18.5 ~ 23.9, 24.0 ~ 27.9, ≥ 28 kg/m2), duration of infertility (< 2, 2 ~ 5, > 5 years), abortion number (0, 1, 2, > 2), number of previous ART treatments (0, 1, 2, > 2), number of previous ET failure (0, 1, 2, > 2), endometrial thickness (< 7, ≥ 7 mm), estradiol (E2) (< 1049, 1049 ~ 1795, 1796 ~ 2751, > 2751 pg/mL), progesterone (P) (< 0.47, 0.47 ~ 0.68, 0.69 ~ 0.97, > 0.97 ng/mL), and luteinizing hormone (LH) (< 0.65, 0.65 ~ 1.06, 1.07 ~ 1.96, > 1.96 mIU/mL) on trigger day were transformed into categorical variables before modeling.
We fitted multivariable logistic regression models to predict live birth through a complete cycle of IVF. Stepwise variable selection was used to remove uninformative variables in regression models. In short, starting from the full model performance, we iteratively remove one feature from the model while including last removed feature to the model, and assert whether the model has improved according to the akaike information ccriteria (AIC). The procedure is iterative and continues until there is no change in the AIC.
All eligible subjects were split by time. We used subjects in the first phase (January 2014–December 2018) for model derivation and internal validation, by randomly dividing into a training set and a test set at a ratio of 7:3. Subjects in the second phase (January 2019–June 2020) were used for temporal validation. When the sample size is very large, this approach has been shown to be methodologically more rigorous than a simple random split of the dataset [27]. The performance of the models was evaluated by means of C index and calibration. The C index, equivalent to the area under the receiver operating characteristic (ROC) curve, assesses the model’s discriminative capacity. Calibration refers to the level of agreement between the estimated and observed probabilities of a given event. Calibration was assessed by means of Hosmer-Lemeshow test. All analyses were performed with the use of the statistical software R software version 4.0.2 (http://www.R-project.org/). P-value < 0.05 was considered statistically significant for all analyses.
留言 (0)