
記住我
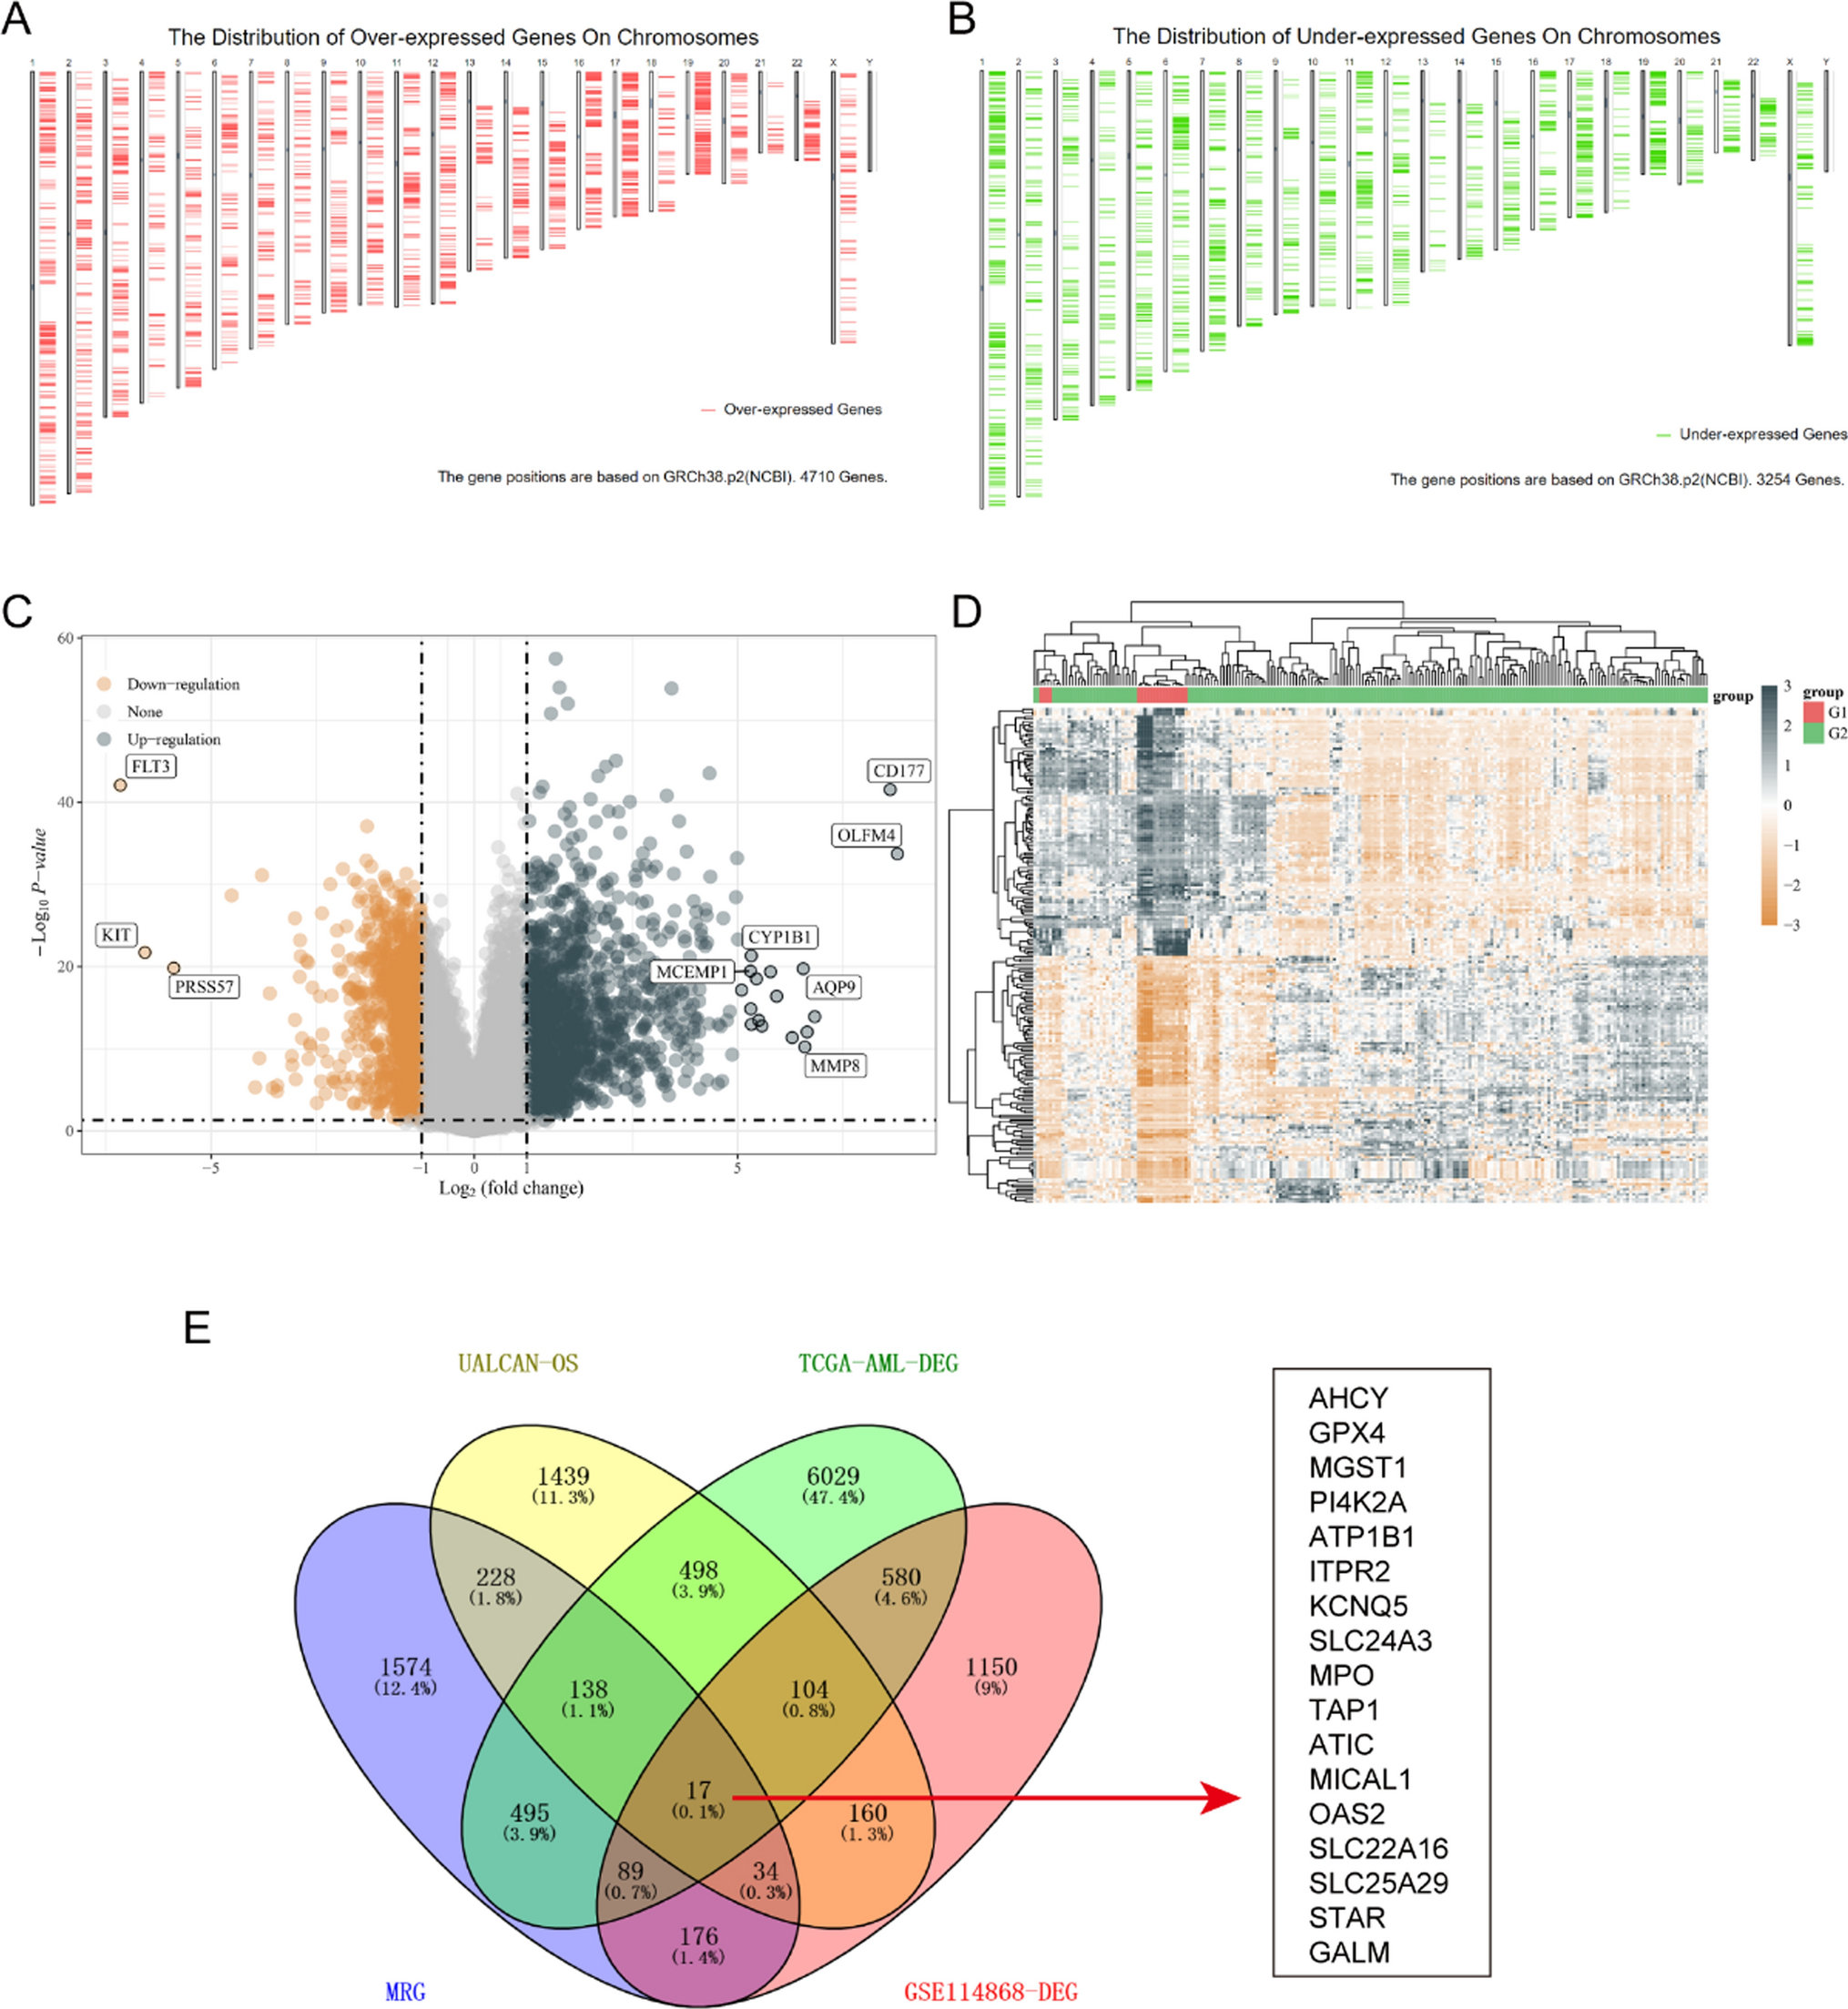
From the GEO database, 288 BC samples and 35 normal samples were retrieved, specifically from the datasets GSE42568, GSE33447, and GSE22820. Additionally, the TCGA database was used to retrieve a dataset including 1101 BC samples and 113 normal samples. The DEGs from these datasets were analyzed using the Limma package (Fig. 1A–D, Tables S1–S4). Our study primarily focused on the up-regulated genes, resulting in the identification of 66 up-regulated DEGs from the four datasets using the Venn program (Fig. 1E, Table S5).
Fig. 1
Identification and function analysis of DEGs. A Volcano plot of GSE42568. B Volcano plot of GSE33447. C Volcano plot of GSE22820. D Volcano plot of TCGA. E Venn plot of the up-regulated DEGs of the four datasets. F Bubble map of GO enrichment analysis in BP. G Bubble map of GO enrichment analysis in CC. H Bubble map of GO enrichment analysis in MF. I Bubble map of KEGG pathway analysis. J PPI network of MFAP2
3.2 Analyzing GO and KEGG and constructing a PPI networkThe GO categories of the up-regulated DEGs were examined to ascertain the functional categories in which the DEGs were implicated. The findings of the GO analysis demonstrated that, in terms of Biological Processes (BP), the DEGs exhibited significant enrichment in embryo development, extracellular structure organization, mitotic cell cycle process, and extracellular matrix organization. Furthermore, in the Cellular Component (CC) analysis, the DEGs were predominantly associated with the extracellular region, extracellular region part, and extracellular matrix. Furthermore, the Molecular Functions (MF) of identical protein binding, extracellular matrix structural constituent, and structural molecule activity were identified (Fig. 1F–H). To gain further insights into the up-regulated DEGs, a KEGG pathway analysis was conducted. The findings revealed that the DEGs were predominantly enriched in the IL-17 signaling pathway and cytokine-cytokine receptor interaction, followed by the toll-like receptor signaling pathway and Influenza A, as depicted in Fig. 1I. Among all the up-regulated DEGs, MFAP2 was ultimately selected as the target gene for our study. To better understand the molecular mechanisms that influence BC, the STRING database was used for establishing the PPI network (threshold = 0.9). Using Cytoscape's MCODE plugin, we identified ten genes whose expression products were highly connected to those of MFAP2 (Fig. 1J).
3.3 Evaluation of the prognostic relevance of MFAP2 in BCTo validate MFAP2’s probable prognostic value, we used UALCAN to explore the relationship between MFAP2 levels and overall survival in patients with BC. The survival curves revealed a significant reduction in overall survival rate among patients who had elevated MFAP2 expression levels in comparison to individuals with reduced expression levels (P = 0.018). Furthermore, survival analysis conducted on data from TCGA yielded consistent findings, revealing a comparable association between MFAP2 expression level and progression-free survival (PFS), disease-free survival (DFS), and disease-specific survival (DSS) (Fig. 2A–D). To further explore the potential of MFAP2 in predicting the survival conditions of BC patients, we optimized univariate and multivariate cox regression analyses. Univariate analysis showed that high MFAP2 expression (P = 0.02316), T stage (P < 0.0001), N stage (P < 0.0001) and M stage (P < 0.0001) correlated with the PFS of BC patients. Then, we incorporated the variables into a multivariable cox regression analysis. The results demonstrated that MFAP2 (P = 0.02567), Ki67 (P = 0.04366), race (P = 0.04092), N stage (P = 0.00641) and M stage (P = 0.00007) were independent prognostic factors in BC (Fig. 2E). We also confirmed that MFAP2 was an independent prognostic factor for DFS and DSS of BC patients (Fig. 2F, G). An analysis of MFAP2 expression levels was performed utilizing the online tool UALCAN, which revealed that expression levels in BC tissues were greater than in tissues that were normal (Fig. 2H; P = 1.62E−12) and there was a correlation between its expression and patient’s age (Fig. 2I).
Fig. 2
In patients with BC, high expression of MFAP2 was associated with poor survival. A Kaplan–Meier curves from the UALCAN were used to analyze the relationship between MFAP2 expression and OS in BC patients. B–D The relationship between MFAP2 expression and PFS/DFS/DSS in BC patients was analyzed using Kaplan–Meier curves derived from the TCGA datasets. E Univariate and multivariate cox regression analyses of PFS in patients with breast cancer. F Univariate and multivariate cox regression analyses of DFS in patients with breast cancer. G Univariate and multivariate cox regression analyses of DSS in patients with breast cancer. H Correlation between MFAP2 expression and sample types. I Correlation between MFAP2 expression and BC patient’s age
3.4 MFAP2 expression was upregulated in TNBC tissuesDuring our study, a noteworthy correlation between MFAP2 expression and breast cancer subtypes was observed. The expression investigation demonstrated a substantial association between MFAP2 expression and BC subclasses (Luminal, HER2 Positive, and TNBC), with particularly high expression levels observed in TNBC. These findings suggested that MFAP2 had the potential to be utilized as a biomarker for diagnosing the TNBC subclass (Fig. 3A). To validate the expression and significance of MFAP2 in TNBC, immunohistochemistry was conducted on tumor tissues and surrounding tissues from 301 TNBC patients. The results showed that positive MFAP2 staining was stronger in tumors than in paracancerous tissue of TNBC patients (Fig. 3B). Furthermore, six pairs of samples from TNBC and paracancerous tissues were employed for western blot verification, and MFAP2 protein expression was clearly elevated in TNBC tissues (Fig. 3C, D). The results of immunohistochemistry and western blot demonstrated that MFAP2 expression level was up-regulated in TNBC tissues, suggesting MFAP2 plays a significant role in the development of TNBC. Thus, the above findings suggested that MFAP2 expression may be a predictor for unfavorable outcomes in BC, especially in TNBC patients.
Fig. 3
Detection and validation of MFAP2 expression in TNBC patients. A Correlation between MFAP2 expression and BC subtypes. B The immunohistochemistry results in our cohort. Magnification: 40 and 200. Scale bar: 500 μm and 100 μm. C, D The protein expression of MFAP2 in 6 pairs of TNBC tissues
3.5 Validation of the prognostic value of MFAP2 in clinical dataTo confirm our previous hypothesis, we employed follow-up data obtained from 238 patients as a test cohort. High and low risk groups have been defined based on the degree of MFAP2 expression of the patients. According to the KM curve, MFAP2 had a predictive effect in TNBC, with patients in the relatively low-risk group having longer OS than those in the group with a higher risk (Fig. 4A). Moreover, the AUCs of 2-, 3- and 5- survival in the ROC curve were displayed in Fig. 4B. According to the results, patients with TNBC who expressed high levels of MFAP2 had a poor prognosis. In addition, we investigated the relationship between MFAP2 transcription and several clinical features, and our findings revealed that MFAP2 gene expression was related to ki67 expression (P = 0.007) and tumor grade (P = 0.030) (Table 1).
Fig. 4
Prognostic value of MFAP2 in TNBC. (A) The relationship between MFAP2 expression and OS in clinical 238 TNBC patients was analyzed by Kaplan–Meier curves. (B) ROC analysis of MFAP2 expression in TNBC based on time
Table 1 Relationship between MFAP2 expression and pathological parameters of TNBC patients3.6 An analysis of the GSEA between groups with high and low expression of MFAP2In GSEA, we evaluated datasets involved in the highly expressed samples in the TCGA-BRCA dataset in order to determine how MFAP2 might function. In the TCGA database, a GSEA analysis was performed on two groups of patient samples based on their level of MFAP2 expression. The biological effects of MFAP2 on TNBC cells are mainly reflected in the epithelial-mesenchymal transition, glycolysis, and apical junction, as shown in Fig. 5A–C. Besides, TP53 mutation can facilitate tumor cell survival [19]. Therefore, we compared the expression level of MFAP2 expression in TP53-mutant and TP53-nonmutant patients. The results showed that BC patients with the TP53 mutation expressed considerably more MFAP2 than BC patients absent the mutation or normal people (Fig. 5D). In conclusion, MFAP2 may play an important role in tumorigenesis of BC.
Fig. 5
Comparison of groups with high and low expression of MFAP2 by GSEA. A–C The application of GSEA was utilized to detect enriched biological processes in samples exhibiting high expression of MFAP2. D The relationship between expression of MFAP2 and TP53 mutation status was revealed by analyzing the TCGA-BRCA database
3.7 Correlation between MFAP2 and immune infiltration and its potential as a prognostic indicator for immunotherapy effectivenessThe TIMER network analysis tool was used to study the link between MFAP2 transcription and immune infiltration in TNBC. We examined the connection between MFAP2 expression and six immunological cells (B cells, CD4 + T cells, CD8 + T cells, neutrophils, macrophages, and dendritic cells). We discovered a weakly significant connection between MFAP2 expression and tumor purity (r = 0.075, P < 0.05). However, macrophage abundance was positively correlated with MFAP2 expression, while other immune infiltrates were negatively correlated (Fig. 6A). According to these results, we analyzed the differential expressed immune-checkpoint genes SIGLEC15, CTLA4, PD-L1, HAVCR2, LAG3, PD-1, TIGIT and PDCD1LG2 in TNBC tissues of different grades and normal tissues. The findings illustrated that PD-L1, CTLA4, HAVCR2, LAG3, PD-1, and TIGIT expression were up-regulated in TNBC tissues. And the expression of PDCD1LG2 and TIGIT were down-regulated in TNBC tissues (Fig. 6B). These data suggested that MFAP2 might be potential immunotherapy targets.
Fig. 6
Immune infiltration analysis of MFAP2. A MFAP2 expression is associated with immune cell abundance. B Different expressions of immune-checkpoints in TNBC and normal tissues. C The correlation between MFAP2 and TMB in TNBC. D, E Correlation analysis between the expression of MFAP2 and PD-1/PD-L1 in GSE167213. F, G Correlation analysis between the expression of MFAP2 and PD-1/PD-L1 in GSE137356. H Immunohistochemistry results indicating low PD-L1 expression in patients with high MFAP2 expression and high PD-L1 expression in patients with low MFAP2 expression. I Immunohistochemistry on PD-1 in TNBC tissues with varied MFAP2 expression. Magnification: 40 and 200. Scale bar: 500 μm and 100 μm
TMB was employed as an emerging biomarker for TNBC immunotherapy. We studied the connection between MFAP2 transcription and TMB in TNBC. The findings demonstrated a negative relationship between TMB and MFAP2. These findings demonstrated that MFAP2 might be used as a prognostic indicator to predict immunotherapy response (Fig. 6C).
3.8 Correlation of MFAP2 with PD-L1 expression in TNBCBecause we discovered a negative association between the levels of MFAP2 and TMB in the prior investigation and in the meantime, high TMB forecasts patients’ higher sensitivity to PD-1/PD-L1 immunotherapy, we supposed that MFAP2 expression and PD-L1 expression are correlated in TNBC. To confirm the hypothesis, we calculated the expression level of the genes in two GEO datasets (GSE167213 and GSE137356). The findings revealed that whereas MFAP2 expression increased, PD-L1 expression decreased significantly (Fig. 6D–G; P < 0.05). To further investigate, immunohistochemistry was used to assess the degree of PD-L1 expression in TNBC patients who had varied levels of MFAP2. As illustrated in Fig. 6H, patients with lower MFAP2 expression exhibited higher levels of PD-L1, and MFAP2 was related to PD-L1 expression (P = 0.004, Table 1), indicating a greater potential for these TNBC patients to benefit from immunotherapy. However, the immunohistochemistry on PD-1 in TNBC tissues didn’t reveal any significant correlation between the two molecules (Fig. 6I). Based on the aforementioned research, we have demonstrated the potential of MFAP2 to serve as a significant biomarker for immunotherapy, offering valuable guidance for clinical treatment of TNBC.
留言 (0)