
記住我


Celiac disease is an immune-mediated enteropathy triggered by gluten in the diet and mediated by antigen-presenting cells, intraepithelial lymphocytes, and T cells (1). The standard screening test for celiac disease is circulating tissue transglutaminase immunoglobulin A (TTG IgA). TTG IgA is highly sensitive and specific (2), but mismatch between serological and histological findings still exists, resulting in diagnostic uncertainty. In addition, while TTG IgA is used for monitoring response and adherence to gluten-free diet, it is not a reliable predictor of mucosal healing (3). These limitations of TTG IgA could be minimized with additional biomarkers.
Fecal markers can assess inflammation of the gut. Fecal calprotectin is a neutrophil marker of inflammation commonly used in the screening of inflammatory bowel disease (IBD) and monitoring disease activity (4). The value of fecal calprotectin in diagnosis of celiac disease has been variably established (5–7).
Fecal neutrophil gelatinase-associated lipocalin (lipocalin-2) is an acute phase reactant expressed by several cell types including neutrophils and enterocytes (8). Fecal lipocalin-2 concentration is elevated in patients with active disease and decreases with mucosal healing in patients with IBD (9,10). Fecal lipocalin-2 has comparable sensitivity and specificity with fecal calprotectin in its ability to predict clinical and endoscopic disease activity in IBD (11,12). In addition, the expression of LCN2, the gene that encodes lipocalin-2, is increased in the duodenum of patients with environmental enteric dysfunction, another small bowel enteropathy with histopathologic similarities to celiac disease (13,14). A prior study found no elevation of plasma lipocalin-2 in patients with celiac disease (15). While immunohistochemistry for lipocalin-2 shows staining in small bowel biopsies of children with celiac disease and not in healthy controls, a difference was not found on quantification (14). We are not aware of any data regarding fecal lipocalin-2 in celiac disease.
Fecal alpha-1 antitrypsin (A1AT) concentration, which indicates protein leakage from the circulation into the gut, is increased in people with celiac disease and correlates with disease activity (16). Protein loss in celiac disease occurs because of structural change in the tight junctions leading to disruption of the function of the epithelial barrier (17).
We hypothesized that markers of inflammation and protein loss would be elevated in patients with newly diagnosed, treatment-naive celiac disease compared with healthy controls. Our study aims to evaluate multiple markers in celiac disease and correlate with serologic and histologic findings as a noninvasive means of evaluating disease activity.
METHODS ParticipantsThis study was approved by the Washington University in St. Louis Human Research Protection Office. Informed consent was obtained from the parent(s) and assent from children 12 years or older. Cases were defined as children aged 0–17.9 years with abnormal celiac serologies (TTG IgA, TTG IgG, deamidated gliadin IgA, deamidated gliadin IgG, or endomysial ab) on a gluten-containing diet who were referred for upper endoscopy. Patients with a history of biopsy-proven celiac disease were excluded. Controls were defined as children aged 0–17.9 years with normal celiac serologies. Patients with a history of known celiac disease or other inflammatory disorders of the gut were excluded.
Celiac serologiesSerologies were often obtained before referral to GI clinic and performed by different clinical laboratories with varying reference ranges based on the assay used. TTG IgA results were normalized by relating to the upper limit of normal of each results' respective reference range.
Sample collectionStool samples were collected at home by participants using a stool collection kit provided by the research team. Samples were transported on ice and stored at −80° C. Plasma samples were collected on the day of the upper endoscopy, transported on ice, and stored at −80°C.
BiopsiesBiopsies were obtained from the duodenal bulb (2 pieces) and the second portion of the duodenum (4 pieces), per our center's protocol (18). Two pathologists blinded to the participants serology results reviewed each biopsy and assigned a modified Marsh score (19). If scores were concordant, this was considered the final score. If the scores diverged by 1 step (e.g., 3a and 3b), then the higher score was used. If the scores diverged by more than 1 step, a third blinded pathologist assigned a modified Marsh score. If 2 of the 3 scores agreed, that score was used. If all 3 scores were different, the middle score was used.
Lipocalin-2, calprotectin, and alpha-1 antitrypsin concentrationsPlasma and stool lipocalin-2 concentrations were determined using a commercially available kit to perform a sandwich ELISA for human lipocalin-2 (Human Lipocalin-2/NGAL R&D Systems, Minneapolis, MN). Plasma samples were diluted 1:1,000 using the reagent diluent buffer provided in the kit. Fecal samples were diluted 1:10,000 by serial dilution. The first dilution of 1:50 used fecal extraction buffer (0.1 M Tris HCL [8.0], 0.15 M NaCl, 1 M urea, 10 mM CaCl2, 0.1 M citric acid monohydrate, 5 g/L BSA, and 0.25 mM Thimerosal). Subsequent dilutions used the reagent diluent buffer provided in the kit.
Fecal calprotectin concentrations were determined using a commercially available kit to perform a sandwich ELISA for human calprotectin (Human Calprotectin HycultBiotech, Wayne, PA). Samples were diluted 1:5,000 by serial dilution.
Fecal A1AT concentrations were determined using a commercially available kit to perform a sandwich ELISA for fecal alpha-1 antitrypsin (Alpha-1 Antitrypsin Immunochrom, Heppenheim, Germany). Samples were diluted 1:12,500 by serial dilution.
For each assay, a standard curve was done on every plate and samples were run in duplicate. A coefficient of variation was less than 15% for each duplicate.
StatisticsSignificance was tested between 2 groups using the Mann-Whitney test and the Fisher exact test for continuous and categorical variables, respectively. Linear regression was used for continuous variables. The Kruskal-Wallis test with post hoc testing was used to determine significance across groups. Receiver operating characteristic analysis was used to determine sensitivity and specificity. All P values were 2-sided, and α values <0.05 were considered statistically significant. Statistical analyses were performed using Prism 9.3.1 (GraphPad).
RESULTS DemographicsIn total, 73 cases and 18 controls were included in this study. The median age was 7 years old for cases and 13 years old for controls with 70% girls and 30% boys (Table 1). Conditions with increased risk of celiac disease were overrepresented in our cases, but not our controls. Specifically, among the cases, there were 5 patients with trisomy 21, 9 patients with type 1 diabetes mellitus, 6 patients with hypothyroidism, and 1 patient with Turner syndrome.
Cases (n = 73) Controls (n = 18) P value Girls, n (%) 51 (70) 13 (72) ns Age, yr, median (IQR) 7 (5–11) 13 (10–16) <0.0001 White race, n (%) 72 (99) 18 (100) ns Ethnicity Hispanic, n (%) 1 (1) 0 ns Trisomy 21, n (%) 5 (7) 0 ns Type 1 DM, n (%) 9 (12) 0 ns Hypothyroidism, n (%) 6 (8) 1 (1) ns Turner syndrome, n (%) 1 (1) 0 nsDM, diabetes mellitus; IQR, interquartile range; ns, nonsignificant.
Of the controls, 1 patient had Helicobacter pylori infection in gastric biopsy and 1 had eosinophilic esophagitis. No other diagnoses were made based on histopathology in the control participants.
The modified Marsh score agreed within 1 level for 62 participants. A third pathologist was used for 11 scores to resolve score differences. Among the cases, 20 were Marsh 0, 1 was Marsh 1, and 52 were ≥ Marsh 3a.
SerologyFive cases were referred for endoscopy for elevation of other celiac serologies with normal TTG IgA (Table 2). Of those 5, 1 case had IgA deficiency. Ancillary celiac screening tests were obtained in a subset of participants at the discretion of the treating physician (Table 2). The degree of TTG IgA elevation did not correlate significantly with a modified Marsh score among cases who were referred for endoscopy for elevated TTG IgA. Among cases with elevated TTG, there was significant difference in degree of fold change of TTG IgA to upper limit elevation when comparing Marsh groups 0–1 with Marsh 3a–c combined (P = 0.009).
Table 2. - Cases serology results Positive TTG IgA (n = 68) Negative TTG IgA (n = 5) Negative Positive Negative Positive TTG IgG 3 6 0 4 Deamidated gliadin IgA 3 6 1 0 Deamidated gliadin IgG 0 4 0 1 Endomysial IgA 3 21 1 0Ig, immunoglobulin; TTG, tissue transglutaminase.
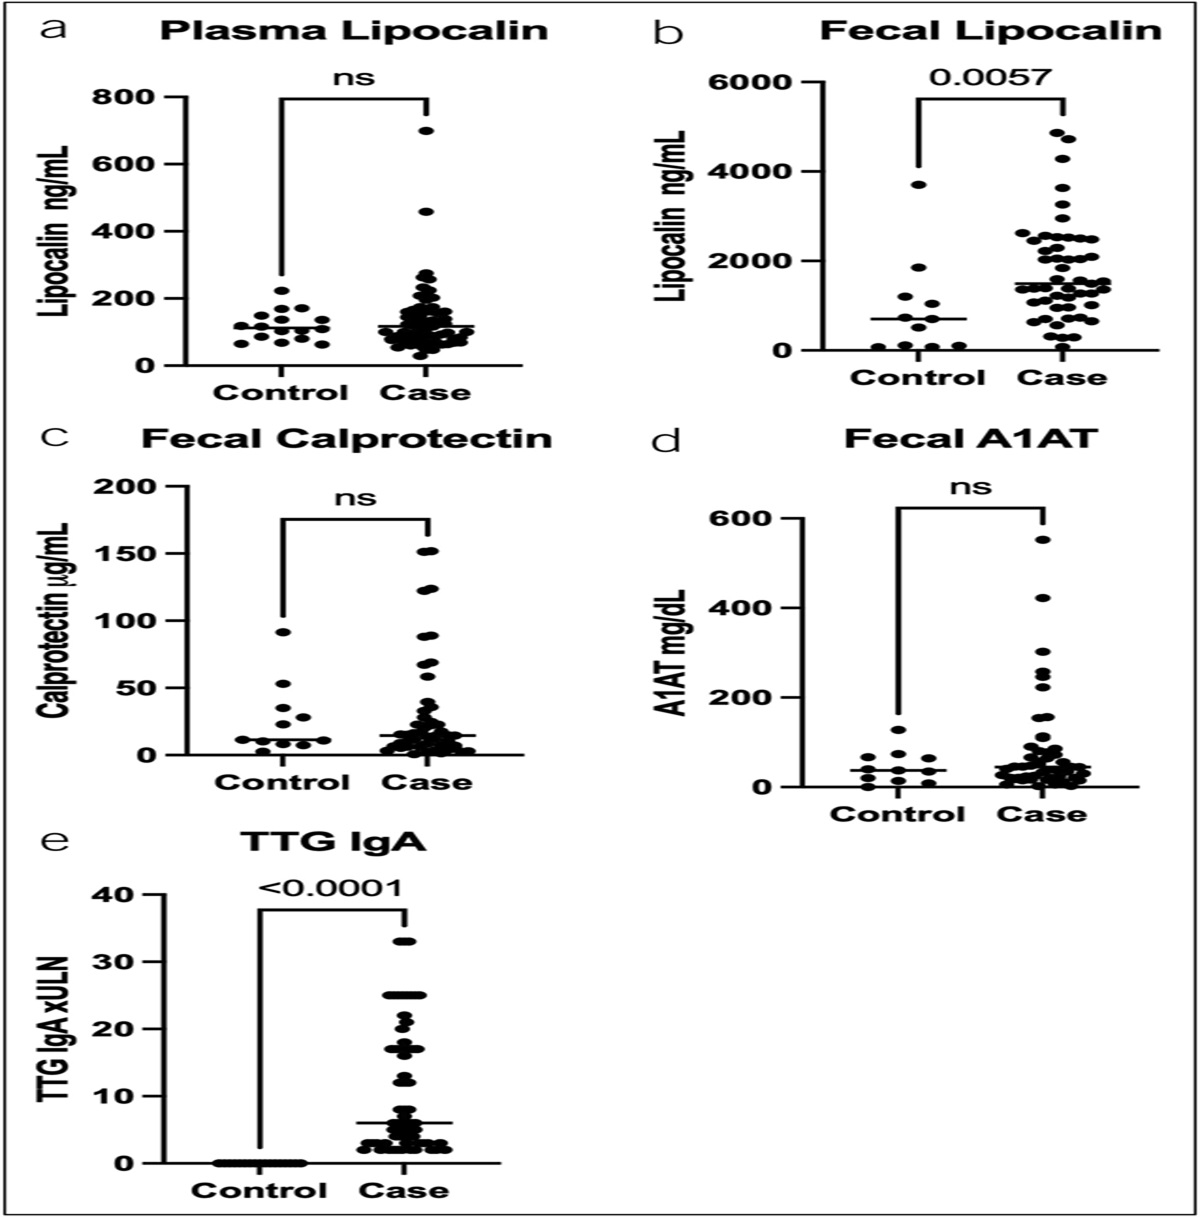
We measured the plasma concentration of lipocalin-2 and concentrations of lipocalin-2, calprotectin, and A1AT in stools (Figure 1). Fecal lipocalin-2 was significantly higher in stool from cases than controls (P = 0.0057) (Figure 1b). We found that concentrations of fecal lipocalin-2 differed by a modified Marsh score (P = 0.0367) (Figure 2b). We combined Marsh 3a–c to test if fecal lipocalin-2 could detect a difference between those with biopsy evidence of celiac disease and controls, and again found significantly higher concentrations of fecal lipocalin-2 in participants with celiac disease compared with controls (P = 0.0095) (see Supplementary Figure 1a, Supplementary Digital Content 1, https://links.lww.com/CTG/B98). Among those with elevated serology, we compared those with Marsh 3a–c with Marsh 0 and found no significant difference in fecal lipocalin-2 concentrations (see Supplementary Figure 1b, Supplementary Digital Content 1, https://links.lww.com/CTG/B98). Plasma lipocalin-2 concentration was comparable between cases and controls (Figure 1a) and could not distinguish degree of histopathology based on the modified Marsh score (Figure 2a).
 Figure 1.:
 Comparison of fecal and plasma markers in cases vs controls. P values from the Mann-Whitney test. (a) Plasma lipocalin-2 results, (b) fecal lipocalin-2 results, (c) fecal calprotectin results, (d) fecal A1AT, and (e) TTG IgA results. Horizontal lines represent medians. A1AT, alpha-1 antitrypsin; Ig, immunoglobulin; TTG, tissue transglutaminase.
 Figure 2.:
 Comparison of fecal and plasma markers vs modified Marsh score. P values from the Kruskal-Wallis test. (a) Plasma lipocalin results, (b) fecal lipocalin-2 results, (c) fecal calprotectin results, and (d) fecal A1AT results. Horizontal lines represent medians. A1AT, alpha-1 antitrypsin.
Fecal calprotectin concentrations did not significantly differ in stools between cases and controls (Figure 1c) but showed significant variation when stratified by the degree of duodenal mucosal damage (P = 0.0373) (Figure 2c). However, on post hoc analysis of the groups, only the medians of the Marsh 3a and Marsh 3c groups were significantly different (P = 0.0373), and there was no significant difference between any of the Marsh 3 groups and either Marsh 0 or controls. Combining Marsh 3a–c to test if fecal calprotectin could detect a difference between those with biopsy evidence of celiac disease and controls also showed no difference (see Supplementary Figure 2, Supplementary Digital Content 1, https://links.lww.com/CTG/B98).
Fecal A1AT concentrations did not differ between cases and controls (Figure 1d) or by degree of histopathology (Figure 2d). However, we noted that a fecal A1AT concentration greater than 100 mg/dL, which is the threshold for clinically significant protein losing enteropathy, had a specificity of 91% for distinguishing cases vs controls, but only a sensitivity of 20%. The specificity of a fecal alpha-1 antitrypsin of >100 mg/dL for biopsy confirmed disease (defined as a modified Marsh score ≥3a or greater) was 90% compared with controls and 93% compared with cases with elevated serologies but normal biopsies (Marsh 0) with sensitivity of 26% for each.
To determine if fecal markers or plasma lipocalin-2 differed with the degree of circulating TTG IgA concentrations, we examined cases with elevated TTG IGA and found no significant association for any of the markers with the degree of TTG IgA elevation (Figure 3).
 Figure 3.:
 Comparison of fecal and plasma markers vs normalized TTG. P values from linear regression. (a) Plasma lipocalin-2 results, (b) fecal lipocalin-2 results, (c) fecal calprotectin results, and (d) fecal A1AT results. A1AT, alpha-1 antitrypsin; TTG, tissue transglutaminase; ULN, upper limit of normal.
DISCUSSIONThe lack of plasma elevation of lipocalin-2 agrees with the findings of Janas et al (15). The difference in the stool and plasma findings suggests a difference in the local intestinal inflammatory response or epithelial turnover compared with the systemic inflammatory response. As lipocalin-2 is produced by both immune cells and the enterocytes themselves, either could be the source of the lipocalin-2 found in the stool.
Fecal lipocalin-2 differentiated children with biopsy confirmed celiac disease as defined by a modified Marsh score of 3a or greater from controls. However, it was not able to differentiate cases with biopsy confirmed celiac from cases who were seropositive but had nonconfirmatory biopsies of Marsh 0. This suggests that the Marsh 0 cases may have some degree of intestinal inflammation which could represent early celiac disease or potentially have another inflammatory process leading to nonspecific elevation of celiac serologies.
No difference in fecal calprotectin was found between cases and controls, further supporting recent European Society for Pediatric Gastroenterology, Hepatology and Nutrition consensus that calprotectin is not a useful marker in celiac disease diagnosis based on mixed results of prior studies (20). We did find a significant difference between the medians of the Marsh 3a and 3c groups but without a difference compared with either the controls or the Marsh 0 group, this is unlikely to have clinical relevance.
We did not find a significant elevation of fecal A1AT in cases compared with controls. Previous studies have found a significant increase in A1AT clearance in patients with active celiac disease (16). The lack of difference in our cohort may be due to the use of spot testing vs clearance. While random stool testing is easier for patients in the clinical setting, it does not account for circulating concentrations of A1AT and variation within stool samples, which decreases the sensitivity of the test compared with 24-hour fecal A1AT clearance tests (21).
While the median A1AT of the cases was not significantly elevated compared with controls, there was a trend toward higher A1AT concentrations in the cases (Figure 1d) which we investigated further with receiver operating characteristic analysis. The clinical laboratory cutoff for a protein losing enteropathy is 100 mg/dL. This cutoff had good specificity in our cohort for biopsy-confirmed celiac disease, but poor sensitivity. We have found that a normal random A1AT does not rule out celiac disease, but a level elevated in the range of clinically significant protein losing enteropathy could distinguish patients with positive serologies when comparing with controls. Furthermore, a random fecal A1AT >100 mg/dL was predictive of participants who had biopsy-confirmed disease compared with participants who had positive serologies but nonconfirmatory biopsies.
A potential limitation of this study may be the selection of controls who underwent upper endoscopy for gastrointestinal symptoms, though no duodenal inflammation was found on their biopsies. Another potential limitation is the difference in the median ages between the case and control groups. While the cases represent the age range of new onset celiac disease patients in our center, the controls skewed older which likely represents the typical age of functional abdominal pain presentation as those are the patients most likely to undergo upper endoscopy without known gastrointestinal inflammation and negative celiac serologies. There is emerging interest in the use of fecal lipocalin as a biomarker of enteric dysfunction in children (22,23). It is plausible that there is age-dependency to values, as with fecal calprotectin in children (24) and the elderly (25). We encourage that similar norms be established for fecal lipocalin concentrations. While the comorbidities of trisomy 21, type 1 diabetes, and Turner syndrome were not represented in the control group, this is representative of the increased risk of celiac disease in patients with these disorders.
In conclusion, we have found elevation of lipocalin-2 in stool, but not plasma, to be a marker of histopathologic changes in patients with elevated celiac serologies. Calprotectin was not useful in diagnosing celiac disease. Clinically significant elevations of A1AT in the stool are specific but not sensitive for biopsy-confirmed celiac disease when compared with controls. Further studies are needed to investigate the change in fecal lipocalin-2 concentrations in response to gluten-free diet and compared with mucosal healing after treatment. Our data endorse studying further fecal biomarkers to confirm or refute the presence of celiac disease in ambiguous diagnostic situations.
CONFLICTS OF INTERESTSGuarantor of the article: Lori R. Holtz, MD, MSPH.
Specific author contributions: K.A.S.: conducted the study, collected and interpreted data, drafted and edited the manuscript. M.H.: interpreted the data and edited the manuscript. C.M.: interpreted the data and edited the manuscript. T.C.L.: interpreted the data. W.A.F.: secured funding and provided oversight into cohort design and recruitment. JH: recruited participants and collected data. LL: recruited participants and collected data. C.R.: conduced data analysis. L.R.H.: designed study, provided oversight, secured funding, drafted initial manuscript, and edited manuscript. All authors have approved the final draft submitted.
Financial support: This work was supported in part by the Bill & Melinda Gates Foundation (OPP1066153), the Children's Discovery Institute (MD-FR-2013-292), and P30DK052574 (for the Biobank Core). Study sponsors had no role in study design, collection, analysis, and interpretation of data, writing of this report, or decision to submit for publication.
Potential competing interests: None to report.
Ethics: This study was approved by the Washington University in St. Louis Human Research Protection Office.
Previous presentation: This manuscript was previously posted to medRxiv: https://doi.org/10.1101/2023.05.24.23290489.
Study Highlights
WHAT IS KNOWN ✓ Tissue transglutaminase immunoglobulin A (TTG IgA) is highly sensitive and specific for biopsy-proven celiac disease, but mismatch between serological and histological findings does exist which creates diagnostic challenges. ✓ TTG IgA is not a reliable marker of mucosal healing. WHAT IS NEW HERE ✓ Lipocalin-2 is significantly elevated in the stool but not the plasma of children with positive celiac serologies compared with controls. ✓ Fecal calprotectin and fecal alpha-1 antitrypsin are similar in children with positive celiac serologies and controls. ✓ Elevated fecal alpha-1 antitrypsin is specific, but not sensitive for biopsy-proven celiac disease. REFERENCES 1. Schuppan D. Current concepts of celiac disease pathogenesis. Gastroenterology 2000;119(1):234–42. 2. Chou R, Bougatsos C, Blazina I, et al. Screening for celiac disease: Evidence report and systematic review for the US Preventive Services Task Force. JAMA 2017;317(12):1258–68. 3. Leonard MM, Weir DC, DeGroote M, et al. Value of IgA tTG in predicting mucosal recovery in children with celiac disease on a gluten-free diet. J Pediatr Gastroenterol Nutr 2017;64(2):286–91. 4. Bunn SK, Bisset WM, Main MJ, et al. Fecal calprotectin as a measure of disease activity in childhood inflammatory bowel disease. J Pediatr Gastroenterol Nutr 2001;32(2):171–7. 5. Balamtekın N, Baysoy G, Uslu N, et al. Fecal calprotectin concentration is increased in children with celiac disease: Relation with histopathological findings. Turk J Gastroenterol 2012;23(5):503–8. 6. Capone P, Rispo A, Imperatore N, et al. Fecal calprotectin in coeliac disease. World J Gastroenterol 2014;20(2):611–2. 7. Ertekin V, Selimoğlu MA, Turgut A, et al. Fecal calprotectin concentration in celiac disease. J Clin Gastroenterol 2010;44(8):544–6. 8. Moschen AR, Adolph TE, Gerner RR, et al. Lipocalin-2: A master mediator of intestinal and metabolic inflammation. Trends Endocrinol Metab 2017;28(5):388–97. 9. Thorsvik S, Bakke I, van Beelen Granlund A, et al. Expression of neutrophil gelatinase-associated lipocalin (NGAL) in the gut in Crohn's disease. Cell Tissue Res 2018;374(2):339–48. 10. Thorsvik S, Damås JK, Granlund AV, et al. Fecal neutrophil gelatinase-associated lipocalin as a biomarker for inflammatory bowel disease. J Gastroenterol Hepatol 2017;32(1):128–35. 11. Zollner A, Schmiderer A, Reider SJ, et al. Faecal biomarkers in inflammatory bowel diseases: Calprotectin versus lipocalin-2: A comparative study. J Crohns Colitis 2021;15(1):43–54. 12. Lundström ML, Peterson C, Lampinen M, et al. Faecal biomarkers of neutrophil and eosinophil origin reflect the response to biological therapy and corticosteroids in patients with IBD. Clin Transl Gastroenterol 2023;14(8):e00605. 13. Chen RY, Kung VL, Das S, et al. Duodenal microbiota in stunted undernourished children with enteropathy. N Engl J Med 2020;383(4):321–33. 14. Haberman Y, Iqbal NT, Ghandikota S, et al. Mucosal genomics implicate lymphocyte activation and lipid metabolism in refractory environmental enteric dysfunction. Gastroenterology 2021;160(6):2055–71.e0. 15. Janas RM, Rybak A, Wierzbicka-Rucińska A, et al. Serum concentrations of insulin, ghrelin, adiponectin, leptin, leptin receptor and lipocalin-2 in children with celiac disease who do and do not adhere to a gluten-free diet. Gut Liver 2016;10(4):587–94. 16. Bai JC, Sambuelli A, Niveloni S, et al. Alpha 1-antitrypsin clearance as an aid in the management of patients with celiac disease. Am J Gastroenterol 1991;86(8):986–91. 17. Schulzke JD, Bentzel CJ, Schulzke I, et al. Epithelial tight junction structure in the jejunum of children with acute and treated celiac sprue. Pediatr Res 1998;43(4 Pt 1):435–41. 18. Holtz LR, Hoffmann J, Linneman L, et al. Rhamnose is superior to mannitol as a monosaccharide in the dual sugar absorption test: A prospective randomized study in children with treatment-naive celiac disease. Front Pediatr 2022;10:874116. 19. Oberhuber G. Histopathology of celiac disease. Biomed Pharmacother 2000;54(7):368–72. 20. Koninckx CR, Donat E, Benninga MA, et al. The use of fecal calprotectin testing in paediatric disorders: A position paper of the European Society for Paediatric Gastroenterology and Nutrition Gastroenterology Committee. J Pediatr Gastroenterol Nutr 2021;72(4):617–40. 21. Strygler B, Nicar MJ, Santangelo WC, et al. Alpha 1-antitrypsin excretion in stool in normal subjects and in patients with gastrointestinal disorders. Gastroenterology 1990;99(5):1380–7. 22. Duckworth LA, Sutton KA, Shaikh N, et al. Quantification of enteric dysfunction in cystic fibrosis: Inter- and intraindividual variability. J Pediatr 2024;265:113800. 23. Thibault MP, Tremblay E, Horth C, et al. Lipocalin-2 and calprotectin as stool biomarkers for predicting necrotizing enterocolitis in premature neonates. Pediatr Res 2022;91(1):129–36. 24. Roca M, Rodriguez Varela A, Carvajal E, et al. Fecal calprotectin in healthy children aged 4–16 years. Sci Rep 2020;10(1):20565. 25. Heston MB, Hanslik KL, Zarbock KR, et al. Gut inflammation associated with age and Alzheimer's disease pathology: A human cohort study. Sci Rep 2023;13(1):18924.
留言 (0)