
記住我


Immune-mediated gastrointestinal (GI) diseases, including inflammatory bowel disease (IBD) and celiac disease, are common and increasingly diagnosed in children and adolescents around the globe (1,2). Canada continues to be among the countries with the highest prevalence of IBD (1). Although the incidence of IBD peaks at ages 20–29 years, increasingly more patients younger than 18 years are being diagnosed with IBD (1,3). The etiology of this trend remains unclear, but it is suggested to be multifactorial involving genetics, altered gut microbiome, and environmental factors such as western diet and lifestyle (1).
Celiac disease can present at any age after the introduction of solid foods, typically around the first few years of life (4). It peaks during the first 2 years of life and again between 10 and 30 years of age (4). This is a lifelong, multisystem, inflammatory condition that is characterized by T-cell–mediated immune response to ingested gluten (2). The global prevalence in the general population is estimated at 1% with a significant increase in diagnosis in the past few decades (4). Better use of diagnostic methods and increasing knowledge have led to a 3-fold rise in the diagnosis of celiac disease in the Canadian pediatric population (4).
Both IBD and celiac disease (hereafter referred to together as “immune-mediated GI disease”) are lifelong conditions. As the incidence increases, the patient disease burden and associated health care costs also rise (5). Large population-based studies have suggested a bidirectional relationship between immune-mediated diseases and eating disorders (6).
Eating disorders affect about 1 million Canadians and have a mortality rate of 10%–15% (7). The incidence and prevalence of eating disorders are highest during adolescence and early adulthood (7). Affected women aged 15–24 years have a mortality rate that is 12 times greater than the general population (7). The economic impact and health care costs associated with treating eating disorders are substantial (8). The mortality rate of individuals with anorexia nervosa who received in-patient treatment was found to be 5 times higher than that of the general population (8). These data and the protracted pathology of eating disorders with symptoms persisting for decades after in-patient care further necessitate the need for identifying risk groups for earlier detection and treatment.
Numerous studies have found that individuals with GI disease, most notably celiac disease, are at an increased risk of developing psychiatric disorders in general (9–15). However, this literature is mostly composed of case series, small studies, or self-reported population surveys (12,16–18). European population-based studies by Zerwas et al and Raevuori et al have shown increased eating disorder development in autoinflammatory conditions, which included diseases with GI involvement (6,19).
Our objective was to examine the association between immune-mediated GI disease and subsequent development of an eating disorder. Thus, this study will empower further development of evidence-based tools to address the highly challenging nature of identifying and managing coexisting immune-mediated GI disease and eating disorders.
METHODSThis was a retrospective matched cohort study that used health administrative data from the province of Ontario, Canada. The objectives, outcomes, and analyses were determined a priori, and the protocol was approved by the Queen's University Health Sciences and Affiliated Teaching Hospitals Research Ethics Board (#6036232).
Data sourcesUniversal coverage of insured health services is provided to Ontario residents through a single-payer, the government-run Ontario Health Insurance Plan (OHIP). ICES (formerly the Institute for Clinical Evaluative Sciences; www.ices.on.ca) maintains data sets from the Ontario government's health administrative databases that contain information used by the Ontario government for funding and reimbursement purposes, as well as a registry that captures demographic information on all residents who have ever had an OHIP number (the Registered Persons Database). Records for the same individuals can be linked across ICES data sets using encoded unique identifiers. ICES is an independent, nonprofit research institute whose legal status under Ontario's health information privacy law allows it to collect and analyze health care and demographic data, without consent, for health system evaluation and improvement.
For this study, records were linked across the following data sets: the Discharge Abstract Database (DAD); the OHIP Claims Database (claims submitted by fee-for-service physicians, shadow billings submitted by most physicians compensated through alternative payment plans, and claims for laboratory services); the National Ambulatory Care Reporting System (NACRS; visits to emergency departments); the Ontario Mental Health Reporting System (OMHRS; inpatient mental health bed discharges); the Same Day Surgery (SDS) database; the Ontario Marginalization Index data sets (which contain an area-level measure of deprivation derived from 18 Census variables (20)); and the Ontario Crohn's and Colitis Cohort (OCCC) data set. The latter is an ICES-derived cohort that uses validated algorithms to identify prevalent (1991 onward) and incident (since 1994) cases of IBD. This algorithm is validated as having 91.1% sensitivity, 99.5% specificity, 188.3 positive likelihood ratio, and 0.09 negative likelihood ratio in children younger than 18 years (21). The subtype of IBD (Crohn's, ulcerative colitis, and IBD-unclassified) is also captured.
Study cohortThe OCCC, DAD, NACRS, and SDS databases were searched to identify individuals <50 years of age with a prevalent or incident diagnosis of an immune-mediated GI disease at any time between July 1, 2002, and December 31, 2020 (see Supplementary Table 1, Supplementary Digital Content 1, https://links.lww.com/CTG/B112 for details on the search criteria/definitions). The index date was the date of the first record indicating the presence of an immune-mediated GI disease if the individual was aged 6 years and older or the individual's sixth birthday if younger than 6 years. Exposed individuals (cases) were matched to 1 or 2 unexposed individuals (controls) based on year of birth, sex, and the local health integration network where they resided on the index data. Local health integration networks comprise 14 health authorities across Ontario that were responsible for planning and funding health services in their respective geographic regions (22).
Controls were assigned the same index date as their matched cases. Cases and controls had to have had OHIP coverage on the index date, on the date 2 years before the index date, and on the date 1 year after the index date to be eligible for inclusion. Cases were excluded if they had a diagnostic code indicating a potential pre-existing eating disorder (see Supplementary Table 1, Supplementary Digital Content 1, https://links.lww.com/CTG/B112), defined as having this code at any point during the 2-year period up to and including the index date. This same exclusion was applied to the controls; the latter were also excluded if they had a record in the OCCC database (prevalent or incident case) between July 1, 2002, and January 31, 2022, or an International Classification of Diseases, Tenth Revision (ICD-10) code of K50.x (Crohn's), K51.x (ulcerative colitis), or K90.0 (celiac) in the DAD, NACRS, or SDS databases. If a matched control was so excluded, another control was sought in an effort to match 2 controls to each case. Only cases where at least 1 matched control could be found were included in the study cohort.
Additional covariates included rural residence on the index date and an area-level measure of socioeconomic status. The latter was assigned as quintile of deprivation using the Ontario Marginalization Index from 2001, 2006, 2011, or 2016 (whichever of these years was closest to the index date).
OutcomeEating disorder diagnoses were identified by searching from 1 day after the index date up to January 31, 2022, for hospitalizations (DAD and OMHRS) or emergency department visits (NACRS) with an ICD-10 or Diagnostic and Statistical Manual of Mental Disorders, 4th edition code in any of the diagnostic fields indicating anorexia nervosa (F50.0, F50.1, and 307.1), bulimia nervosa (F50.2, F50.3, and 307.5), or eating disorder, not otherwise specified (F50.8 and F50.9) (23). The first occurrence of any of these codes was considered the date of diagnosis of “any eating disorder (23).” We did not perform an analysis of eating disorder subtypes. A study by Kurdyak et al that used Ontario's health administrative data sets demonstrated that patients often had diagnostic codes for multiple eating disorders, thus making subtyping unreliable (23).
AnalysisThe data sets were linked using unique coded identifier and analyzed at ICES. All analyses were completed by an ICES staff member using SAS version 9.4 (Cary, NC). Baseline and other characteristics of the cases and controls were compared using the χ2 test for categorical variables and the independent-samples t test (mean values) and Kruskal-Wallis test (medians) for continuous variables.
Crude incidence rates of any eating disorder were calculated for immune-mediated GI disease overall, by disease type (Crohn's, ulcerative colitis, IBD-unclassified, and celiac disease), and after restricting the cohort to incident cases and their matched controls (with rates reported separately for those ≤18 years of age and those >18 years on the index date). Because celiac disease was identified using endoscopy or biopsy procedural codes (see Supplementary Table 1, Supplementary Digital Content 1, https://links.lww.com/CTG/B112), all such cases were assumed to be incident diagnoses. Person-time was calculated as the time from the index date to the earliest of (i) date of the first record indicating an eating disorder, (ii) date of termination of OHIP coverage or death, or (iii) January 31, 2022. Incidence rate ratios and 95% confidence intervals were estimated using generalized Poisson regression models.
Crude and adjusted Cox proportional hazards models were fit to estimate the hazard ratios for eating disorders over an observation period of 19 years (index date from July 1, 2002, with maximum follow-up to January 31, 2022) associated with immune-mediated GI disease overall and by disease type. Adjusted models included as covariates (i) the matching variables (year of birth, sex, and local health integration network at index date) and (ii) the matching variables, rural residence at index date, and Ontario Marginalization Index (records with missing values for the latter 2 variables were dropped from the analysis). Scaled Schoenfeld residuals were plotted against time to verify the proportional hazards assumption. This analysis was repeated in 2 subgroups of incident cases of immune-mediated GI disease (≤18 years and >18 years on index date) and their matched controls.
We conducted a sensitivity analysis whereby an eating disorder was only coded as being present if a relevant ICD-10 code was found in the “most responsible diagnosis” field of the DAD or the NACRS databases or where an eating disorder was coded as the main complaint in the OMHRS database. Poisson and Cox regression models were refit using this alternatively defined outcome.
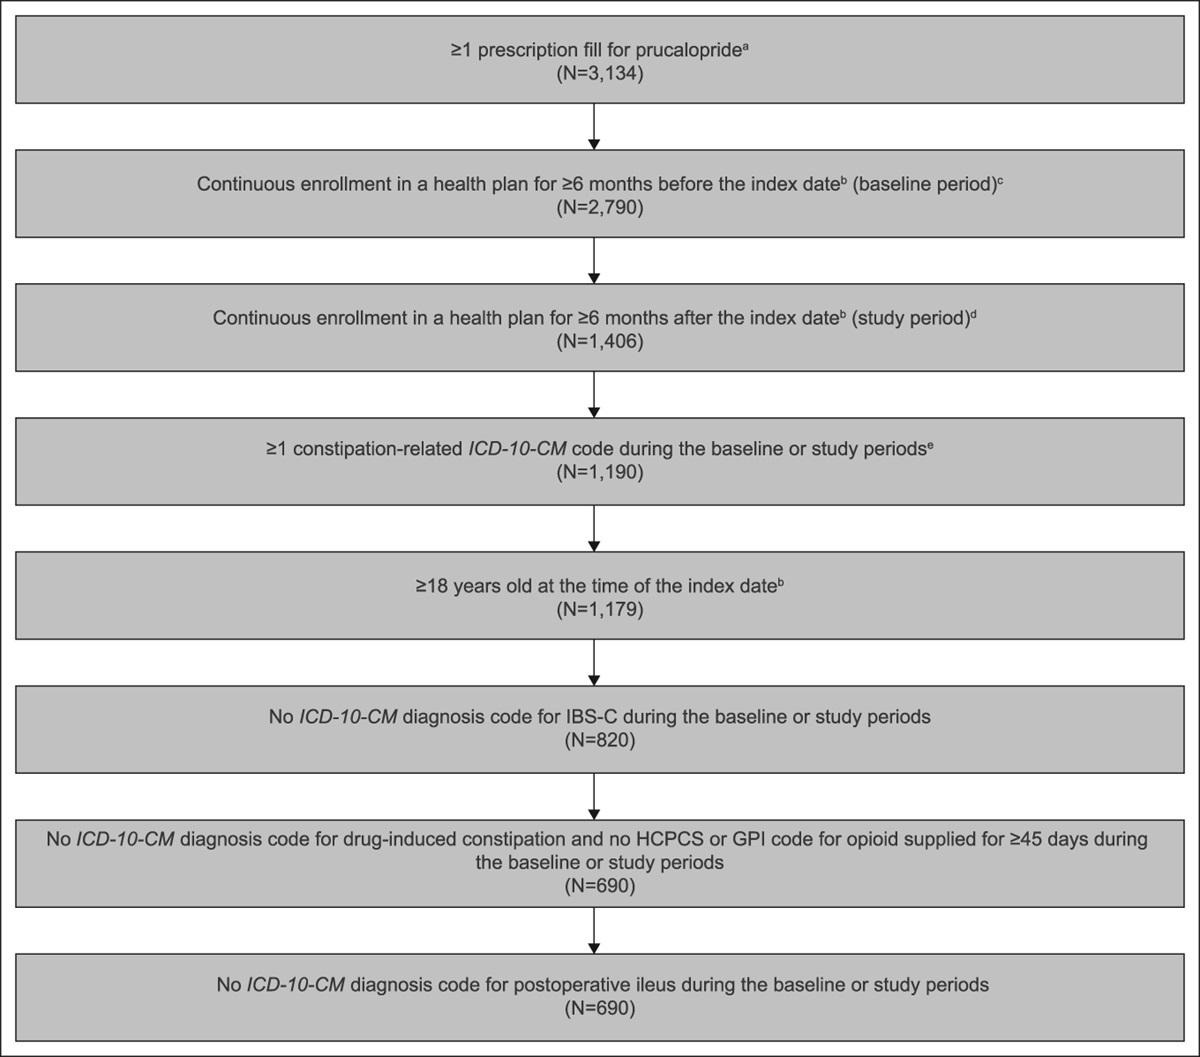
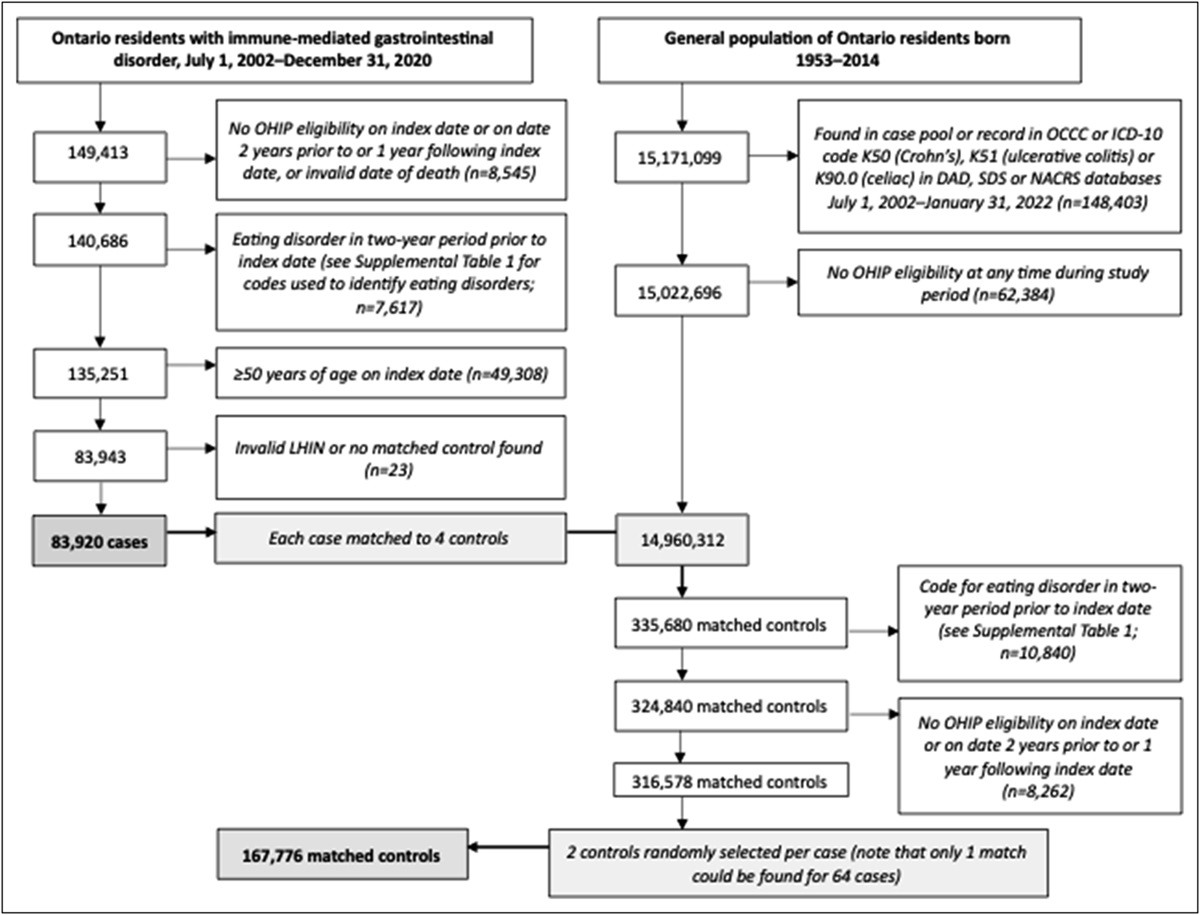
RESULTSA total of 149,413 residents of Ontario were identified as having an immune-mediated GI disease between July 1, 2002, and December 31, 2020. After the exclusion criteria were applied (Figure 1), 83,920 individuals remained; 50,579 (60%) were classified as incident and 33,341 (40%) as prevalent cases. The majority had Crohn's disease (n = 33,961 [40%]) or ulcerative colitis (n = 32,389 [39%]), followed by celiac disease (n = 14,718 [17%]). There were 2,852 cases (3.4%) in the OCCC data set with IBD-unclassified. The cases were matched to 167,776 controls (Figure 1; only 1 match could be found for 64 cases, with 2 matched controls identified for the remainder).
 Figure 1.:
 Flow chart of cohort creation process, including patient inclusion and exclusion.
Table 1 provides the demographic and diagnostic information on the study cohort. The median duration of follow-up was 13.1 years (interquartile range 7.2–19.6) for the cases and 12.7 years (interquartile range 6.9–19.6) for the controls. Over the follow-up period, 161 cases (0.19%) and 160 controls (0.10%) were identified with an eating disorder in the DAD, NACRS, or OMHRS databases. No significant differences were found between the cases and controls in terms of the mean or median number of months from the index date to the date of the first recorded code indicating an eating disorder.
Table 1. - Characteristics of Ontario residents Overall (n = 251,696) Immune-mediated GI disorder P valuea Standardized difference Yes (n = 83,920) No (n = 167,776) Birth year 1950–1954 4,508 (1.8) 1,503 (1.8) 3,005 (1.8) 1 1955–1959 20,102 (8.0) 6,703 (8.9) 13,399 (8.0) 1960–1964 29,366 (11.7) 9,792 (11.7) 19,574 (11.7) 1965–1969 31,985 (12.7) 10,664 (12.7) 21,321 (12.7) 1970–1974 32,785 (13.0) 10,932 (13.0) 21,853 (13.0) 1975–1979 28,875 (11.5) 9,629 (11.5) 19,246 (11.5) 1980–1984 27,371 (10.9) 9,125 (10.9) 18,246 (10.9) 1985–1989 23,719 (9.4) 7,908 (9.4) 15,811 (9.4) 1990–1994 20,197 (8.0) 6,733 (8.0) 13,464 (8.0) 1995–1999 14,803 (5.9) 4,936 (5.9) 9,867 (5.9) 2000–2004 9,921 (3.9) 3,307 (3.9) 6,614 (3.9) 2004–2009 5,502 (2.2) 1,834 (2.2) 3,668 (2.2) 2010–2014 2,562 (1.0) 854 (1.0) 1,708 (1.0) Female 137,088 (54.5) 45,707 (54.5) 91,381 (54.5) 0.996 Index year (for GI disease) 2002–2006 116,277 (46.2) 38,770 (46.2) 77,507 (46.2) 1 2007–2011 48,367 (19.2) 16,126 (19.2) 32,241 (19.2) 2012–2016 51,267 (20.4) 17,094 (20.4) 34,173 (20.4) 2017–2020 35,785 (14.2) 11,930 (14.2) 23,855 (14.2) Age at index date for GI disease Median (IQR) 32.0 (22.0–40.0) 32.0 (22.0–40.0) 32.0 (22.0–40.0) 0.968 Eating disorder identified in DAD, NACRS, or OMHRS database (any diagnosis field) 321 (0.13) 161 (0.19) 160 (0.10) <0.001 0.028 Eating disorder identified as most responsible diagnosis in DAD or NACRS database or coded as main complaint in OHMRS database 148 (0.06) 80 (0.10) 68 (0.04) <0.001 0.023 Interval between index date for GI disease and diagnosis of eating disorder, mo Mean (SD) 64.2 (51.9) 60.9 (49.6) 67.5 (54.0) 0.251 0.150 Median (IQR) 50.3 (24.2–89.6) 46.4 (24.1–86.9) 52.7 (25.1–96.6) 0.331 Interval between index date for GI disease and diagnosis of eating disorder (incident cases), mo Mean (SD) 57.6 (43.1) 55.6 (41.1) 59.7 (45.2) 0.485 0.111 Median (IQR) 48.0 (24.1–82.2) 47.8 (25.7–80.6) 48.2 (23.6–83.0) 0.660 Interval between index date for GI disease and diagnosis of eating disorder (prevalent cases), mo Mean (SD) 78.2 (64.8) 73.3 (64.1) 82.5 (65.6) 0.475 0.164 Median (IQR) 66.3 (25.0–113.9) 46.4 (21.5–112.0) 75.1 (31.1–114.7) 0.477Values are n (%) unless otherwise indicated.
DAD, Discharge Abstract Database; GI, gastrointestinal; IQR, interquartile range; LHIN, local health integration network; NACRS, National Ambulatory Care Reporting System; OMHRS, Ontario Mental Health Reporting System.
aBased on χ2 test for categorical variables and the independent-samples t test (mean) and Kruskal-Wallis test (median) for continuous variables.
Table 2 presents the incidence rates of eating disorders identified in the DAD, NACRS, or OMHRS databases. Overall and for those cases where the specific immune-mediated GI disease was known (i.e., excluding the “IBD-unclassified” group), the incidence rates were significantly higher for the cases than the controls (Table 2). This same pattern was observed among the incident cases ≤18 years of age and their controls. However, the confidence intervals for the incident cases >18 years of age included the null value for the specific diagnoses or was marginally significant (and the lower confidence limit for “any immune-mediated GI disease” was 1.02).
Table 2. - Incidence of eating disorders in hospital admissions and emergency department data per 100,000 person-years of follow-up among Ontario residents Immune-mediated GI disease No immune-mediated GI disease IRR (95% CI) P value No. with eating disorder Incidence ratea (95% CI) No. with eating disorder Incidence ratea (95% CI) All cohort Any immune-mediated GI disease 161 14.98 (12.82–17.50) 160 7.54 (6.45–8.81) 1.99 (1.60–2.48) <0.001 Crohn's disease 60 12.50 (9.70–16.11) 66 6.99 (5.49–8.91) 1.79 (1.26–2.53) 0.001 Celiac disease 50 40.36 (30.47–53.45) 47 18.88 (14.13–25.23) 2.14 (1.44–3.18) <0.001 Ulcerative colitis 45 10.34 (7.72–13.85) 41 4.83 (3.56–6.56) 2.14 (1.40–3.27) <0.001 IBD-unclassified 6 20.06 (9.02–44.63) 6 9.89 (4.45–22.02) 2.03 (0.65–6.28) 0.221 Incident cases ≤18 yr of age on index datea Any immune-mediated GI disease 75 69.97 (55.68–87.93) 57 26.41 (20.30–34.37) 2.65 (1.88–3.73) <0.001 Crohn's disease 22 51.38 (33.76–78.21) 19 22.26 (14.16–34.98) 2.31 (1.26–4.23) 0.007 Celiac disease 34 118.01 (84.02–165.75) 27 45.89 (31.21–67.47) 2.57 (1.56–4.23) <0.001 Ulcerative colitis 10–14b 47.68 (28.23–80.52) 5–10b 12.07 (5.76–25.29) 3.95 (1.60–9.78) 0.003 IBD-unclassified ≤5b 87.37 (36.48–209.26) ≤5b 35.03 (13.17–93.22) 2.49 (0.67–9.26) 0.172 Incident cases >18 yr of age on index datea Any immune-mediated GI disease 38 10.00 (7.28–13.75) 48 6.42 (4.84–8.51) 1.56 (1.02–2.39) 0.041 Crohn's disease 13 10.11 (5.87–17.42) 13 5.14 (2.99–8.86) 1.97 (0.91–4.24) 0.085 Celiac disease 16 17.08 (10.47–27.87) 20 10.77 (6.95–16.68) 1.59 (0.82–3.06) 0.168 Ulcerative colitis 9 6.12 (3.19–11.76) 14 4.86 (2.88–8.20) 1.26 (0.55–2.91) 0.589CI, confidence interval; GI, gastrointestinal; IBD, inflammatory bowel disease; IRR, incidence rate ratio.
aCalculated by dividing the number of new diagnoses of an eating disorder by the total person-years-at-risk during the overall observation period and multiplying the result by 100,000.
bExact number not reported for reasons of confidentiality.
A similar pattern was observed for the hazard ratios (Table 3). The adjusted hazard ratios were generally similar for both sets of models, with the strongest point estimates observed for incident cases of ulcerative colitis among those ≤18 years of age. The proportional hazards assumption was met for all independent variables included in the models.
Table 3. - Unadjusted and adjusted hazard ratios for eating disorders among Ontario residents Crude HR (95% CI, P value) Adjusteda HR (95% CI, P value) Adjustedb HR (95% CI, P value) All cohort Any immune-mediated GI disease 1.99 (1.60–2.47, <0.001) 1.99 (1.60–2.47, <0.001) 1.98 (1.59–2.47, <0.001) Crohn's disease 1.80 (1.27–2.54, <0.001) 1.80 (1.27–2.54, <0.001) 1.76 (1.24–2.51, 0.002) Celiac disease 2.12 (1.44–3.11, <0.001) 2.12 (1.44–3.13, <0.001) 2.11 (1.41–3.16, <0.001) Ulcerative colitis 2.15 (1.41–3.29, <0.001) 2.16 (1.41–3.30, <0.001) 2.19 (1.42–3.35, <0.001) IBD-unclassified 2.02 (0.65–6.28, 0.225) 2.01 (0.64–6.33, 0.232) 1.91 (0.61–6.00, 0.269) Incident cases ≤18 yr of age on index date Any immune-mediated GI disease 2.62 (1.87–3.65, <0.001) 2.62 (1.88–3.67, <0.001) 2.62 (1.85–3.70, <0.001) Crohn's disease 2.30 (1.26–4.19, 0.006) 2.31 (1.26–4.21, 0.006) 2.17 (1.18–3.99, 0.013) Celiac disease 2.51 (1.55–4.07, <0.001) 2.52 (1.56–4.09, <0.001) 2.59 (1.55–4.32, <0.001) Ulcerative colitis 3.97 (1.60–9.83, 0.003) 3.97 (1.60–9.86, 0.003) 4.11 (1.64–10.31, 0.003) IBD-unclassified 2.49 (0.67–9.28, 0.174) 2.48 (0.64–9.57, 0.186) 2.33 (0.60–9.09, 0.225) Incident cases >18 yr of age on index datec Any immune-mediated GI disease 1.56 (1.02–2.40, 0.039) 1.57 (1.02–2.40, 0.039) 1.56 (1.02–2.40, 0.041) Crohn's disease 1.97 (0.91–4.26, 0.085) 1.97 (0.91–4.27, 0.086) 2.09 (0.94–4.65, 0.071) Celiac disease 1.59 (0.82–3.07, 0.167) 1.59 (0.82–3.08, 0.166) 1.52 (0.78–2.96, 0.217) Ulcerative colitis 1.27 (0.55–2.92, 0.581) 1.27 (0.55–2.93, 0.577) 1.24 (0.54–2.86, 0.618)CI, confidence interval; GI, gastrointestinal; HR, hazard ratio; IBD, inflammatory bowel disease.
aAdjusted for year of birth, sex, and local health integration network (on index date).
bAdjusted for year of birth, sex, local health integration network, deprivation quintile, and rural residence (on index date).
cNumber of outcomes for “unclassified IBD” too small to report meaningful results.
In general, this same pattern of findings was observed in the sensitivity analysis (see Supplementary Tables 2 and 3, Supplementary Digital Content 1, https://links.lww.com/CTG/B112), although the hazard ratios for Crohn's disease in the overall cohort were no longer significant. Similarly, any immune-mediated GI disease was no longer significantly associated with eating disorders in the adult population of incident cases.
Adjusted survival models that included an interaction term for exposure status and age (≤18 years and >18 years) were fit to determine whether the hazard ratios differed between the 2 age strata. A significant interaction was observed when all cases of immune-mediated GI disease (incident and prevalent) were included (Table 4). A similar effect was not seen when the analysis was restricted to incident cases (Table 4).
Table 4. - Significance of interaction terms for exposure status and age group in adjusted survival models Cohort GI disease type P value for interaction term (exposure status by age group)a All cases (prevalent and incident) Any immune-mediated GI disease 0.007 Crohn's disease 0.206 Ulcerative colitis 0.039 Unclassified <0.001 Celiac disease 0.239 All incident cases Any immune-mediated GI disease 0.074 Crohn's disease 0.902 Ulcerative colitis 0.069 Unclassified <0.001 Celiac disease 0.239GI, gastrointestinal.
aIndependent variables included in the model: exposure status, age group (≤18 vs >18 years), exposure status × age group (interaction term), birth year (continuous), sex, and local health integration network.
Previous studies have highlighted the increased risk of eating disorders in various autoimmune diseases (6,19,24) and the bidirectional relationship between these disorders (19); however, in this study, we examined the incidence rate and hazard ratio of developing an eating disorder in pediatric (≤18 years of age) and adult patients with major types of immune-mediated GI diseases using a large population-based health administrative data set. Overall, we observed an increased incidence of eating disorders in both pediatric and adult populations after a diagnosis of any immune-mediated GI diseases. These findings are consistent with other population-based national registry studies (6,19,24) and expand the existing evidence base by demonstrating an increased risk in pediatric incident cases of immune-mediated GI disease as compared to incident cases in adulthood.
National registry studies performed in Finland, Sweden, and Denmark have reported an increased risk of eating disorders in children with immune-mediated conditions (6,19,24). Research has shown that anorexia nervosa patients with autoimmune conditions produced antibodies against stress and appetite hormones (25). Treating these patients for their autoimmune conditions helped with recovery from eating disorders as well (25,26). Thus, it appears that increased support for GI disease can be part of an effective treatment of eating disorders (25–27). A study by Grigolon et al showed that dietary restraints are one of the main risk factors in the development of eating disorders in the general population (28), and this risk is particularly higher in children with chronic illness and GI disorders (2,28,29).
Although the precise underlying mechanism is unknown, it is possible that the appetite suppression and weight loss caused by proinflammatory cytokines found in autoimmune diseases and altered diversity of intestinal microbiota may contribute to this association (6,24).
The incidence rate of eating disorders was more than twice as high in children with any immune-mediated GI disease as compared to children with no immune-mediated GI disease. This was seen to a lesser extent in the adult population, where the incidence rate of eating disorders was 1.6 times higher for individuals with immune-mediated GI disease with borderline significance. It is noteworthy that among the pediatric incident cases of immune-mediated GI disease, each diagnosis (Crohn's, ulcerative colitis, and celiac disease) was associated with a significantly increased risk of eating disorders. By contrast, the hazard ratios for the individual diagnoses were not significant in the adult population.
The highest incidence rate and hazard ratios for the development of an eating disorder after a diagnosis of immune-mediated GI disease was for ulcerative colitis in the pediatric cohort. Pediatric-onset IBD diagnoses are increasing at an average of 1.23% per year in Canada, whereas the incidence of adult-onset IBD has become more stable (5). In addition, the pediatric IBD cases are known to have different presentations and complications compared with adults (30). This includes more extensive disease, higher risk of comorbidities related to growth and development, and exacerbation of mental health illness (5). Moreover, children with IBD have a more inflammatory phenotype (5), which may explain the more significant deve
留言 (0)