
記住我


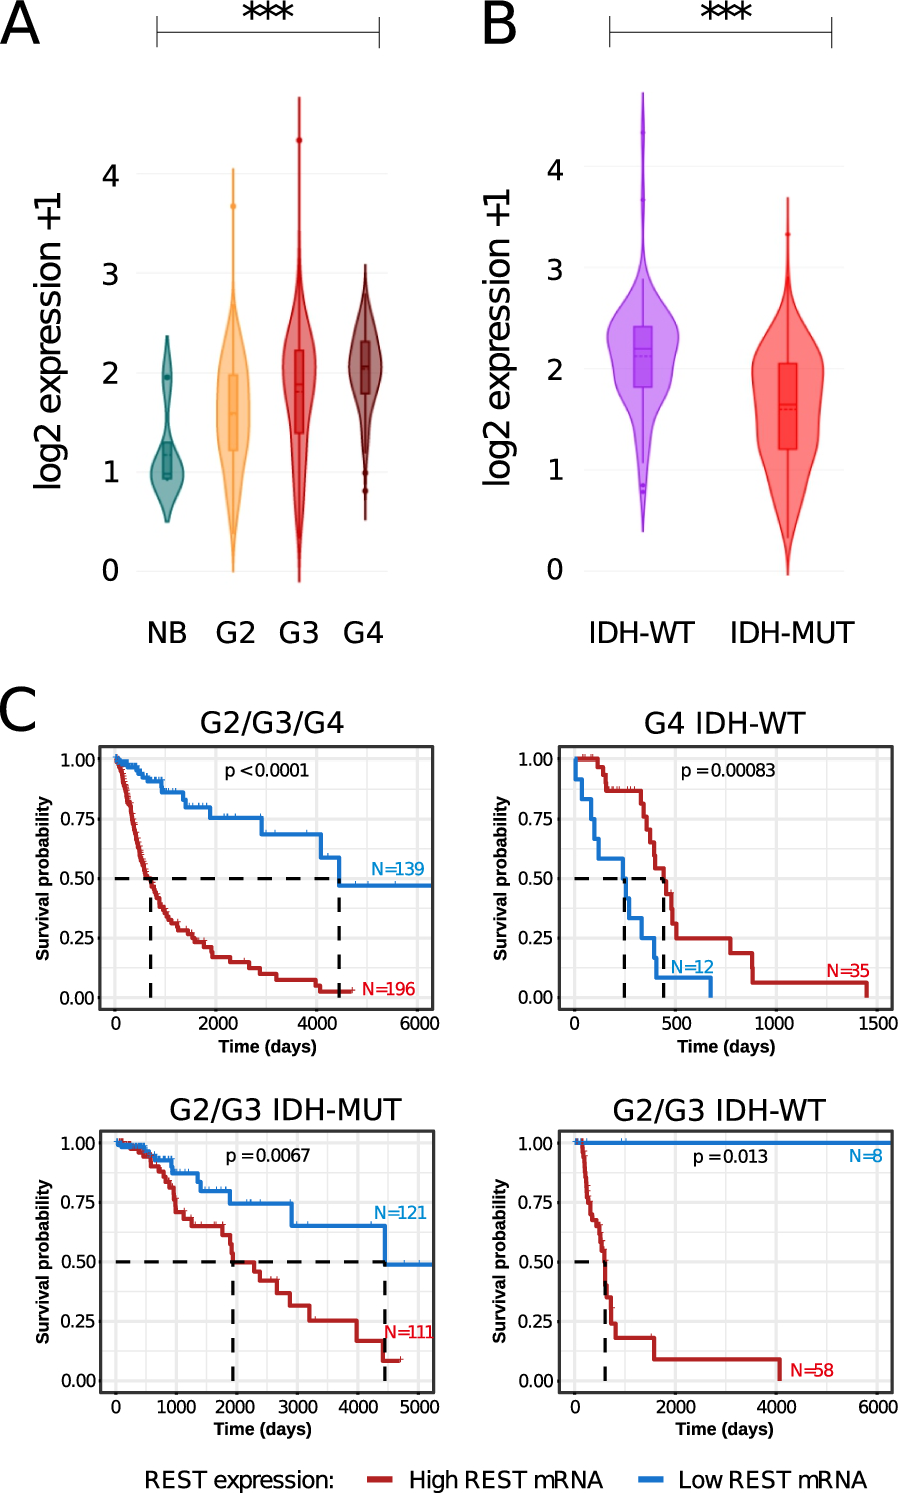
We analyzed REST expression in The Cancer Genome Atlas (TCGA) transcriptomic data encompassing normal brain (NB) tissues, LGG (Lower Grade Gliomas, WHO grades 2 and 3) and GBM (glioblastoma, WHO grade 4) samples. The expression of REST was the lowest in normal brain tissue and the highest in the WHO grade 4 gliomas, with REST expression increasing with glioma malignancy from G2, through G3 to G4 (Fig. 1A). The differences in REST expression between NB, G2, G3 and G4 were significant (adjusted p-value < 0.001). Interestingly, within the LGGs, REST expression was significantly higher in IDH1/2 mutated (IDH-MUT) gliomas than in wild type samples (IDH-WT) (Fig. 1B; two-sample Wilcoxon test).
Fig. 1
REST expression and survival analysis in the glioma TCGA dataset. A Violin plots showing expression of REST in a TCGA dataset across different glioma grades and normal brain. Significance of difference in gene expression was calculated with the Welch’s ANOVA test; ***p-value < 0.001. B Violin plot showing REST expression between IDH1 wild type and IDH1 mutants in G2/G3 gliomas. Statistical significance calculated with the two-sample Wilcoxon test; ***p-value < 0.001. C Kaplan–Meier overall survival curves for the patients with WHO grade 2, 3, and 4 gliomas (top left); IDH-WT G4 glioma (top right); IDH-MUT G2/G3 gliomas (bottom left); IDH-WT G2 and G3 gliomas (bottom right). The patients were divided into high or low REST expression groups. The patients alive at the time of the analysis were censored at the time of the last follow-up. Statistical significance was computed using the Log Rank Test
Next, we investigated whether REST expression had a prognostic value in glioma patients' survival. We found that REST expression is a strong negative prognostic factor for patient’s survival in all gliomas (LGG and G4 samples). Patients with low REST expression had a favorable prognosis (Fig. 1C, top left). Interestingly, patients with IDH-WT GBMs and high REST expression had longer survival (Fig. 1C top right), while patients with IDH-MUT LGGs (Fig. 1C, bottom left) and IDH-WT LGGs with high REST expression (Fig. 1C, bottom right) had shorter survival. However, the results of IDH-WT LGG must be taken with caution since the sample size was small due to a scarcity of these tumors.
Commonality of differentially expressed genes in human IDH-WT and IDH-MUT U87 cells and the TCGA datasetWe took advantage of having isogenic U87 glioma cells with different IDH1 status and analyzed transcriptomic profiles of U87 IDH-WT and U87 IDH-MUT glioma cells. Despite some controversies regarding the origin of the cells, their transcriptomic profiles are similar to glioblastoma [40]. We found significant differences in gene expression confirming transcriptomic deregulation (Additional File 1A, B). The REACTOME pathway analysis of differentially expressed genes (DEGs) between IDH-WT and IDH-MUT cells revealed a vast number of genes associated with extracellular matrix (ECM) and its reorganization (Additional File 1B).
Interestingly, DEGs downregulated in U87 IDH-MUT as compared to U87 IDH-WT were highly concordant with DEGs downregulated in IDH-MUT versus IDH-WT LGG tumors from TCGA (61% concordance, Fig. 2A). As none of the bootstrapped results returned such a high concordance, it is unlikely to be random. The overlap of upregulated genes between glioma cells and TCGA tumors was smaller (38%), less than the median overlap (48%) returned by bootstrapping. Also, the REACTOME pathways for DEGs were similar for the downregulated and dissimilar for the upregulated genes (Additional file 1C, D).
Fig. 2
Effects of REST knockdown on gene expression in IDH-WT and IDH-MUT U87 cells. A Sorted values of log2 fold change (log2 FC) for DEGs in the IDH-MUT vs IDH-WT comparison in U87 cells are presented as red dots. Values for the same genes inferred from the IDH-MUT vs IDH-WT comparison in TCGA G2/G3 gliomas are overlaid as gray dots. Percentage of log2 FC direction concordance between IDH-MUT vs IDH-WT in U87 cells and glioma tumors was calculated. A number of DEGs is indicated. Black vertical line separates genes with higher expression in IDH-MUT U87 versus IDH-WT U87 from the genes with higher expression in IDH-WT U87 versus IDH-MUT U87. B Relative expression of REST in IDH-WT and IDH-MUT U87 cells at 72 h of REST silencing with siRNA. mRNA levels in transfected cells were determined with quantitative PCR and normalized to GAPDH expression in the same sample. Data are represented as mean ± SEM, n = 4 independent experiments, *p < 0.05, two-tailed Mann–Whitney test (WT: p = 0.0286; MUT: p = 0.0286). C Levels of REST protein in IDH-WT and IDH-MUT U87 cells at 72 h after transfection with control or REST specific siRNAs determined with Western blotting. Immunoblots were analyzed by densitometry. Data are represented as mean ± SEM, n = 4. **p < 0.01 (WT: p = 0.0018, MUT: p = 0.0052; two-tailed ratio-paired t-test). No difference was observed in the level of REST protein between IDH-MUT and IDH-WT controls (siCTRL) (p = 0.226). D Volcano plots of the genes differentially expressed between siCTRL and siREST-transfected IDH-WT (upper plot) or IDH-MUT (bottom plot) U87 glioma cells. The axes show log2 fold change (x-axis) and -log10 from adjusted q-value (y-axis). E Gene Ontology (GO) Biological Processes (BP) analysis was performed on DEGs common in IDH-WT and IDH-MUT U87 cells. The results are presented as bar plots for pathways upregulated (upper panel) and downregulated (bottom panel) in REST depleted cells
REST knockdown in U87 glioma cells affects numerous biological processesTo find REST dependent genes in glioma cells with different IDH1 status, we performed siRNA mediated knockdown of REST (siREST) in IDH-WT and IDH-MUT U87 glioma cells. A significant reduction in REST mRNA (Fig. 2B) and protein (Fig. 2C) levels was observed after 72 h of REST silencing in both U87 cell lines. REST mRNA levels were reduced by 77% in IDH-MUT, and by 82% in IDH-WT (Fig. 2B), while REST protein levels were reduced by 89% in IDH-MUT and by 90% in IDH-WT as compared to control siRNA (siCTRL) transfected cells (Fig. 2C).
We compared transcriptomic profiles between siREST and siCTRL cells and identified 1,234 DEGs in IDH-WT and 629 in IDH-MUT (Fig. 2D). Out of these, 507 were common for IDH-WT and IDH-MUT. The majority of the common DEGs were upregulated (n = 287), whereas 220 DEGs were downregulated, including REST, which had the highest log2 fold change (log2 FC) (Fig. 2D). The Gene Ontology Biological Processes (GO BP) functional analysis was performed independently for the up- and downregulated DEGs in siREST cells. The downregulated DEGs were enriched in cell division-related pathways (Fig. 2E, bottom panel), whereas the upregulated genes were enriched in neuronal-specific pathways, as well as pathways associated to endothelial cell proliferation and ECM organization (Fig. 2E, upper panel).
Since the analysis of DEGs in not treated IDH-WT vs IDH-MUT U87 cells and TCGA LGG tumors also indicated ECM-related pathways as differentially regulated, we tested if REST could be a potential modulator of these pathways depending on the IDH status (Additional File 1BC).
Regulation of gene expression by REST is modified by the IDH1 mutationTo evaluate an impact of REST on gene regulation in the context of IDH1 mutation, we performed three pairwise comparisons of transcriptomic profiles of IDH-WT and IDH-MUT U87 cells. Differential analysis between IDH-WT vs IDH-MUT was performed on RNA-seq data from the untreated, siCTRL- and siREST-transfected U87 IDH-WT and IDH-MUT cells. DEGs identified in these comparisons were intersected (Fig. 3A) to pinpoint silencing-specific effects. We discovered common 2,943 DEGs (Fig. 3A) showing a strong influence of the IDH-related phenotype on gene expression. To investigate the effect of REST knockdown on IDH-phenotype dependent genes, we focused on genes significantly altered in siREST cells (n = 6,626) (Fig. 3A, delimited in a gray circle) and compared DEGs fold changes in control and siREST cells. DEGs with similar fold changes in siREST and siCTRL comparisons were considered REST independent (Fig. 3B). We defined DEGs as increased DEGs (iDEGs) when they had log2 FC difference between siREST and siCTRL above 0.25 and decreased DEGs (dDEGs) as those that had log2 FC lower than -0.25 (Fig. 3C).
Fig. 3
REST knockdown differentially affects expression of genes involved in ECM organization and glial cell differentiation in IDH-WT and IDH-MUT U87 glioma cells. A Venn diagram showing the overlap of genes differentially expressed between IDH-WT vs IDH-MUT (IDH-DEGs) in untreated, siREST or siCTRL-transfected U87 glioma cells. Grey circle marks DEGs in the siREST-transfected cells. B Subsets of IDH-DEGs dependent (increased FC, red; decreased FC, green) or independent (gray) on REST silencing. C Comparison of the fold change difference in gene expression in IDH-MUT or IDH-WT, following siREST/siCTRL transfection. In siREST-transfected cells, a group of DEGs showed a shift in log2 fold change (log2 FC) between IDH-MUT and IDH-WT in siREST compared to siCTRL-transfected cells. Shift of IDH-MUT vs IDH-WT log2 FC in siREST transfected cells when compared to siCTRL transfected cells was either up (green, increased DEGs, iDEGs) or down (red, decreased DEGs, dDEGs). Difference in log2 FC was assumed significant when log2 FC shift between IDH-MUT and IDH-WT comparisons in siREST and siCTRL was > 0.25 and adjusted p-value < 0.05. D Gene Ontology Biological Processes (GO BP) pathways analysis of the iDEGs, showing genes associated with ECM organization and negative neuronal differentiation. E Gene Ontology Biological Processes (GO BP) pathways analysis of the dDEGs, showing genes associated with glial differentiation and immune/endocrine pathways. F Graphical summary showing the opposite effect of REST knockdown in IDH-WT and IDH-MUT on the expression of genes related to ECM organization and cell differentiation
The GO BP pathway analysis demonstrated that iDEGs showed the enrichment in genes involved in ECM organization and negative regulation of neuron differentiation (Fig. 3D). Within these pathways, the highest log2 FC increase was observed in several genes encoding integrins (ITGAD) and metalloproteinases (MMP10). In contrast, the enrichment for dDEGs showed genes related to reproductive, developmental, and glial differentiation pathways and positive regulation of leukocyte activation (Fig. 3E). Increased expression of genes related to ECM in IDH-MUT siREST cells and their decreased expression in siREST IDH-WT cells, contrasted with decreased expression of glial differentiation-related genes in IDH-MUT siREST cells and their increased expression in IDH-WT siREST cells (Fig. 3F). These findings point to a potential role of REST in a switch between ECM organization and cell differentiation in cells with the different IDH status.
To corroborate these observations, the transcriptomes of G4 primary glioma cell lines were analyzed [30]. Comparison between IDH-MUT (2 astrocytomas G4) and IDH-WT (10 GBMs G4) samples revealed DEGs, which show a considerable overlap with the U87 DEGs dependent on the IDH status only among downregulated genes (Additional File 2A). We demonstrate downregulated ECM-related DEGs from the Fig. 3D in IDH-MUT vs IDH-WT in U87 cells (Additional File 2B) and primary IDH-MUT vs IDH-WT G4 gliomas (Additional File 2C). Out of 18 downregulated ECM-related DEGs in U87 cells 13 genes were similarly regulated in primary cell lines (Additional File 2C), and there is only 1.2% probability of obtaining such a high overlap by chance (bootstrapping procedure, Additional File 2D).
Invasiveness and expression of genes associated with ECM in REST depleted U87 glioma cells depend on the IDH-related phenotypeThe enrichment of biological pathways related to ECM organization and cell differentiation found in REST depleted glioma (genes listed in Fig. 4A), led us to study invasiveness and viability of the cells. Viability of both IDH-WT and IDH-MUT U87 glioma cells was not significantly affected by REST knockdown post-transfection as measured with the PrestoBlue assay (Fig. 4B). The invasion of REST depleted U87 IDH-WT cells, quantified with a Matrigel assay, increased by 75% compared to control cells (Fig. 4C, migrating cells: siCTRL: 908.8 ± SEM = 460; siREST: 1597 ± SEM = 622.3). The opposite, but not statistically significant trend, was observed in U87 IDH-MUT. Invasion of the untreated cells was strongly influenced by their IDH mutation status (Fig. 4C, migrating cells IDH-MUT: 3472 ± SEM = 324.7; IDH-WT: 1019 ± SEM = 490.6).
Fig. 4
REST knockdown affects invasion of glioma cells and expression of genes implicated in cell migration/invasion. A Extracellular matrix organization GO BP-related IDH-DEGs modulated by siREST (selected from functional analysis from Fig. 3C) presented as a heatmap for IDH-WT (left panel) and IDH-MUT (right panel) siREST (right column in each panel) vs. siCTRL (left column in each panel) U87 glioma cell lines. B Bright field microscopy images of IDH-WT and IDH-MUT U87 cells 24-, 48- and 72 h after siRNA transfection; scale bar = 200 µm. Cell viability after 24-, 48- or 72 h of REST silencing measured with a PrestoBlue assay. Data are represented as mean ± SEM, n = 3, Wilcoxon matched-pairs signed rank test, two-tailed (p > 0.05). Dotted line at 100% denotes a viability of mock-transfected cells. C Invasiveness of IDH-WT and IDH-MUT U87 cells measured with a Matrigel invasion assay. The cells were either not treated (nt) or transfected with siCTRL or siREST. The fluorescence microscopy images (scale bar = 200 µm) show representative fields of Matrigel inserts and the bar plot shows quantification of the migrating cells. Data are presented as mean ± SEM, n = 6, *p < 0.05, Wilcoxon matched-pairs signed rank test. IDH-WT siCTRL: 908.8 ± SEM = 460; IDH-WT siREST: 1597 ± SEM = 622.3; not treated IDH-MUT: 3472 ± SEM = 324.7; not treated IDH-WT: 1019 ± SEM = 490.6; p = 0.0313. D Hierarchical clustering based on mean DNA methylation level within promoters (TSS -2000/ + 500 bps) of ECM genes whose DNA methylation was significantly different (FDR < 0.05) between IDH-MUT and G2/G3 IDH-WT tumor samples deposited in glioma Atlas. E Description as in (D) but for genes with significantly differential DNA methylation in gene bodies
DEGs whose fold change between U87 IDH-MUT and U87 IDH-WT was increased by REST (iDEGs, Fig. 3D) included a group of genes implicated in the ECM organization pathway (Fig. 4A). To validate if these genes depend on REST, their expression was correlated with REST expression in the TCGA glioma dataset (G2/G4). The majority of them significantly correlated with REST either in G4 (Additional File 3, left panel), LGG IDH-MUT (Additional File 3, middle panel) or in LGG IDH-WT (Additional File 3, right panel), supporting the notion that REST is required to regulate ECM-related gene expression, but its targets may differ depending on the IDH status. Finally, using tumor methylome data of IDH-WT and IDH-MUT gliomas from the glioma Atlas [27], we found that 16 out of the 32 identified ECM related genes had significantly differential DNA methylation in gene promoters (Fig. 4D) and 11 within gene bodies (Fig. 4E).
DNA methylation at REST ChIP-seq peaks in REST depleted IDH-WT and IDH-MUT U87 cellsREST knockdown had a modest effect on DNA methylation in the U87 cells for a limited number of cytosines within REST ChIP-seq peaks. Out of 308,816 cytosines tested, there was no difference between IDH-WT siREST and siCTRL samples for over 99% of loci. For 79 loci β-values were lower in IDH-WT siREST than siCTRL (Additional File 4A, values lower than zero) and for 96 were higher (Additional File 4A, values above zero). The largest difference of β-value was 0.08 (Additional File 4A). Similarly, for IDH-MUT, out of 317,501 loci tested, the lower β-values in siREST than siCTRL samples were found in 54 loci and in 81 loci were higher. Here, the highest difference between IDH-MUT siREST and siCTRL β-values was 0.09 (Additional File 4B). Moreover, among differential cytosines, having a difference in DNA methylation β-value > = 0.15 between DH-WT and IDH-MUT, the pattern of computed differences between IDH-WT and IDH-MUT was fairly constant regardless of REST knockdown (Additional File 4C—comparison of IDH-WT and IDH-MUT transfected with siCTRL; Additional File 4D comparison of IDH-WT and IDH-MUT transfected with siREST). Out of all cytosines (n = 833) assigned as highly methylated in IDH-MUT, only one did not match between siREST and siCTRL samples, while in cytosines lower methylated in IDH-MUT (n = 746) only two did not match between siREST and siCTRL. The observed differences between IDH-MUT and IDH-WT for siCTRL and siREST samples were almost symmetrical (Additional File 4E), suggesting a similar effect of REST knockdown in U87 cells regardless of their IDH mutation status.
We discovered that it is more likely that the differential cytosines (difference in DNA methylation β-value > = 0.15) will appear in IDH-MUT specific or common REST peaks than in IDH-WT specific peaks (Chi2 test p < 0.001; see the next chapter for details on peak categorization). Similarly, higher or lower methylation was found more frequently in IDH-MUT specific and common peaks than in IDH-WT peaks (Additional File 4E). Finally, we documented that proportionally to the background, the highest enrichment of differentially methylated cytosines within REST ChIP-seq peaks was found in IDH-MUT specific ones (Additional File 4F).
Characterization of REST ChIP-seq peaks in IDH-WT and IDH-MUT U87 cellsChIP-seq was employed to identify REST binding sites in U87 glioma cells. The analysis revealed almost four thousand REST ChIP-seq peaks out of which 2,647 were common in IDH-WT and IDH-MUT cells, while 114 were specific to IDH-MUT and 1,077 to IDH-WT cells. REST ChIP-seq peaks were annotated to genes (hereafter referred to as REST targets). Consistently, the majority of REST targets were shared between IDH-WT and IDH-MUT cells (n = 1674), but 85 genes were specific to IDH-MUT and 860 IDH-WT cells (Fig. 5A). Most of the IDH-MUT specific peaks were located in the intergenic or intronic regions, while the IDH-WT were located mainly in gene promoter regions (Fig. 5B). The lower number of binding sites identified in IDH-MUT (Fig. 5A) and more distal IDH-MUT specific binding sites localization from the transcription start site (Fig. 5B) indicate that the role of REST in IDH-MUT is different than in IDH-WT.
Fig. 5
Genes affected by REST knockdown and having REST ChIP-seq peaks belong to migration and differentiation pathways. A Intersection of genes assigned to REST ChIP-seq peaks in IDH-WT and IDH-MUT U87 cells. Peaks were assigned to genes following the R ChIPseeker library assignment to the promoter region. B Annotation of identified REST ChIP-seq peaks to genomic regions. C Upper panel: top GO BP pathways upregulated in primary repressed REST targets were related to calcium release exocytosis, signal release and encephalon glial migration pathways. Lower panel: Main GO BP pathways downregulated in primary activated REST targets were related to: NAD biosynthetic process, hematopoietic progenitor cell differentiation and regulation of mRNA splicing pathways. D Expression of genes upregulated in REST depleted cells was correlated with cellular states in single-cell RNAseq data [26]. Pearson correlation was calculated, and a color key scale was used to present its values in range from -1 to 1, correlation significance was marked (*) when adjusted p < 0.05. E Genomic view from the Integrative Genome Viewer on genes upregulated in REST depleted cells and gliomas; for each sample a histogram of reads was normalized to the input reads (bigwigg file) and bed file from ChIP-seq experiment is shown. REST ChIP-seq data on four U87 glioma cell repetitions (2 × IDH-MUT and 2 × IDH-WT) and 4 tumor samples (1 × IDH-MUT and 3 × IDH-WT) are shown. IDH-MUT samples are color-coded in purple and IDH-WT in red
The REACTOME pathway analysis of genes annotated to REST peaks indicated the gene enrichment in ten pathways common to IDH-WT/MUT and eleven pathways specific to either IDH-WT or IDH-MUT REST targets (Additional File 5A). Ten of these pathways were specific to IDH-WT, and they were related to transcription, translation, nonsense mediated decay, voltage gated potassium channels, infectious disease, and heat shock factor 1 activation. The only pathway significantly enriched in targets specific to IDH-MUT was “Interaction between L1 and ankyrins” (Additional File 5A).
Next, we analyzed potential TFs binding within sequences of REST ChIP-seq peaks assigned to genes specific to IDH-WT (n = 860), IDH-MUT (n = 85), or common to both cell types (n = 1,674) (Fig. 5A). Using EnrichR, we found that ENCODE ChIP-seq peaks of KAISO, known also as ZBTB33 (Zinc Finger and BTB Domain Containing 33), had the strongest enrichment within the REST ChIP-seq peaks specific for IDH-WT cells (Additional File 5C, middle panel). Contrary, in IDH-MUT specific REST ChIP-seq peaks, only ENCODE REST peaks were identified (Additional File 5C, middle panel), while in the REST ChIPseq peaks common to IDH-WT and IDH-MUT, both ENCODE REST and ENCODE KAISO peaks were enriched (Additional File 5C, top panel).
To identify specific TF motifs, present within the REST ChIP-seq peaks specific for IDH-WT or IDH-MUT, or common for both IDH-WT and IDH-MUT, we investigated the peak sequences using all available position weighted matrices (PWMs) deposited in the HOmo sapiens COmprehensive MOdel COllection (HOCOMOCO) database (version 11) and additional 14 REST PWMs from the ENCODE dataset. Using the R PWMEnrich package and the FIMO tool [39], we identified 120 distinct TF motifs within the REST ChIP-seq peaks common to IDH-WT and IDH-MUT, 70 motifs in IDH-WT specific peaks and 14 motifs within the IDH-MUT specific peaks (Additional File 5B). Ten motifs were shared among the three peak types (Additional File 5B). Focusing on KAISO motifs, we discovered that all the three HOCOMOCO motif variants (0.A, 1.A and 2.A) were present within the common and the IDH-WT specific REST ChIP-seq peaks, but none of these motifs were present in the IDH-MUT specific peaks (Additional File 5D).
Finally, we hypothesized that changes in DNA methylation resulting from an IDH status may affect REST binding to its target sites. Therefore, we examined DNA methylation β-values in IDH-MUT, G2/G3 IDH-WT and G4 IDH-WT glioma Atlas samples [27]. Pairwise comparisons of DNA methylation within the sequences assigned as common, IDH-WT or IDH-MUT specific based on REST ChiP-seq peaks in U87 cells were performed separately for different glioma groups (Additional File 6A-C). A similar percentage of common (8%), IDH-WT (6.9%) and IDH-MUT specific (5.5%) peaks was differentially methylated between the three aforementioned glioma tumor groups. In each REST peak type (common, WT-specific, MUT-specific), the largest number of differentially methylated peaks was detected between IDH-MUT and G4 IDH-WT samples (n = 197, 6, 71, respectively; Additional File 6A-C, a middle column). Next, to identify the effect of IDH-related phenotype, we focused on the peaks differentially methylated between G2/G3 IDH-WT and IDH-MUT samples (128 common, 4 WT-specific, 32 MUT-specific; Additional File 6A-C, a left column). Majority of these peaks (n = 135; 82.3%) had higher DNA methylation in IDH-MUT samples (Additional File 6D-F), confirming that the IDH status has a dominant impact on differential DNA methylation of the REST peaks.
REST-regulated genes in glioma cells belong to cell migration and differentiation pathwaysREST knockdown may affect genes that are activated or repressed by REST binding either directly (hereafter referred to as primary REST targets) or indirectly. REST knockdown may also have indirect effects related to altered interactions between REST and other proteins and/or downstream regulatory cascades controlled by primary REST targets (hereafter REST secondary targets). The genes whose expression was significantly changed after REST knockdown and had REST ChIP-seq peaks, were assigned as primary REST targets. GO Biological Pathways enriched among primary repressed REST targets (upregulated after siREST) comprised pathways related to neuronal transmission (signal release, calcium regulated exocytosis) and glial cell migration (Fig. 5C, an upper panel). The pathways related to primary activated REST targets (downregulated after siREST) included NAD biosynthetic process, regulation of mRNA splicing and hematopoietic progenitor cell differentiation (Fig. 5C, a lower panel).
Further, a correlation of REST and its primary targets’ expression was calculated in the TCGA dataset. The direction and strength of the correlations were compared to the direction of DEGs expression fold change after siREST. Majority of the primary repressed REST targets were enriched in the signal release, calcium regulated exocytosis and telencephalon glial cell migration biological pathways (Fig. 5C), and had negative correlation with REST expression in G4 TCGA dataset (Additional File 7A). Nearly half of the primary activated REST targets related to NAD biosynthetic process, regulation of mRNA splicing and hematopoietic progenitor cell differentiation (Fig. 5C), had positive correlation with REST expression in G4 TCGA dataset (Additional File 7B). Additionally, most of the primary repressed REST targets were consistently downregulated in gliomas compared to normal brain samples, with expression decreasing from G2 and G3 to G4 (Additional File 7C). Primary activated REST targets did not show this pattern in TCGA gliomas (not shown). A number of primary repressed REST targets correlated significantly with glioma cellular states described by [26] (Fig. 5D). Among those, many primary repressed REST targets showed significant positive correlation with NPC-like states and negative correlation with G1S and G2M states, suggesting rather non-cycling cells (Fig. 5D). Contrary to the primary activated REST targets (not shown), the primary repressed REST targets showed concordance of their REST binding sites with those detected in glioma tumors (Fig. 5E).
Occurrence of TF motifs within the REST ChIP-seq peaks among REST-activated or REST-repressed genesMost REST-repressed genes were enriched in the GO biological pathways related to neuronal functions, confirming its canonical role as a repressor of neuronal genes in non-neuronal cells (Additional File 8A, left panel). On the other hand, pathways related to the REST-activated targets were more diverse (Additional File 8A, right panel).
To determine the exact locations of the TF motifs detected with PWMEnrich in peaks associated with REST-activated and REST-repressed genes, we used the FIMO tool and identified 145 motifs for 119 TFs within the REST peaks assigned to REST-repressed genes and 140 motifs for 115 TFs within the peaks assigned to REST-activated genes (q-value ≤ 0.05). Hierarchical clustering tree of the identified TF motif PWMs revealed well pronounced separation of motifs assigned to the REST-repressed and REST-activated targets (Additional File 8B). The same tree, exhibiting TF motifs sequence similarities, was used to visualize protein families of TFs detected within REST peaks paired with REST-activated or repressed genes (Fig. 6C). The motifs identified in both REST-repressed and activated targets included E2F transcription factor family motifs, which is a classic TF involved in glioma progression [41, 42].
Fig. 6
Characterization of REST ChIP-seq peaks and their target genes. A and B Ranking of the TOP 20 TF motifs identified in the sequences of the REST ChIP-seq peaks assigned to genes repressed by REST (A) or activated by REST (B). Briefly, REST expression was correlated with the genes to which REST ChIP-seq peaks were assigned using TCGA dataset (data from Fig. 5A). Based on the correlation results between REST gene expression and REST targets, the genes were divided into repressed or activated by REST. If correlation was statistically significant (adjusted p value < 0.05) and correlation coefficient was positive, a gene was assigned as activated by REST, while coefficient was negative, a gene was assigned as repressed by REST. C Hierarchical tree of TF motifs for enriched TF families based on PWMs. Shades of green represent motifs from TF protein families overrepresented in REST ChIP-seq peaks unique for repressed REST targets; orange-activated; magenta-motifs overrepresented in the group of motifs present in both repressed and activated REST targets. D REST and KAISO (ZBTB33) motifs clustering based on PWMs. E Hierarchical clustering of REST peaks according to the identified KAISO and REST motifs. Color-coded bars show the association of a REST peak and its target gene, impact on gene expression (repressed or activated by REST) and the presence of REST and/or KAISO motifs. F Q-value and frequency relations for selected KAISO (ZBTB33) and REST motifs within REST-ChIP-seq peaks assigned to genes activated or repressed by REST. To highlight the pattern, bar plots show the full distribution of q-values with a red dashed line indicating significance cut-off point
Among the motifs enriched in REST ChIP-seq peaks of REST-repressed genes, were targets for ASCL1, MyoD and E2A-related factors that are engaged in cell differentiation and proliferation, including neuronal (ASCL1) and oligodendrocyte (E2A) differentiation [43], mesenchymal cell proliferation (MyoD) and growth inhibition [44]. In cancer, these TFs act as activators (ASCL1) or inhibitors of the cell cycle progression (E2A) [45]. Motifs overrepresented in REST-activated genes were targets for CREB, Ets family proteins, bHLH-ZIP, and Hairy-related factors. Among others, CREB regulates transcription of the genes coding for a proto-oncogene c-Fos [46] and neuropeptide VGF [47]. The latter was one of the stronger upregulated genes upon REST knockdown (Fig. 2D). Ets family proteins are activated by Ras-MAP kinase signaling pathway and have been implicated in tissue differentiation and cancer progression [48]. Hairy-related proteins typically function as DNA-binding transcriptional repressors that have been shown to inhibit Notch activated a-actin [49] and control differentiation [50]. Overrepresentation of the motifs for these TFs in the vicinity of REST binding sites in REST-repressed genes shows a potential contribution of their pathways to the diverse REST effects and its impact on tumorigenesis and patient survival.
To identify the most prevalent TF motifs within the REST peaks associated with REST-activated or REST-repressed genes, we performed TF motif scans using PWMs. The top of the ranking of the highest scoring motifs for the REST-repressed genes contained mainly REST motifs, as expected (Fig. 6A). However, in the ranking of TF motifs in REST-activated genes, the first three positions were occupied by KAISO (Fig. 6B). TF binding motif sequence logos generated for both KAISO and REST PWMs (Additional File 8F, G) and hierarchical clustering of all discovered PWM sequences (Fig. 6C) as well as REST and KAISO PWMs alone (Fig. 6D) showed dissimilarity between these motifs, hence their co-occurrence within the REST ChIP-seq peaks was not due to the PWMs similarity. However, based on the distribution of the statisti
留言 (0)