
記住我

Our cohort comprises 16 melanoma patients that all developed an intra- and an extracranial metastasis during the course of their disease (Table 1). The corresponding metastasis transcriptomes of seven patients were taken from [21] including all patients for which patient-matched transcriptomes of intra- and extracranial melanoma metastasis samples were available. In addition, the transcriptomes of metastasis pairs of nine additional patients were newly sequenced for this study. The extracranial metastases of four patients (P04, P08, P18, P42, Table 1) contained histologically distinct regions. The transcriptomes of these distinct regions from the same metastasis sample were included as separate patient-specific extracranial samples to enable the analysis of molecular differences between the potential subclones within a metastasis and in relation to their patient-matched intracranial metastasis. Further, the majority of patients (9 of 16) were not treated before metastasis resection, five of the seven pre-treated patients were neither treated with BRAF/MEK nor with immune checkpoint inhibitors, and two patients received targeted therapies (Additional file 18: Table S13). Additional file 18: Table S13 also contains the mutation status of BRAF and NRAS of the individual metastases, the sex of the patients, and the age of the patients at the time when the intracranial metastasis was resected.
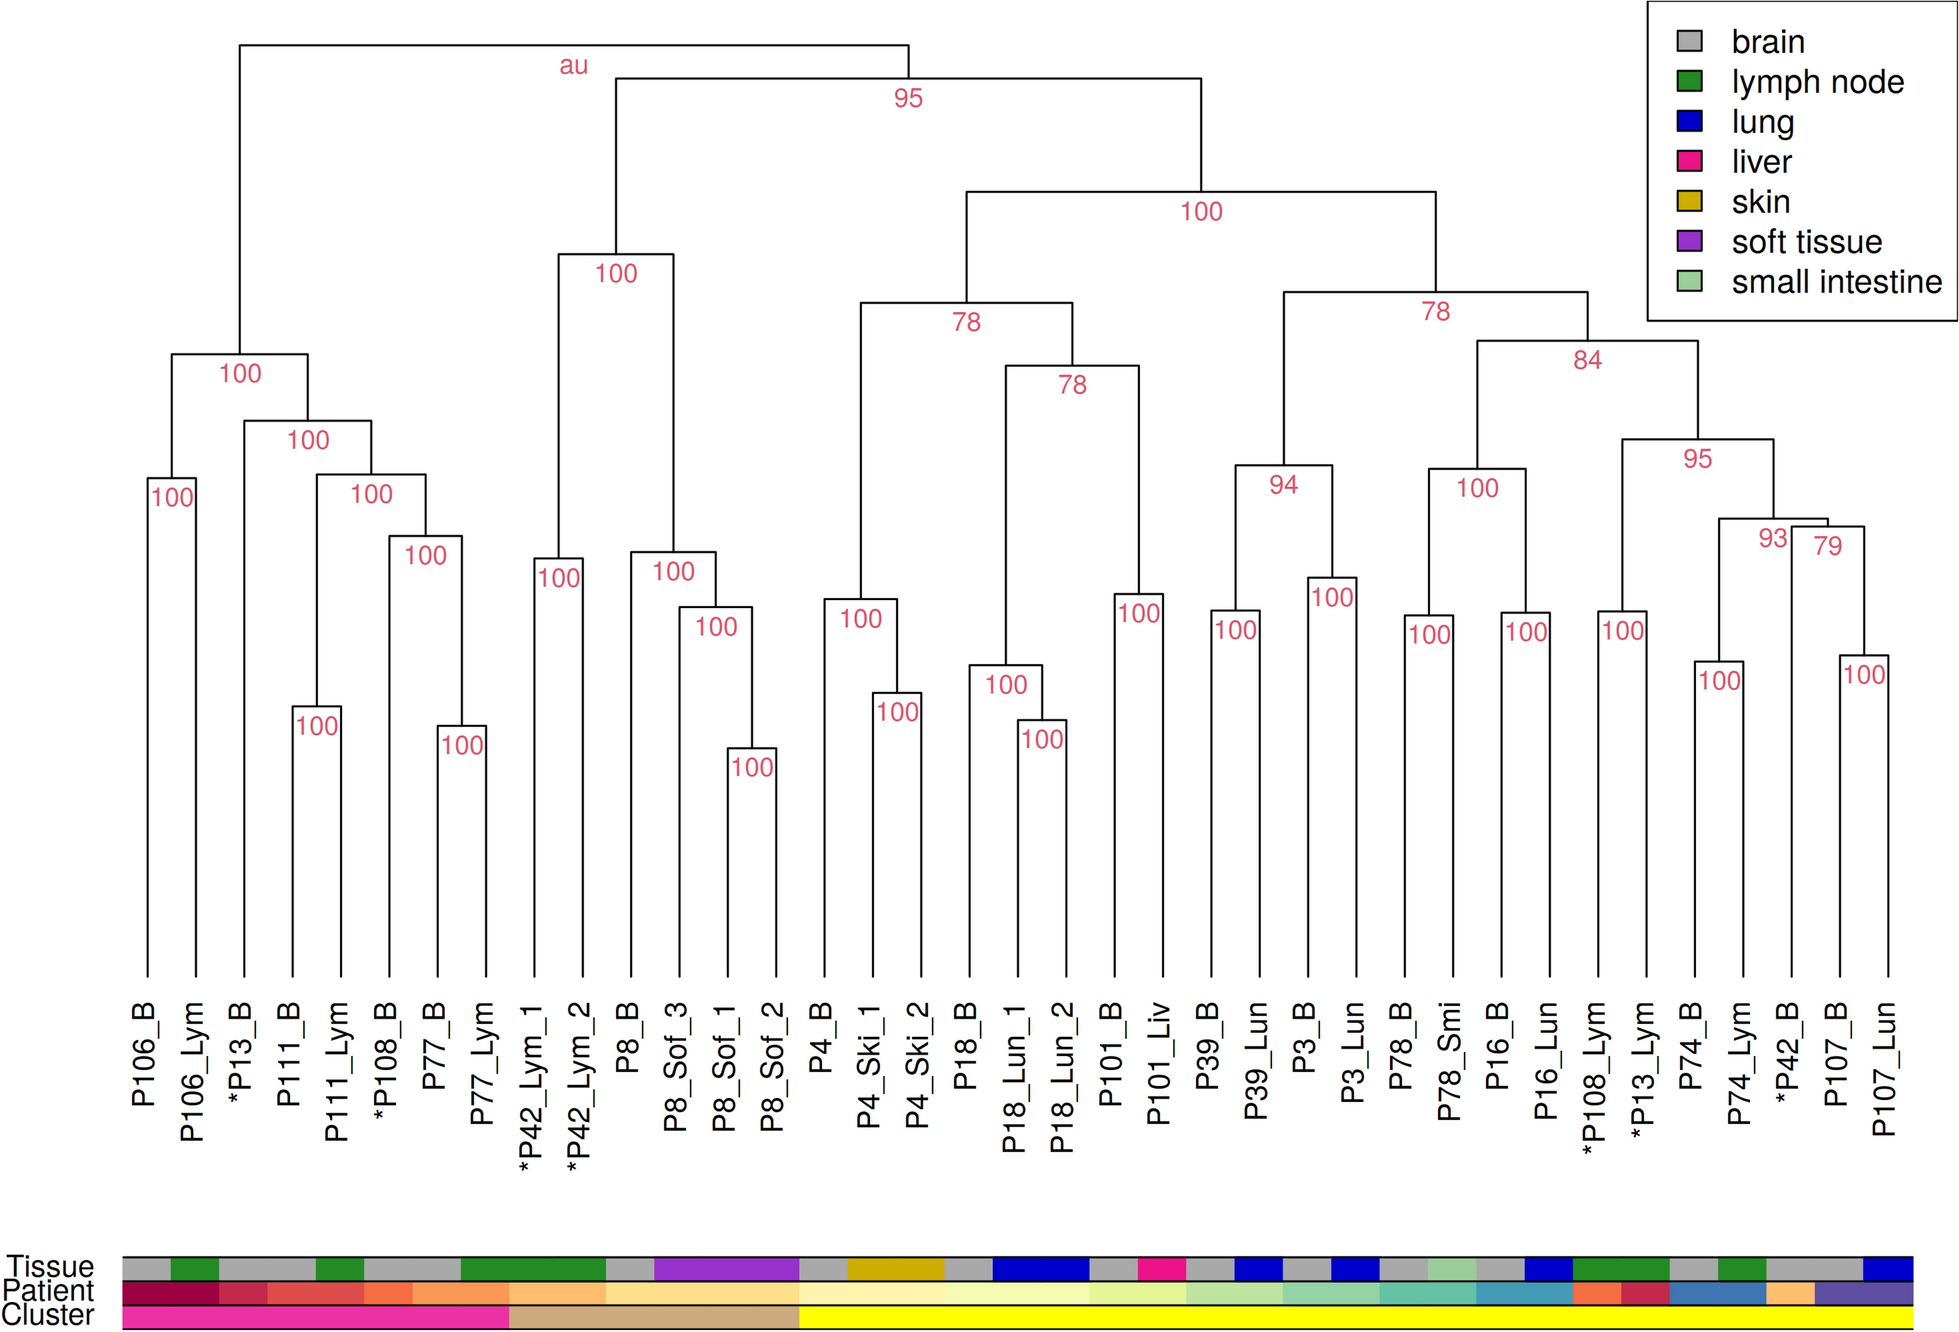
First, it was reassured that the analyzed melanoma metastases had high tumor content. This was done by performing a hierarchical clustering of all initially profiled metastasis samples in a joint analysis together with transcriptomes of normal samples of different tissues comprising brain, lymph node, lung, soft tissue and skin (Additional file 1: Figure S1). The metastases and the normal tissues formed separate disjoint clusters, except for one lymph node metastasis sample of patient P06 that co-clustered together with the normal tissues. Therefore, this patient was excluded from the study.
Next, a hierarchical clustering of the transcriptomes of all remaining metastases was performed in combination with a cluster stability analysis to characterize global similarities and differences between all individual metastases (Fig. 1). This hierarchical clustering showed three main subclusters, which were completely stable (AU value = 100). The left subcluster (pink bar) only comprises intracranial and lymph node metastases. The middle cluster (brown bar) includes all samples from P08 and lymph node metastasis samples from P42. Further, it is important to note that P08 was the only patient that had a soft tissue metastasis. There were no associations with available patient meta-information that explained the observed co-clustering of metastasis samples of P08 and P42. The right subcluster (yellow bar) comprises metastases from six of seven extracranial tissue types (all except soft tissue).
In addition, the clustering also showed that intra- and extracranial metastases from the same patient were more similar to each other than to metastases in the same tissue from other patients. All observed patient-specific subclusters of intra- and extracranial metastasis pairs were fully stable (Fig. 1, AU value = 100). In more detail, for 13 of 16 patients, the corresponding intra- and extracranial metastases all formed completely stable patient-specific subclusters that represented patient-matched metastases co-clustered together (Fig. 1). For the other three patients, their intra- and extracranial metastases did not directly cluster together: P13 (brain and lymph node metastases), P108 (brain and lymph node metastases), and P42 (brain and lymph node metastases). Despite the fact that these three patients all developed a lymph node metastases, this observation cannot be generalized for all lymph node metastases in the cohort. The other four patients that developed a lymph node metastasis formed completely stable patient-specific subclusters that contained the corresponding intracranial metastasis co-clustered together with the patient-matched lymph node metastasis (P106, P111, P77, P74; Fig. 1).
Generally, such a patient-specific co-clustering of melanoma metastases has also been observed in closely related studies with gene expression or DNA-methylation data of patient-matched intra- and extracranial melanoma metastasis pairs [25, 26]. This observation motivates the necessity for a personalized analysis of the patient-matched metastasis pairs, which is performed subsequently.
Table 1 Melanoma metastasis patient and sample overviewFig. 1
Hierarchical clustering of transcriptomes of all patient-matched melanoma metastases. Each patient developed an intracranial metastasis (B, grey) and an extracranial metastasis in the course of its disease. Extracranial metastases appeared in either lung (Lun, blue), lymph node (Lym, green), skin (Ski, yellow), liver (Liv, pink), small intestine (Smi, light green) or soft tissue (Sof, purple). Multiple samples of the same metastasis were taken if the metastasis showed histologically different regions. Metastases of the same patient mostly co-cluster together. The few exceptions from this observation are marked with an asterisk ’*’. Affiliation with one of the three main clusters is marked in the lowest color bar (left cluster: pink, middle cluster: brown, right cluster: yellow). Stability of individual clusters is quantified by the red AU value, where 100 means that a cluster was perfectly stable
Personalized analysis of the expression behavior of patient-matched metastasis pairs using a Hidden Markov ModelDue to the observed patient-specific co-clustering of metastases, the transcriptomes of the patient-matched melanoma metastases were analyzed in a personalized way to identify for each metastasis pair genes with increased or reduced expression in the intra- compared to the extracranial metastasis. To realize this, pair-specific log\(_2\)-ratio gene expression profiles were considered (Additional file 9: Table S4). Such a pair-specific gene expression log\(_2\)-ratio represents one of three possible expression states of a gene: (i) a value clearly smaller than zero suggests decreased expression of the specific gene in the intra- compared to the extracranial metastasis, (ii) a value of about zero indicates unchanged expression of a gene between both metastases, and (iii) a value clearly greater than zero suggests increased expression of the specific gene in the intra- compared to the extracranial metastasis.
The considered chromosomal log\(_2\)-ratio gene expression profiles of the patient-matched melanoma metastases pairs show a clear positive correlation for the expression levels of genes in close chromosomal proximity (Fig. 2A). This positive autocorrelation of gene expression changes of neighboring genes motivates the usage of a Hidden Markov Model (HMM) for a personalized analysis of the patient-matched pair-specific gene expression profiles. An HMM can utilize such dependencies between neighboring gene expression levels to make reliable predictions of the underlying gene expression states. This has already been demonstrated successfully in different studies for tumor gene expression profiles (e.g. [32, 33]). For this study, a three-state HMM with state-specific Gaussian emission densities was trained to enable a personalized analysis of the individual patient-matched melanoma metastasis pairs (Fig. 2B, see Methods for details). Connected to the interpretation of the defined gene-specific log\(_2\)-ratios above, the obtained HMM was used to assign each gene in a patient-matched metastasis pair to its most likely underlying expression state: (i) decreased expression ’−’, (ii) unchanged expression ’\(=\)’, and (iii) increased expression ’\(+\)’ in the intra- compared to extracranial metastasis.
The numbers of predicted genes with decreased or increased expression in intra- compared to extracranial metastases are shown in Fig. 3A for each patient-matched metastasis pair. Overall, on average 1234 genes with decreased expression (standard deviation 429) and on average 1003 genes with increased expression (standard deviation 435) in intracranial metastases were found across all metastasis pairs. There was no general trend towards decreased or increased expression of genes in intra- compared to extracranial metastases across all patient-matched metastasis pairs. In more detail, the numbers of predicted differentially expressed genes varied from pair to pair (Fig. 3A: max/min of 2192/504 genes with increased expression for P42_BLym-2/P77_BLym; max/min of 2047/693 genes with decreased expression for P13_BLym/P77_BLym).
Fig. 2
Autocorrelations of gene expression levels in close chromosomal proximity and illustration of the utilized Hidden Markov Model for decoding of gene expression states. A, Autocorrelations in the chromosomal order of genes (red) are significantly greater than the autocorrelations of 1000 randomly permuted gene expression profiles (black). The autocorrelation was calculated chromosome-wise and weighted according to the number of genes on the chromosome. Decreasing autocorrelations of log\(_2\)-expression-ratios between intra- and extracranial metastases of genes in chromosomal order with increasing lag between the genes show that chromosomal distant genes have less similar expression than genes that are closer to each other on a chromosome. The yellow ribbon shows the standard deviations of the observed autocorrelations. B, Illustration of the three-state Hidden Markov Model (HMM) with state-specific Gaussian emission densities that was used to perform the personalized analysis of the patient-matched metastasis pairs. Genes with unchanged expression in the intra- compared to the corresponding extracranial metastasis are assigned to the state ’\(=\)’, genes with decreased expression in the intra- compared to the extracranial metastasis are assigned to the state ’−’, and genes with increased expression in the intra- compared to the extracranial metastasis are assigned to the state ’\(+\)’. The arrows that connect the states represent possible state transitions for directly neighboring genes on a chromosome and the corresponding values represent the learned state transition probabilities
Characteristic expression alterations of cancer-relevant signaling pathways of individual patient-matched metastasis pairsThe HMM was used to predict differentially expressed genes for each patient-matched melanoma metastasis pair (Fig. 3A, Additional file 10: Table S5). These predictions formed the basis for an individual metastasis pair-specific gene enrichment analysis to analyze which known cancer-relevant signaling pathways were significantly affected by gene expression alterations in each metastasis pair (Additional file 3: Figure S3A). Every metastasis pair was enriched for differential expression of at least one cancer-relevant signaling pathway. Overall, there were six known cancer-relevant signaling pathways (cytokine-receptor interaction, calcium signaling, ECM-receptor interaction, cAMP signaling, Jak-STAT and PI3K/Akt signaling) that were frequently affected by differential expression in at least ten metastasis pairs (Fig. 3B). More details to specific pathway overrepresentations of individual metastasis pairs are provided in Additional file 20: Text S1.
Fig. 3
Overview of differentially expressed genes and top-ranked altered pathways across all patient-matched metastasis pairs. The x-axis shows each individual metastasis pair grouped by and color-coded according to the tissue in which the extracranial metastasis occurred (blue: lymph node, green: lung, yellow: soft tissue, purple: skin, pink: liver, cyan: small intestine). A, Absolute number of genes with increased expression in each intracranial metastasis compared to the corresponding extracranial metastasis (red bars) and the absolute number of genes with decreased expression in each intracranial metastasis compared to the extracranial metastasis (blue bars). B, Percentage of genes associated with the top six cancer-relevant signaling pathways that were either increased or decreased expressed in the intracranial metastasis compared to the corresponding extracranial metastasis of a patient-matched metastasis pair. C, Percentage of genes associated with the top four immune-relevant pathways that were either increased or decreased expressed in the intracranial metastasis compared to the corresponding extracranial metastasis of a patient-matched metastasis pair. Significant enrichment of decreased or increased expressed genes in pathways of subpanels B and C are marked with ’x’ (FDR-adjusted p-value < 0.05)
Characteristic expression alterations of immune-relevant pathways in individual patient-matched metastasis pairsOther interesting pathways for an analysis of differentially expressed genes between patient-matched intra- and extracranial melanoma metastases are immune signaling pathways. Therefore, a similar enrichment analysis was done for the pair-specific differentially expressed genes predicted by the HMM with a focus on known cancer-relevant immune signaling pathways (Additional file 3: Figure S3B, Fig. 3C). Significant enrichments of differential expression in immune pathways were almost always only observed for genes with decreased expression in the intra- compared to the corresponding extracranial metastasis of the patient-matched metastasis pairs, except for patient P42, who showed an enrichment of immune signaling genes with increased expression in the intracranial metastasis. These enrichments of genes with decreased expression were not restricted to a specific tissue type in which the extracranial metastases occurred. Further, no significant enrichments of immune signaling pathways were found for eight metastasis pairs of seven patients (P106_BLym, P111_BLym, P107_BLun, P16_BLun, P18_BLun-1, P18_BLun-2, P111_BLiv, P78_BSmi). Generally, four pathways were most frequently significantly enriched for differentially expressed genes across all patient-matched metastasis pairs (Fig. 3C: Antigen processing and presentation, Natural killer cell mediated cytotoxicity, Th1 and Th2, Th17 pathway). All these pathways showed an enrichment of genes with decreased expression in the intracranial metastases for the majority of patients, except for patient P42 which showed an enrichment of genes with increased expression. Details to specific immune pathway overrepresentations of individual metastasis pairs are summarized in Additional file 21: Text S2. Patient P42, the only patient with a significant overexpression of immune signaling, had a NRAS mutation present in both metastases. Roughly a quarter of the patients that did not show significant enrichments of immune signaling had a BRAF mutation. A bit more than a third of the patients that showed significant downregulations of immune signaling had a BRAF and/or NRAS mutation (Additional file 18: Table S13).
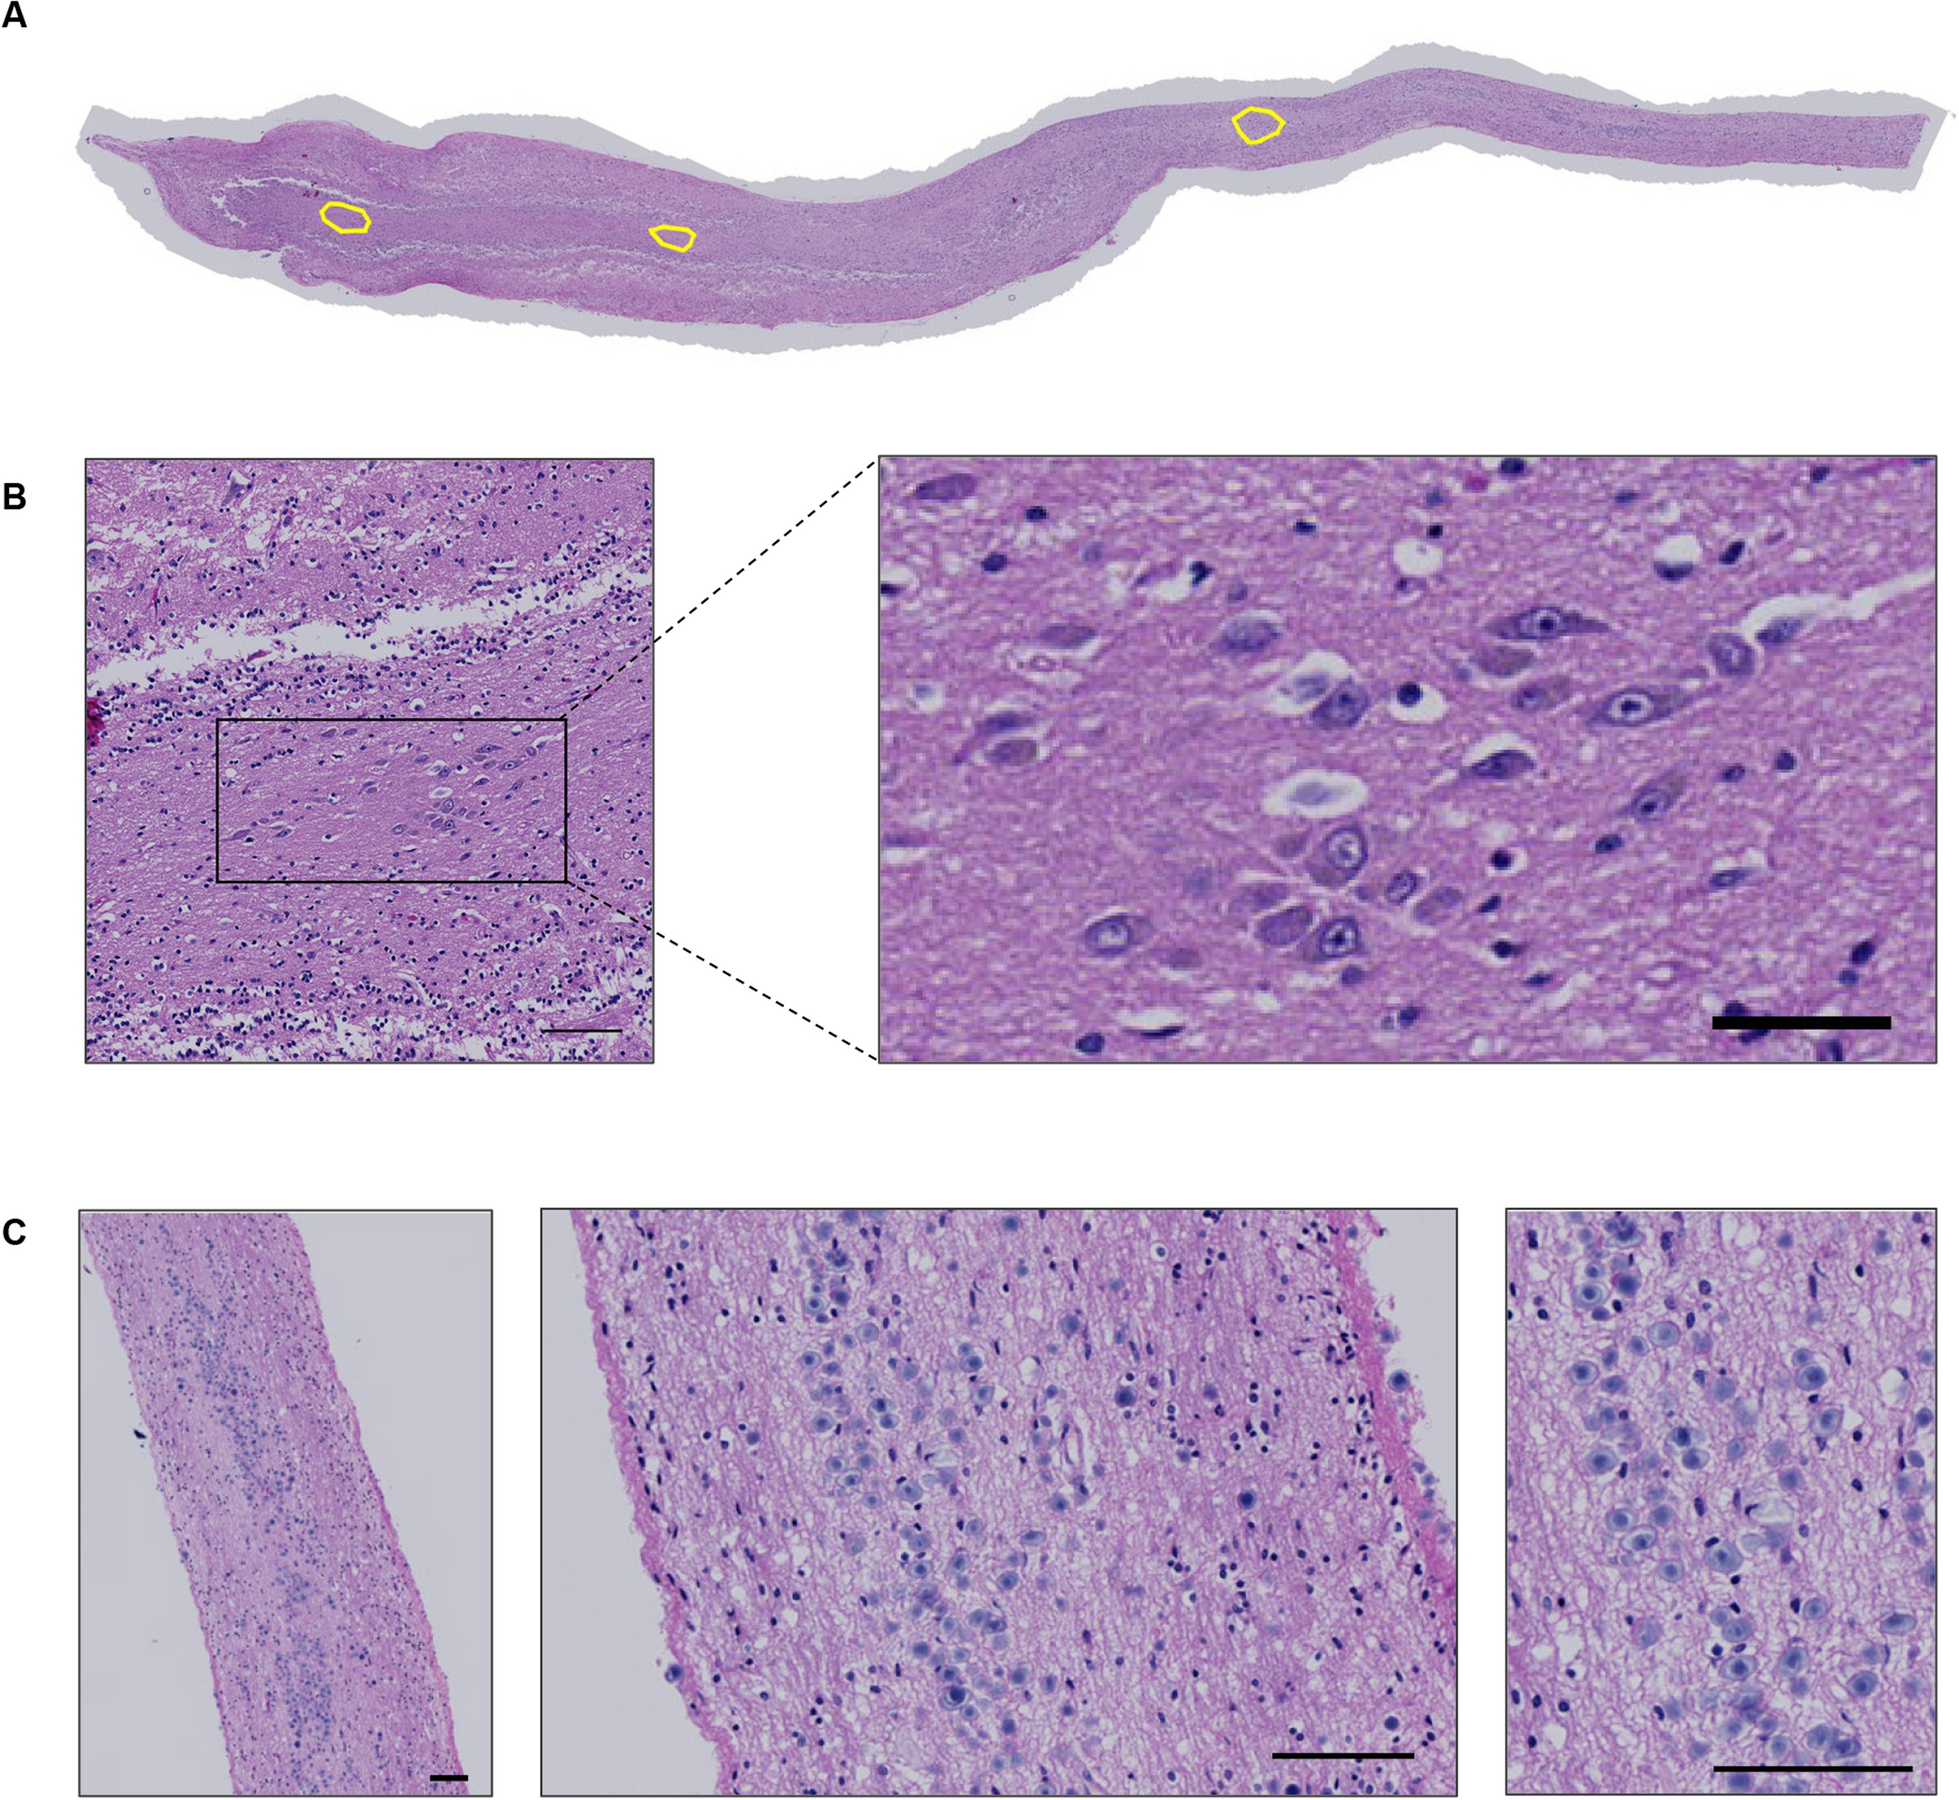
Multiple patient-matched metastasis pairs of histologically different regions are highly similar to each otherThe analyzed melanoma metastases cohort contains four patients with multiple melanoma metastasis pairs that assign the intracranial metastasis of a specific patient to histologically different regions in the corresponding extracranial metastasis of this patient (Table 1: P04, P08, P18, P42). These histologically different regions within the extracranial metastases were marked by an experienced board-certified pathologist to enable separate analyses. In Fig. 3, it is clearly noticeable that the metastasis pairs from the same patient show very similar alteration patterns for enrichment of differentially expressed genes in signaling and immune pathways. Therefore, similarities of genome-wide gene expression alterations from patients with multiple metastasis pairs were analyzed in more detail. Hierarchical clustering of the patient-matched pair-specific gene expression log\(_2\)-ratio profiles comparing the intra- to the corresponding extracranial metastasis showed that metastasis pairs of patients with multiple marked extracranial regions from histologically different regions always co-clustered together in a patient-specific manner (Fig. 4A). Further, the multiple metastasis pairs from the same patients showed a significantly greater overlap of predicted gene expression states than non-patient-matched intra- versus extracranial metastasis pairs (Fig. 4B, two-sided Mann–Whitney-U-test: p < 0.003, median 86.3% vs. 78.7% overlap, Additional file 16: Table S11). Thus, despite histologically different regions in some extracranial metastases, the corresponding metastasis pairs of patients with multiple extracranial samples still showed highly patient-specific expression profiles. These expression profiles are more similar to each other than to expression profiles of patient-matched pairs or non-patient-matched pairs from other patients.
Fig. 4
Similarities of gene expression alterations of metastasis pairs from the same and different patients. A, Hierarchical cluster dendrogram representing the similarities of genome-wide log\(_2\)-ratio gene expression profiles comparing the intra- to the corresponding patient-matched extracranial metastasis sample. The color bars represent the tissue type in which the extracranial metastases occurred (upper bar, blue: lung; green: lymph node, yellow: skin, purple: soft tissue, pink: liver, light green: small intestine) and highlight the patient number by a color code (lower bar). Multiple metastasis pairs from the same patient are labeled with a number at the end of the corresponding identifier of the metastasis pair (see Table 1). Multiple metastasis pairs of each patient formed distinct clusters. Stability of individual clusters is quantified by the red AU value, where 100 means that a cluster was perfectly stable. B, Overlaps of the HMM-based predictions of differentially expressed genes for all pairwise comparisons of either two metastasis pairs from different patients (left boxplot) or for two metastasis pairs from the same patient (right boxplot). Overlap of HMM predictions are significantly different between pairs from different and same patients (Mann–Whitney-U-test: p < 0.003)
Gene ontology analysis identifies biological processes frequently affected by decreased and increased expression of genes in patient-matched metastasis pairsNext, genes that shared the same differential expression across multiple patients were determined. Since metastasis pairs of the same patient showed very similar expression behavior (Figs. 3 and 4), HMM-based gene expression state predictions from the metastasis pairs of the same patient were summarized to one expression state per gene (see Methods). This allowed to include each patient only once in the ranking of genes to avoid patient-specific biases. The genes were separately ranked according to their number of increased expression state predictions (state ’\(+\)’ predicted by HMM) across the intracranial metastases of the patients and according to their number of decreased expression state predictions (state ’−’ predicted by HMM). Both rankings are provided in Additional file 13: Table S8. In general, more genes with decreased expression than genes with increased expression were observed for all patient cutoffs (Fig. 5A). Only one gene, CCL19, showed decreased expression in intra- compared to extracranial metastases in all 16 patients. CCL19 is a cytokine involved in immunoregulatory and inflammatory processes indicating that these processes are potentially downregulated in intracranial metastases. None of the genes shared increased expression in the intra- compared to the corresponding extracranial metastasis in 15 or more patients, but there were two genes, ITIH2 and GAP43, which showed increased expression in 14 patients. ITIH2 contributes to stability of the extracellular matrix and GAP43 is a growth factor highly expressed in neuronal growth.
To further analyze biological processes of the top differentially expressed genes that shared the same expression state in at least 50% (8 of 16) or more of all patients, the corresponding 242 genes with increased expression and the corresponding 459 genes with decreased expression genes were considered for a gene ontology enrichment analysis [39] (Additional file 14: Table S9).
Interestingly, the 242 genes that showed increased expression in patient-matched intra- compared to extracranial melanoma metastasis were frequently involved in synaptic processes (e.g. regulation of trans-synaptic signaling, synapse organization), brain-specific cell development (e.g. forebrain development, gliogenesis, astrocyte differentiation) and neuronal processes (e.g. sensory perception, calcium ion-regulated exocytosis of neurotransmitter, adult behavior) (Fig. 5B). The observation of such a brain-like phenotype for intracranial melanoma metastases is supported by other related studies including single-cell RNA sequencing [22, 43] and was also found in our corresponding previous genome-wide DNA-methylation analysis of the patient-matched metastasis pairs [25]. An additional analysis of the gene expression levels of the genes associated with the brain-like phenotype by directly comparing our intracranial melanoma metastases to our normal brain tissues showed significantly lower expression for 63.5% and significantly increased expression for 6% of the genes in the intracranial metastases, whereas 30.5% of the genes were expressed at the same level like in normal brain tissues (Additional file 4: Figure S4). This indicates that the observed brain-like phenotype is potentially jointly driven by normal cells in the metastases microenvironment and tumor cells of the intracranial metastases.
Further, the 459 genes that showed decreased expression in patient-matched intra- compared to extracranial metastasis were frequently involved in immune responses (e.g. humoral immune response, adaptive immune response, positive regulation of immune response), immune-cell development (e.g. leukocyte differentiation) and chemokine-related processes (e.g. chemokine-mediated signaling, response to chemokine) (Fig. 5C). This is also supported by a related study [26], which identified significant immunosuppression in intracranial melanoma metastases.
Overall, this suggests a down-regulation of immune-related processes and an up-regulation of processes involved in the establishment of a brain-like phenotype in patient-matched intra- compared to extracranial metastasis pairs.
Fig. 5
Overlap of differentially expressed genes between melanoma patients and gene ontology (GO) enrichment analysis of top differentially expressed genes. A, Number of candidate genes that were shared across multiple patients. The x-axis shows the number of patients that commonly share the corresponding differentially expressed genes. The y-axis shows the total number of shared differentially expressed genes (shared genes with decreased (blue)/increased (red) expression in patient-matched intra- compared to extracranial metastasis pairs). B, GO analysis of biological processes of the 242 candidate genes with increased expression in intracranial metastases compared to their corresponding extracranial metastases that were shared across at least eight or more patients. Colors of the bars mark biological process groups (red: synaptic processes, orange: brain-specific cell development, dark brown: neuronal processes, light brown: no specific group). C, GO analysis of biological processes of the 459 candidate genes with decreased expression in intracranial metastases compared to their corresponding extracranial metastases that were shared across at least eight or more patients. Colors of the bars mark biological process groups (purple: immune response, green: activation of immune system, darkgreen: chemokine-related processes, blue: immune-cell development, light blue: other immune-related processes)
In-depth analysis of most frequently differentially expressed genes in patient-matched intra- compared to extracranial metastasis pairsThe identification of genes that are altered in the same manner in their expression between intra- and extracranial melanoma metastases is an important step to identify potential key genes that contribute to the establishment of molecular differences between both metastasis types. Therefore, a more stringent top candidate gene set was created that consisted of genes that were differentially expressed in intra- compared to extracranial metastasis in 11 or more patients. This resulted in 103 genes comprising 75 genes with decreased and 28 genes with increased expression in intracranial metastases. Most of these 103 candidate genes showed a homogeneous expression behavior across all or the majority of metastasis pairs and were further manually assigned to more specific cancer-relevant functional categories by an in-depth gene function and literature analysis (Fig. 6). The expression levels of the candidate genes in intracranial metastases were further compared to normal brain tissues to provide hints how tumor cells of the intracranial metastases and normal cells of the microenvironment may express individual genes (Additional file 5: Figure S5).
Considering the 75 genes with decreased expression in intracranial metastasis in relation to their functional annotations (Fig. 6, lower blue block), several of these genes (26/75) are involved in immune response (e.g. CCL19, CLEC10A, CD8B, CD79A). Ten genes are involved in cell growth (FGF7, RSPO3, TNFSF11, EGFL6, SULF1, ADRA1A, GREM1, FCRL1, IGF1, ANGPTL1), and another nine genes are involved in signal transduction (GPR68, NPY1R, LOXHD1, P2RY10, RGS13, CILP, STAC, P2RY14, GPBAR1).
Considering the 28 genes with increased expression in intracranial metastasis in relation to their functional annotations (Fig. 6, upper red block), seven of them are involved in cell growth (GAP43, HEPACAM, MAPK4, PPBP, LGI1, TUBB1, SCG3). Six genes are involved in cellular transport processes (PMP2, SLC38A11, SLC52A3) frequently including ion transport (GFAP, SLC24A, ATP1A2). Three genes are involved in cell adhesion (MOG, CNTN2, GLDN), and three other genes (11%) are involved in metabolism (ITIH2, CYP4F11, CYP4F3).
Fig. 6
Heatmap of gene expression differences of most frequently altered genes between patient-matched intra- and extracranial melanoma metastasis pairs. The heatmap shows the expression behavior of the 28 genes with increased and the 75 genes with decreased expression state predictions by the HMM that were altered in at least 11 or more patients. A color gradient from blue over white to red is used to visualize the log\(_2\)-ratios of the gene expression levels of the intra- compared to the corresponding extracranial metastasis of each patient-matched metastasis pair. The columns of the heatmap represent the individual metastasis pairs with labels color-coded by the tissue in which their extracranial metastasis occurred (blue: lung, green: lymph node, purple: soft tissue, yellow: skin, pink: liver, cyan: small intestine). The rows of the heatmap represent the individual candidate genes. The annotation block on the left side of the heatmap shows general gene function groups of individual genes and the expression behavior of each gene in three related studies (Fischer et al. [26], Chen et al. [18] and Biermann et al. [22])
Comparison of the most frequently differentially expressed genes to three related studiesIn addition, we compared our candidate gene set of 103 genes to the candidate gene sets of three closely related melanoma metastasis expression studies that compared intra- to extracranial metastases (see Methods for details, Fig. 6, Additional file 17: Table S12). There was a significant overlap of our candidate gene set with the candidate gene sets of the three related studies (Fischer et al. [26]: 38% overlap, p < 0.001; Chen et al. [18]: 3.8% overlap, p \(=\) 0.001; Biermann et al. [22]: 47% overlap, p < 0.001; Fisher’s exact test). Further, the direction of expression changes between intra- and extracranial metastases were the same for all overlapping genes with the related bulk gene expression studies from Fischer et al. [26] and Chen et al. [18], but differed for some genes for the single-cell gene expression study by Biermann et al. [22].
The genes that were consistently found in multiple independent studies are potentially the most relevant candidate genes for future experimental studies. Therefore, the eight genes (MEOX2, FGF7, DPT, LAMP3, CILP, TMEM119, PMP2, GLDN) that were predicted as differentially expressed between intra- and extracranial metastases in our and at least two of the three related studies (Fig. 6) were summarized in Table 2 to provide an overview of their expression behavior, biological functions, and associations with cancer.
TMEM119 was found to be down-regulated in intracranial metastases in all three related studies. TMEM119 is involved in immune response and frequently used as a microglia marker [44]. Other genes with decreased expression in intracranial metastases include MEOX2 involved in transcription, FGF7 involved in cell growth, DPT involved in adhesion, LAMP3 involved in immune response and CLIP involved in signal transduction. Further, two genes, PMP2 and GLDN, were found to be increased expressed in intracranial metastases in our and two other related studies. PMP2 is involved in transport processes of the peripheral nervous system and GLDN is involved in cell adhesion. Moreover, all eight genes have known associations to different kinds of cancer (Table 2). The genes are associated with laryngeal cancer (MEOX2 [45]), cervical cancer (FGF7 [46]), oral cancer (DPT [47]), breast cancer (CILP [48]) or ovarian cancer (TMEM119 [49]) and LAMP3-positive dendritic cells are generally associated with cancer [50]. Further, both genes with increased expression in intracranial metastases (PMP2 and GLDN) have known associations with melanoma cell invasion and mutation [51, 52].
Table 2 Summary of in-depth literature analysis of gene candidates that were also found to be differentially expressed in at least two of the closely related melanoma studiesExpression of several candidate genes is significantly associated with survival of melanoma patientsFinally, the analysis of the 103 candidate genes that differed in their expression between the intra- and corresponding extracranial metastasis for at least 11 of 16 patients was extended to the publicly available melanoma cohort from The Cancer Genome Atlas (TCGA) [
留言 (0)