The experimental animal protocol for this study was designed and reported in accordance with the Animal Research: Reporting of In Vivo Experiments (ARRIVE) guidelines, and in compliance with the regulation and guidelines of the Ethical Committee of the Faculty of Pharmacy, The British University in Egypt which approved the study protocol BC (EX-2103) on March 17th, 2021. Additionally, all the procedures were reviewed and approved by research ethics committee of Faculty of Pharmacy, Cairo University (REC-FOPCU), Cairo, Egypt, approval number: BC (B2914) on January 25th, 2021. The current work was approved under the name “The effect of diabetes mellitus on mesenchymal stem cells and their potential to differentiate into insulin-producing cells”.
Induction of type 1 DM by STZ injection
20 Sprague–Dawley male healthy rats, 12 weeks of age, weighing 200–300 g were used (Rats with HbA1C test over 5.7% or with a pervious access for high-fat foods were excluded). The sample size was determined using G*power software to achieve minimum power of 80%. The animals were kept at 23 °C under a 12 h light–dark cycle, with free access to food and water. Rats fasted for 6–7 h from food, but the water was freely allowed then the fasting blood glucose (FBG) test was measured. The test was performed using chemically treated, disposable glucose oxidase reagent strips (Bionime GS100), then rats with FBG 110 mg/dl (6.1 mmol/L) or below were selected to undergo the experiment. DM in 12 rats was induced by intraperitoneal injection of streptozotocin (STZ) (50 mg/kg) in citrate buffer as described previously [31]. STZ (Alfa-Aeser) was dissolved in freshly prepared 0.1 M citrate buffer. DM was verified 72 h after STZ injection. Rats with FBG over 200 mg/dL (11.1 mmol/L) were considered diabetic rats and were used in the subsequent experiment. On the other hand, 6 fasted rats with FBG 85–110 mg/dl were considered control (normal non-diabetic rats).
Isolation of Ad-MSCs from the epididymis of normal non-diabetic (N-Ad-MSCs) and diabetic rat (DM-Ad-MSCs)
The isolation protocol was performed as described previously with modifications [32, 33]. 6 Sprague–Dawley male rats were selected from the diabetic rats’ group after 14 days of diabetes initiation versus 6 normal non-diabetic rats. The rats were anesthetized using intraperitoneal injection of ketamine hydrochloride (33 mg/kg body weight) and xylazine hydrochloride (13 mg/kg body weight) as explained before [34, 35] and then euthanized by cervical dislocation. The anesthetized rats were placed and used to incise the abdomen area along the peritoneal cavity to get epididymal tissue located over testes of the rat. In an aseptic area; the collected epididymal tissues were cut into small pieces and washed 4–5 times with phosphate buffered saline (PBS) then mixed with an equal volume of 0.1% collagenase solution then placed within a water bath (80 rpm/37 °C/30–45 min) followed by vortexing and centrifuging 2 times at 1200 rpm (300 ×g) for 5 min., The lower layer of stromal vascular fraction (SVF) was re-suspended in 1% bovine serum albumin (BSA) and centrifuged at 1200 rpm (300 ×g) for 5 min. The pellet was re-suspended with Dulbecco's modified eagle medium/nutrient mixture F-12 (DMEM/F12) media (Lonza, Switzerland) supplemented with 10% fetal bovine serum (FBS) (Gibco, Thermo Fisher), 1X antibiotic/antifungal (100 U/mL penicillin, 0.25 µg/mL amphotericin B, and 100 µg/mL streptomycin) (Gibco, Thermo Fisher), and 2 mM L-glutamine (Gibco, Thermo Fisher). Isolated cells within a 25 cm2 flask named (P0), normal-Ad–MSCs (N-Ad-MSCs) that derived from normal rat or (P0), diabetic-Ad-MSCs (DM-Ad-MSCs) that derived from STZ-induced diabetic rat and incubated at 37 °C /5% CO2. Cells with 80- 90% confluency have undergone passaging using 0.25% trypsin-ethylenediaminetetraacetic acid (EDTA) (Gibco, Thermo Fisher).
Characterization of Ad-MSCs
One of the characteristic criteria of MSCs is their ability to attach to plastic surfaces with flat fibroblast-like shaped cells (MSCs-like cells) and also their proliferation and expansion under specific cultural conditions in addition to their multilineage differentiation abilities [36].
Flow cytometry immuno-phenotyping assays
N-Ad-MSCs and DM-Ad-MSCs were collected as cell pellets at P3 and then washed with PBS twice. The recommended amounts of monoclonal antibodies labeled with fluorescein-isothiocyanate (FITC) for mesenchymal markers CD90 or CD105 or phycoerythrin (PE) labeled for CD34 (Stem cells Technologies, USA) as hematopoietic marker, were used, while unstained cells were used as controls. The antibodies, either alone or in combination of 2 different labelling, were mixed with 1 × 10⁵ cells and suspended in 500 μLs of fluorescence-activated cell sorting (FACS) buffer and analyzed by a CYTOMICS FC 500 Flow cytometer (Beckman Coulter, USA).
Multilineage differentiation assays
The ability of cells to differentiate into adipocytes, osteocytes, and chondrocytes is one of the International Society for Cell and gene therapy (ISCT)'s criteria for defining MSC [36]. The mesenchymal stem cell functional identification kit (R&D Systems Inc., USA) was used to induce the multilineage differentiation of the MSCs then the stained cells were observed under the microscope (Olympus inverted microscope, Japan) and the kit was used as follows.
Adipogenic differentiation assay
Cells at P3 were seeded in a 24-well tissue culture plate with a density of 3.7 × 10⁴ cells in each well and supplemented with complete DMEM/F12 Media, 10% FBS, and 1X antibiotic/antifungal. The stromal media was removed from each well every 2–3 days till it reached 100% confluency and adipogenic induction media was added in HG-DMEM (Lonza, Switzerland) for 21 days while there were Ad-MSCs cultured in growth complete DMEM/F12 medium deprived of differentiation factors serve as a control. After this specified period, the cells were washed with PBS and fixed by incubation in 10% buffered formalin for 10 min at room temperature (RT). The cell monolayer was stained with a working solution of 0.5% Oil Red staining (Sigma-Aldrich) which appeared as lipid vacuoles under a microscope.
Osteogenic and chondrogenic differentiation assay
Cells at P3 with a density of 7.4 × 10³ cells/well were cultured in growth complete DMEM/F12 medium and incubated for 3 days until they reached 70–80% confluency. The cells were grown in either osteogenic or chondrogenic induction media respectively for 21 days while the other non-differentiated MSCs cultured in growth complete DMEM/F12 media that were deprived of differentiation factors to act as a control. After the differentiation period, the cell monolayer was washed with PBS and fixed by incubation in 4% paraformaldehyde (PFA) for 20 min at RT then covered with 2% Alizarin Red (Sigma-Aldrich) for staining osteocytes that appeared as calcium-rich extracellular matrix while 0.1% Alcian blue 8GX stain (Sigma-Aldrich) in 3% glacial acetic acid was used for staining chondrocytes, especially sulfated proteoglycan.
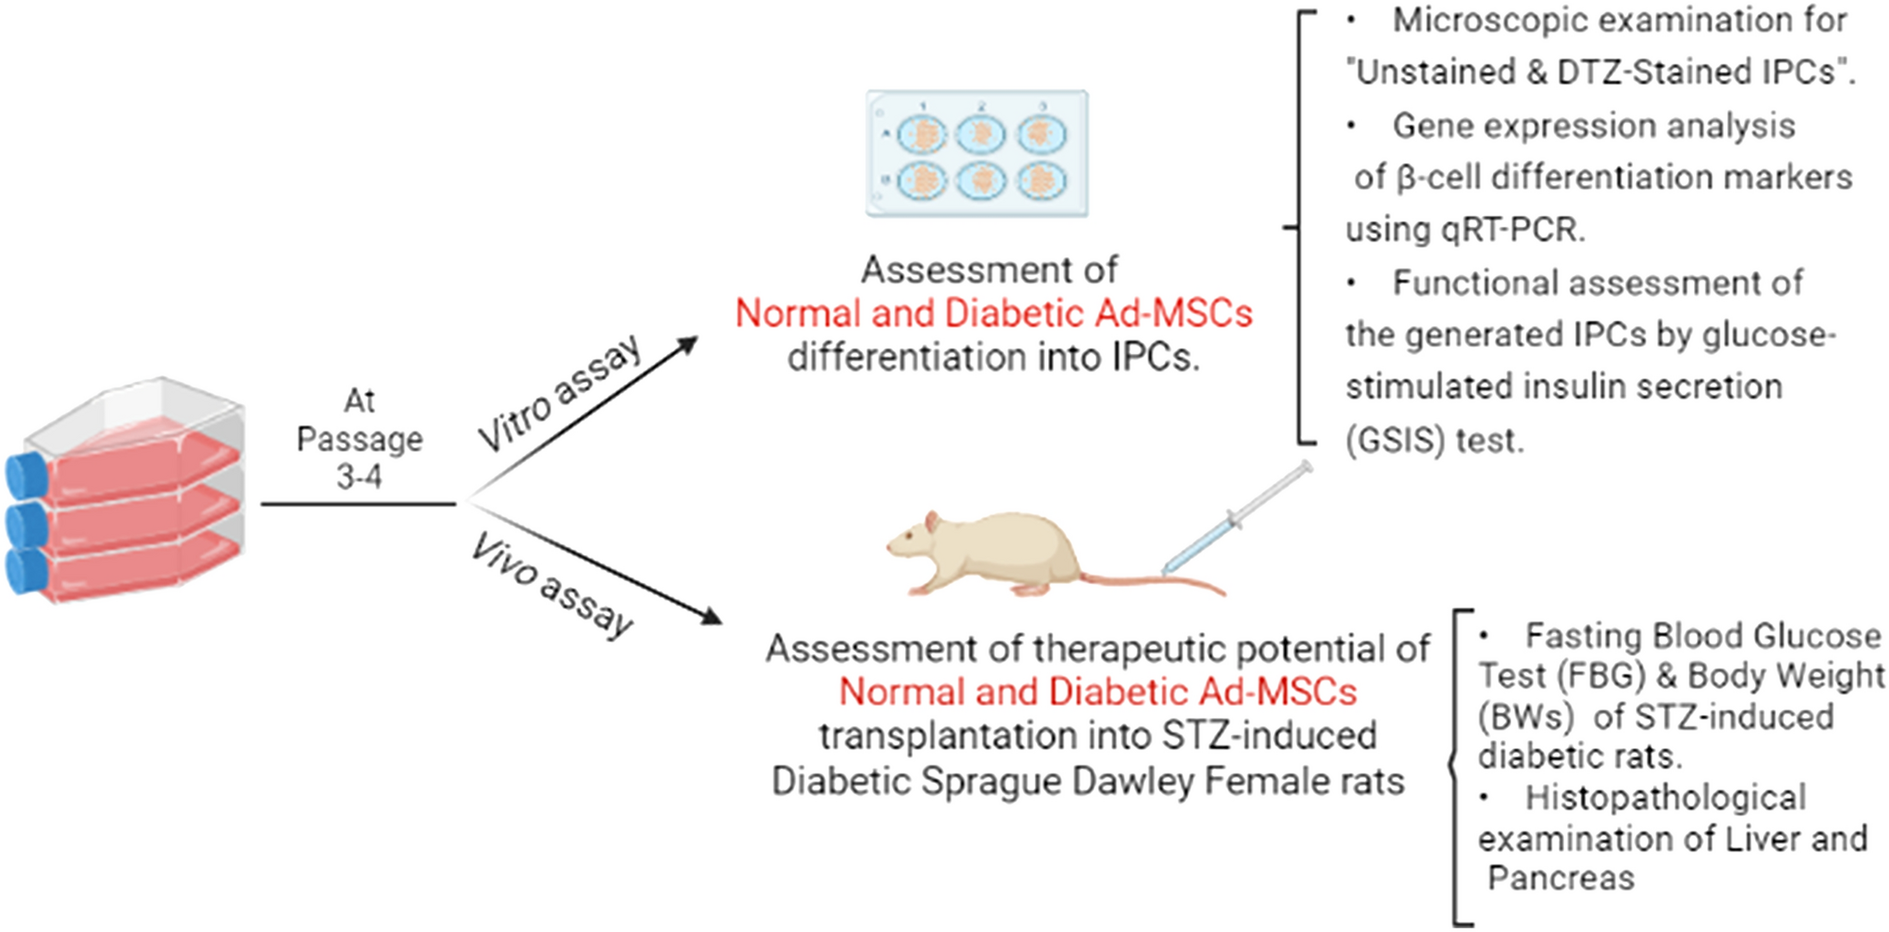
In vitro differentiation of Ad-MSCs into insulin-producing cells (IPCs)
A simple differentiation protocol was carried out as described previously with modifications [33, 37]. A schematic presentation of this protocol is illustrated in Fig. 2A. Briefly, N-Ad-MSCs and DM-Ad-MSCs at passages 3–4 were seeded in 6-well plates and 12 well plates with equal density of 1 × 10⁶ cell/plate and supplemented with a complete DMEM/F12 medium and left for 3 days to reach 80–90% confluency. IPCs differentiation cells were passed by three phases as shown in Fig. 3 while other cells were deprived of differentiation factors to act as a control Ad-MSCs. Phase I: cells were grown for 2 days by pre-induction media; DMEM/F12 supplemented with 10% FBS, 1X antibiotic/antifungal, 2 mM L-glutamine, 10 mM nicotinamide (NA) and 1 mM β-mercaptoethanol (β-ME). Phase II: Day 3 of differentiation; media of cells was replaced by another day of HG-DMEM supplemented with 2.5% FBS, 1X antibiotic/antifungal, 2 mM L-glutamine, 10 mM (NA) and 1 mM (β-ME). Two cell pellets were collected at this stage and named (D3 IPCs). Phase III: cells were incubated with the final differentiation induction media consisting of HG-DMEM supplemented with 2.5% FBS, 1% Antibiotic/antifungal, 2 mM L-glutamine, 10 mM NA, 1 mM β-mercaptoethanol and 10 nM exendin-4 (Sigma-Aldrich) for 7 days. At the end of the specified period, cell pellets were collected and named (Final IPCs), and cells were assessed by dithizone (DTZ) staining, β cell marker expression analysis, and glucose-stimulated insulin secretion (GSIS) as will follow in this section.
Assessment of differentiation of N-Ad-MSCs and DM-Ad-MSCs into IPCsDithizone (DTZ) staining
DTZ staining was performed to confirm IPCs differentiation. DTZ is a zinc chelating agent that identifies β cells containing zinc. The pancreatic islets which are positive with this staining (red color stained with crimson red in the solution) account for the accomplishment of differentiation into β cells or insulin-producing cells [38]. A stock solution was prepared by dissolving 50 mg DTZ in 5 mL dimethyl sulfoxide (DMSO) and stored at − 20 °C in a dark area then mixed and diluted with a complete culture medium; HG-DMEM supplemented with 5% FBS, 1X antibiotic/antifungal and 2 mM L-glutamine then the working solution was filter sterilized. The culture dishes were incubated with DTZ solution for 2h/37 °C, after discarding their media and then washed subsequently three times with PBS while undifferentiated Ad-MSCs were used as a negative control. Differentiated IPCs versus undifferentiated were observed with an inverted microscope (Olympus, Japan) equipped with a digital camera.
Gene expression assay using qRT-PCRRNA extraction
Cell pellets (from normal undifferentiated Ad-MSCs, D3 differentiation, or final differentiated IPCs cells) were collected after trypsinization and stored at – 80 °C till further use. The pellets were suspended in 1 mL TRIzol® reagent (Invitrogen). The lysed samples were incubated for 5 min then 200 µLs of chloroform were added. Following centrifugation, the mixture was separated into three layers while RNA remains exclusively in the upper aqueous phase. 500 µLs of 100% isopropanol were added to the collected aqueous phase then incubated at R.T and after centrifugation of 12,000×g for 30 min at 4 °C, a gel‐like pellet of RNA precipitate was washed with 1 mL 80% ethanol followed by centrifugation 5 min at 9600×g at 4 °C. The RNA pellets were left for air drying. After drying, RNA pellets were dissolved in RNase-free water and quantified by determining the optical densities (OD) at 260 nm and 280 nm using nuclease-free water as blank.
cDNA synthesis, qRT-PCR using SYBR Green Master Mix
cDNA synthesis was done according to the manufacturer’s instructions of the Verso ™ kit (Thermo Scientific, USA). 0.5 µg of total RNA was used for cDNA synthesis. The master mix with RNA was passed through a cycling program of 50 °C for 30 min for one cycle, followed by an inactivation cycle of 95 °C for 2 min for one cycle using sensoquest labcycler thermal cycler, USA. The cDNA was diluted by nuclease-free water to a final concentration of 2 ng/µl and stored at − 20 °C for qRT-PCR.
Quantitative reverse transcriptase polymerase chain reaction (qRT-PCR)
The qRT-PCR reaction was done for each target gene using a Maxima Sybr green Master Mix (Thermo Fisher, USA) according to the manufacturer’s instructions. All measures were done in triplicates. The sets of primers used were shown in Table 1. Neurogenin-3 (Ngn-3), homeobox protein Nkx6.1 (Nkx6.1), musculoaponeurotic fibrosarcoma oncogene homolog A (MafA), and insulin-1 (Ins-1) were measured. Those β-cell differentiation markers are considered as critical transcription factors for β-cell differentiation and maturation [39,40,41]. All qRT-PCR reactions were done in the Step One Plus RT-PCR system (Applied Biosystems, USA) using the default program and dissociation curve. Relative RNA expression was done using the 2−ΔΔCt method using β-actin as a housekeeping gene.
Table 1 Sequence of primers used for the RT-qPCRFunctional assessment of the generated IPCs by glucose-stimulated insulin secretion (GSIS) test
Two glucose concentrations (low glucose (LG) = 2 mM, high glucose (HG) = 20 mM) in Kreb’s Ringer bicarbonate (KRB) buffer solution was used to determine in vitro potency of the IPCs and whether the insulin release of the generated IPCs was glucose-dependent as previously described with modifications [42]. A sterile filtered LG and HG-KRB buffer preparations were prepared as follows: 18 mg glucose for 50 mL KRB to prepare LG-KRB buffer mixture while 180 mg glucose for 50 mL KRB to prepare a HG-KRB buffer mixture. After adjusting the pH of the buffer using 1N HCl to be (7.25–7.35), 0.1% BSA was freshly added. The supernatants from the medium of the induced IPCs for LG and HG concentrations were then harvested for quantification of the released insulin using an enzyme-linked immunosorbent assay (ELISA) as previously described by [43].
Following the induction protocol, the IPCs were gently washed twice with PBS and once with LG-KRB. The IPCs were then cultured for 1 h with 300 µLs LG-KRB/well. The IPCs were incubated with either LG or HG-KRB mixture for an additional 1 h and the supernatant was collected and kept at – 80 °C to be examined and the secreted insulin by IPCs was analyzed using an ELISA kit (Cloud Clone, USA) according to the manufacturer's instructions.
In vivo assessment of the therapeutic potential of N-Ad-MSCs and DM-Ad-MSCs in STZ-induced diabetic rats
Induction of DM by STZ injection in rats
T1DM in 24 female Sprague–Dawley healthy rats was induced by subcutaneously injecting STZ (50 mg/kg in Citrate buffer). The same inclusion and exclusion criteria described earlier in this study were applied. On the other side, 6 normal non-diabetic rats were selected to be as a control group. FBG and body weight were measured after 72 h of STZ induction. 10 days after induction of diabetes; 18 STZ rats were randomized using simple randomization method into the 3 groups; and then they were categorized into three groups; STZ + PBS group (6 non-treated STZ-induced diabetic rats), STZ + DM-Ad-MSCs group (6 STZ-induced diabetic rats treated with DM-Ad-MSCs in PBS), STZ + Normal-Ad-MSCs group: (6 STZ-induced diabetic rats treated with N-Ad-MSCs in PBS).The animals groups were blindly checked for FBG and BWs by an independent technician.
Transplantation of Ad-MSCs
On the day of injection, each fasted rat from STZ + DM-MSCs and STZ + Normal–MSCs group received 1–1.5 × 10⁶ freshly trypsinized P3-P4 (DM-Ad-MSCs) and (N-Ad-MSCs), respectively, where cells were suspended in 1 mL PBS. Cells suspended in PBS were transplanted into tail veins using a 1 mL 100-unit 27-gauge insulin syringe. FBG and BW were measured every 7 days after the day of transplantation for 35 days only. Transplantation was done by the same experimenter for all animals and blindly regarding the groups.
Histopathological examination of some organs of the treated diabetic rats
To investigate the in vivo effects of both N-Ad-MSCs and DM-Ad-MSCs treatments in STZ-induced diabetic rats, autopsy samples were collected on day 35 of transplantation from different affected organs such as livers and pancreas of rats in different groups, as well as a control group to be examined by histopathology. Isolated tissue sections were immediately preserved in 10% buffered formalin for 24–48 h and stored at room temperature. The tissues were then sectioned, fixed on microscope slides, and embedded with paraffin. The sections were stained using hematoxylin and eosin (H&E) stain for blinded randomized examination by two independent researchers. The microscopic examination of stained sections was performed by LABOMED Fluorescence microscope LX400, and LABOMED camera software (Labomed, USA). The images were taken with magnifications 10× and 40× for clarification. All histopathological examinations were done blindly regarding the study groups.
Immunostaining of insulin in pancreata of the treated diabetic rats
Paraffin-embedded tissues were deparaffinized and rehydrated through graded alcohol series. Afterwards, peroxidase blocking serum was added for 10 min, then washed with PBS. This was followed by incubation with protein blocking serum for 10 min. Staining was done by adding anti-insulin antibody (Diagnostic Biosystems, USA) and incubating in moist chamber for 30 min at room temperature, followed by adding the pre-diluted biotinylated secondary antibody to each section for 45 min, then washed with PBS. Then horse radish peroxidase conjugated streptavidin was added for 20 min followed by washing with PBS. Finally, substrate/ 3,3′-diaminobenzidine (DAB) mixture, prepared immediately before use, was added and incubated for 5–10 min followed by rinsing with distilled water. Sections were then counterstained using Harris’s hematoxylin. The microscopic examination was performed by LABOMED Fluorescence microscope LX400, and cells were counted in 3 high power fields (HPF) per group.
Statistical analysis
All data are expressed as mean ± standard error of the mean (SE). The comparisons between β cell markers expression and the quantification of immunostaining of insulin were done by using a one-way analysis of variance (ANOVA) and the Tukey post hoc test. Comparison of GSIS was done by t-test while the comparisons between groups in the in vivo study was done by two-way ANOVA. All means were considered significantly different with p-value < 0.05. All figures and statistical analyses were done using Graph Pad Prism (Version 6, USA).


留言 (0)