Recombinant proteins and protein complexes
For each GRF studied in this work, the coding sequence was obtained by PCR on genomic DNA, generating appropriate restriction sites flanking the CDS for cloning into pQE-80L. The PCR product was first cloned into pCR-Blunt II TOPO vector. From this vector, the corresponding flanking restriction sites were used to subclone the CDS into pQE-80L. The sequence of the recombinant vectors generated was confirmed by Sanger sequencing. The recombinant proteins were expressed in E. coli BL-21 and purified as N-terminal His-fusion proteins using Ni–NTA agarose resin (cat. 30210, Qiagen), according to the manufacturer’s instructions. The eluted fractions were supplemented with glycerol (15% final concentration) and stored at − 80 °C until their use. Each GRF was eluted under a specific imidazole concentration. This concentration was brought to the same level and then the proteins were diluted in the same extent using TF dilution buffer [10 mM HEPES–KOH (pH 7.4), 100 mM KCl, 1 mM DTT, 15% Glycerol, 10 µM ZnCl2, 100 µg/mL BSA, 0.5 mM PMSF, 5 μg/mL leupeptin, 1 μg/mL pepstatin A] to generate the working stock of each GRF. An SDS-PAGE analysis of the purified His-tagged proteins is in Additional file 1: Fig. S1.
The ISW1a and RSC complexes were obtained by tandem affinity purification from Ioc3-TAP and Rsc2-TAP S. cerevisiae strains, respectively (Open Biosystems), as previously described [27]. The purified complexes were analyzed as previously reported by us [28]. For each complex, an aliquot of a purification was extensively concentrated (Microcon Ultracel YM-10, Amicon-Millipore), quantified by SDS–PAGE followed by Coomassie staining and then used as standard for Western blot quantification of the purified complex in that and further purifications.
DNA probes and nucleosome reconstitution
DNA probes of different lengths and harboring the 601 nucleosome positioning sequence located at different positions were generated by PCR using distinct plasmids as templates. The 147 bp positioning region of the 601 sequence was defined as previously described [29]. In the case of probes bearing a binding site for a GRF, for each one the corresponding plasmid was generated by introducing a cassette harboring the binding site. In all these vectors the 601 sequence is separated from the GRF binding site by 10 bp. The plasmids and primer sets used are depicted in Additional file 1: Table S1. Before PCR amplification, one of the primers used in each reaction was labeled on its 5’ end using [γ-32P]-ATP (Perkin-Elmer NEG035C or ARC ARP0102B). Nucleosome reconstitution was carried out by the octamer transfer method, as previously described [10]. Oligonucleosomes used as histone donors for reconstitution were obtained from HeLa cells as described elsewhere [30]. All the reconstitution reactions were carried out using 0.5 pmol of probe and 1.5 µg of oligonucleosomes. Once reconstituted, the nucleosome probe (and mock-reconstituted probe) concentration is 4 fmol/μL and the non-labeled oligonucleosomes concentration is 12 ng/μL (in terms of DNA content).
Binding assays
In each binding reaction, a mix containing 7.9 μL of Remodeling buffer, 0.6 μL of ddH2O, 0.5 μL of GRF or TF buffer, 0.5 μL TE buffer, 3 μL of CRC buffer and 2.5 μL of probe was incubated for 30 min at 30 °C (see the composition of each solution used in the mixes in Additional file 1). The final concentration of the different components of this mixture was: 10.7 mM HEPES–KOH pH 7.9, 4 mM Tris–Cl (pH 7.4–8.0), 80.9 mM NaCl, 19.1 mM KCl, 5.4 mM MgCl2, 0.2 mM Mg(CH3COO)2, 0.05% NP-40, 10% glycerol, 0.2 μM ZnCl2, 0.2 mM EDTA (pH 8.0), 0.4 mM EGTA, 100 μg/mL BSA, 1.4 mM imidazole, 2 mM DTT, and 0.5 mM PMSF. The samples were then subjected to electrophoresis in non-denaturing polyacrylamide gel (200 V, 0.3 × TBE, 5% acrylamide, 40:1 AA:Bis proportion) in cold room. Afterwards, the gel was dried and autoradiographed on film or scanned using a phosphor screen and Molecular Imager FX (BioRad, Hercules, CA, USA). Densitometric analyses were performed using Quantity One software, v4.1.1 (for phosphor imager files) or UN-SCAN-IT software, v6.1 (films). The extent of binding was calculated as the ratio of bound nucleosome band signal over the combined signal of bound and unbound nucleosome bands in the lane.
For the analysis of dissociation kinetics, the binding reaction proceeded as described for the binding analyses, but scaled 6 times in volume. After binding incubation, a 15 μL aliquot was taken and 13 μL subjected to electrophoresis as described above. To the rest of the sample, 7.5 μL of a mix containing 2.5 μg of non-labeled DNA (ladder DNA, NEB N3231S, further purified by organic extraction) and a non-labeled double-stranded oligonucleotide harboring the GRF’s target sequence (100× final concentration in the reaction mix, relative to GRF concentration) was added, and the incubation at 30 °C was continued for 60 min. During this incubation time, 13 μL aliquots were taken at defined time points (10, 20, 30 and 60 min) and immediately loaded in the gel. Gel drying and subsequent analyses proceeded as described above.
Nucleosome sliding assays
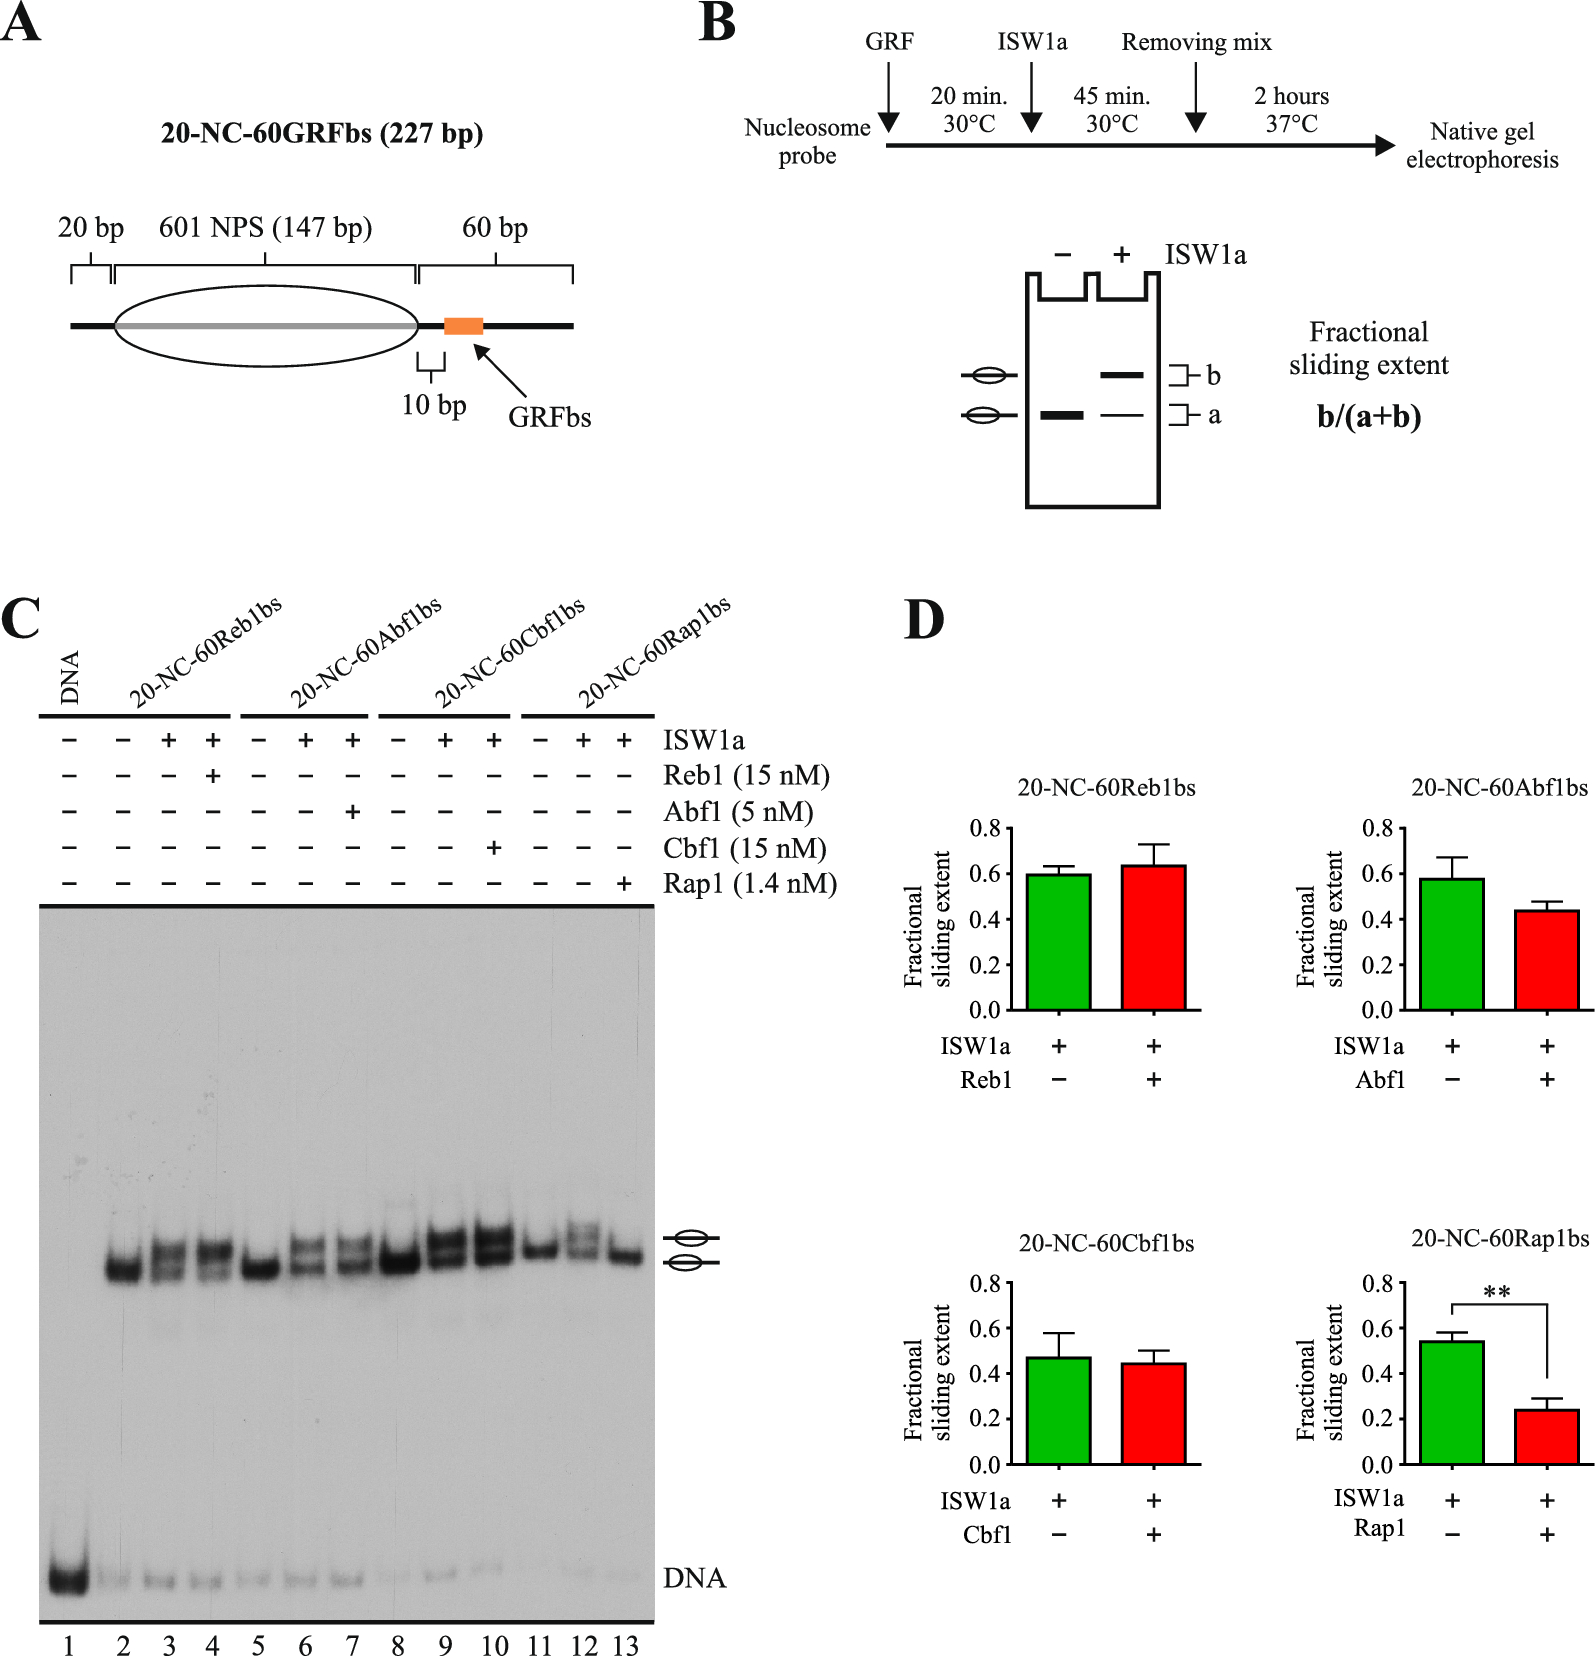
A mix containing 7.9 μL of Remodeling buffer, 0.6 μL of ATP (Roche, 11140965001), 0.5 μL of GRF or TF buffer, 0.5 μL TE buffer, and 2.5 μL of probe was incubated for 20 min at 30 °C (see the composition of each solution used in the mixes in Additional file 1). Then, purified ISW1a complex (brought to 3 μL using CRC buffer) or CRC buffer (3 μL) was added, incubating for additional 45 min at 30 °C. After this incubation, 1.5 μL of a mix containing 500 ng of non-labeled DNA (ladder DNA, NEB N3231S, further purified by organic extraction) and a non-labeled double-stranded oligonucleotide harboring the corresponding GRF’s target sequence (100× final concentration in the reaction mix, relative to GRF concentration) was added (removing mix), incubating for 2–4 h at 37 °C. The samples were then subjected to gel electrophoresis. This step and further steps proceeded as described for binding assays. The extent of nucleosome sliding was calculated as the ratio of the signal of slid mononucleosome band over the signal of all mononucleosome bands in the lane.
Octamer transfer assays
A mix containing 7.9 μL of Remodeling buffer-OT, 0.6 μL of ATP (Roche, 11140965001), 0.5 μL of GRF or TF buffer-OT, 0.5 μL of oligonucleosomes (in FCR buffer), and 2.5 μL of probe was incubated for 20 min at 30 °C (see the composition of each solution used in the mixes in Additional file 1). Then, purified RSC complex (brought to 3 μL using CRC buffer) or CRC buffer (3 μL) was added, incubating for 1 h at 30 °C. The final concentration of the different components of this mixture was: 10.7 mM HEPES–KOH pH 7.9, 4 mM Tris–Cl (pH 7.4–8.0), 51.8 mM NaCl, 48.2 mM KCl, 5.4 mM MgCl2, 0.2 mM Mg(CH3COO)2, 0.05% NP-40, 10% glycerol, 0.26 μM ZnCl2, 0.2 mM EDTA (pH 8.0), 0.4 mM EGTA, 100 μg/mL BSA, 0.64 mM imidazole, 2 mM DTT, and 0.5 mM PMSF. After this incubation, 1.5 μL of the Removing mix described above for the sliding assays was added, followed by a 4 h incubation at 37 °C. The samples were then subjected to gel electrophoresis. This step and further steps proceeded as described for binding assays. The extent of nucleosome assembly was calculated as the ratio of nucleosome band signal over the combined signal of nucleosome and naked DNA bands in the lane.
Bioinformatics analyses
The bigwig files corresponding to H3-HA incorporation [H3-HA_TBP-AA_T30 (rep2)] and H3 occupancy [H3_TBP-AA_T30 (rep2)] were obtained from GSE143305 [20]. For both files, the genome was partitioned into 50 bp bins using bigwigAverage from deeptools, to obtain the incorporation or occupancy in these bins. On the other hand, gff files corresponding to Filtered_PeakPairs for ChIP-exo and PB-exo of Rap1 were obtained from GSE93662 [16]. Files were sorted, and then the intersections of Rap1 peaks with H3-HA incorporation or H3 occupancy were performed using bedtools Intersect option -wo. Subsequently, the intersections were analyzed in GraphPad Prism 9 to generate correlation and violin plots. Presence or absence of statistically significant differences was determined using the Mann–Whitney U test.


留言 (0)