
記住我


HMBS, also known as porphobilinogen deaminase, is an enzyme involved in the heme biosynthesis pathway, and more specifically in the conversion of porphobilinogen into heme precursor hydroxymethylbilane [41]. Mutations in this gene have been associated with acute intermittent porphyria (AIP), which is a rare metabolic disease with life-threatening neurovisceral attacks that require frequent hospitalization of patients [42]. As almost one third of HMBS variants annotated in the ClinVar database [43] are VUS, saturation mutagenesis experiments using high-throughput yeast complementation assays have recently been performed to estimate the fitness of HMBS variants and better understand the pathogenic mechanisms leading to AIP [44]. This data was unpublished at the time of the CAGI6 experiment and was used as blind fitness values to assess predictors.
Among the 5963 HMBS single-site missense mutations with experimental fitness values from [44], the CAGI6 assessors discarded hyper-complementing mutations (with experimental scores above 1.36), leaving a final evaluation dataset of 5811 mutations [27]. Indeed, it has previously been reported by the authors of the experiments that such variants displaying increased fitness in yeast assays could be mostly disadvantageous in human [38, 44].
We applied our prediction models FiTMuSiC (Eq. (4)), SNPMuSiC (Eq. (5)) and PoPMuSiC (Eq. (6)) to the HMBS target. We also report the results of the two other top-performing methods among the 11 teams participating in the challenge, i.e. CalVEIR and ELAPSIC (called team \(10\_5\) and \(5\_1\) in [27]). Additionally, we provide the results of six widely used methods for deleteriousness prediction, i.e. FATHMM [13], PROVEAN [17], DEOGEN2 [15], PolyPhen\(-\)2.0 [19], EVE [14] and MutPred2 [23] as well as two recently developed deep-learning based predictors, Sequence UNET [22] and AlphaMissense [24]. To ensure consistency with the metrics provided by the CAGI6 HMBS challenge, all methods were benchmarked on the same dataset of 5811 mutations. The performance of the predictors was assessed by three types of correlations (i.e. Pearson correlation, and Spearman and Kendall rank correlations), and the root mean squared deviation (RMSD). The results are given in Table 1.
Table 1 Fitness prediction results of the benchmarked methods on the 5811 variants used in the CAGI6 HMBS challenge [27]. The best score for each metric is indicated in boldNote that the current version of FiTMuSiC (available on our webserver) slightly outperforms the version used for the CAGI6 HMBS challenge due to a small implementation modification. Namely, we now consider the SNP and PVS terms separately (as described in Methods), whereas they were aggregated into a single term in the previous version. The Kendall, Spearman and Pearson correlations improved from (0.30, 0.43, 0.42) to (0.31, 0.45, 0.45), respectively, between the first and second versions. However, to ensure the blind nature of the challenge, we presented in the table the performances of the older FiTMuSiC version.
Among CAGI6 participants, FiTMuSiC performs as well as the other two best performing predictors, ELAPSIC and CalVEIR with very similar performance metrics. CalVEIR shows the best results in rank-based metrics, ELAPSIC in Pearson correlation and FiTMuSiC in RMSD. These three predictors all perform significantly better than the other 8 teams participating in CAGI6 [27]. They also perform significantly better than the other methods tested (FATHMM, PROVEAN, DEOGEN2, PolyPhen-2, Sequence UNET and MutPred2), except for EVE and AlphaMissense. We observe that FiTMuSiC outperforms EVE in rank-based metrics but not in Pearson correlation and that, conversely, FiTMuSiC outperforms AlphaMissense in Pearson correlation but not in rank-based metrics. Overall, these five best performing methods display very comparable scores and their respective ranking depends on the metric considered.
We also wish to underline the good performances of the SNPMuSiC deleterious variant predictor [16], which only slightly underperforms the best methods. In contrast, PoPMuSiC [29], which predicts stability changes upon mutations, does not work so well. This is not surprising given deleteriousness and fitness are very well correlated, while stability and fitness are less so. For example, all functional residues are highly important for fitness while very poorly optimized for stability [40].
The performance of the tested methods can be considered as good considering that the HMBS data was not seen by any of the methods. However, there is still room for improvement as the Pearson correlation coefficient of all methods is below 0.5. Note, however, that the noisiness of deep-mutagenesis datasets (with both random and systematic errors) puts an upper bound to the precision of the predictors which cannot be surpassed without overfitting.
Feature analysis and model interpretationIt is well known that enzymes exhibit an activity-stability trade-off: residues in catalytic regions are optimized for functional reasons and less or not at all for stability, while other residues are very important for protein folding and stability and play little to no role in function [40]. FiTMuSiC can help in distinguishing these functional and structural contributions. Indeed, it outputs the z-scores \(\mathcal _}\) and \(\mathcal _}\) (Eqs. 10–11) which inform us about the extent to which structural and/or evolutionary features contribute to protein fitness, and provides us with a molecular-level understanding of variant effects. It also gives us information about the RSA of the mutated residues, and thus about their location in the protein.
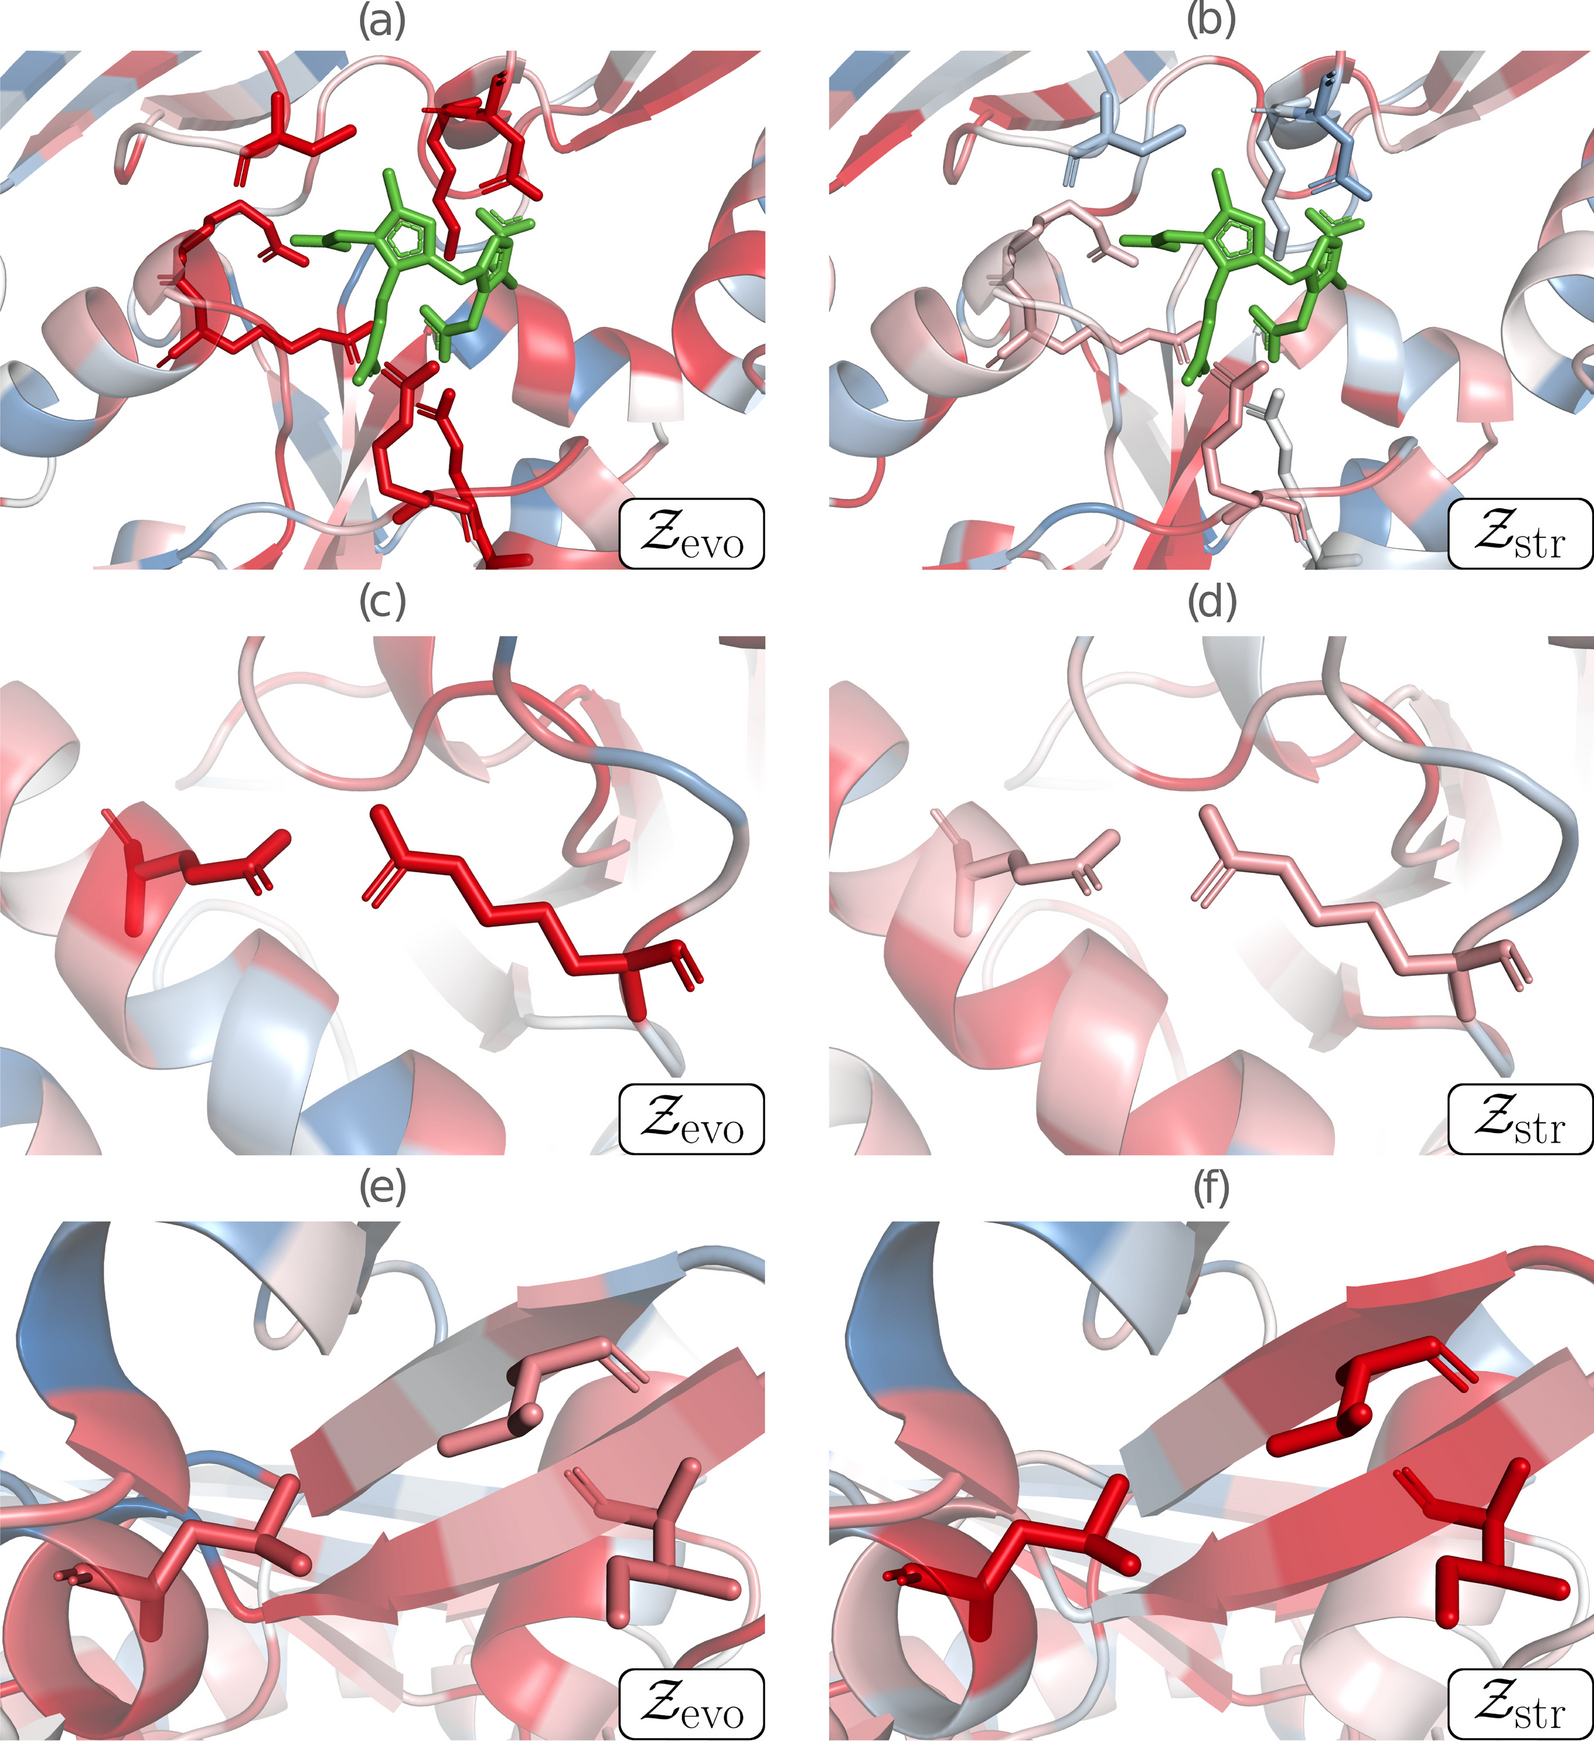
We focused here on three functionally or structurally important residue groups of HMBS, which are structurally represented in Fig. 1 and colored according to their average per-residue z-score values \(\mathcal _}\) and \(\mathcal _}\). Paired \(\mathcal _}\) and \(\mathcal _}\) values of all single-site mutations are plotted in Fig. 2, with the mutations of the selected residue groups highlighted.
The region around the catalytic site of HMBS is represented in Figs. 1a,b and 2a. The catalytic residues (K98, D99, R149, R150, R167, R173 and C261) were identified by aligning the sequences of the considered human HMBS and of Escherichia coli HMBS, and by mapping the seven catalytic residues of the latter [45] annotated in the Catalytic Site Atlas [46]. These residues are thus functionally important, well conserved and very specific. As expected, mutating them results in very negative \(\mathcal _}\) values (between \(-2.41\) and \(-0.59\)), which reflects drastic reduction or loss of function. In contrast, they contribute little to structural stability, as seen from the predicted \(\mathcal _}\) values centered around zero (between \(-1.43\) and \(+1.04\)).
The second region considered is the salt bridge between the negatively charged residue E250 and the positively charged residue R116 (Figs. 1c, d and 2b). It is a highly specific interaction that has been shown to play an essential role in the enzyme’s fold by molecular dynamics simulations [44]. The \(\mathcal _}\) and \(\mathcal _}\) values of these two residues are predicted to be negative on the average (\(-1.41\) and \(-0.43\) respectively), indicating fitness reduction upon mutations. \(\mathcal _}\) is negative for all mutations (\(\le -0.72\)), whereas \(\mathcal _}\) is only negative on the average (between \(-1.53\) and \(+0.37\)). The high specificity of the interaction gives a particularly strong evolutionary signal, whereas the stabilizing effect of salt bridges is less marked compared to other interactions.
Finally, the hydrophobic cluster of the three residues V124, I186 and L193 (Figs. 1e, f and 2c) located in the core of the protein is very important for the stability of the protein fold. It thus shows strongly negative \(\mathcal _}\) values, with some exceptions that correspond to mutations from one hydrophobic residue into another. In contrast, this cluster plays no direct role in the protein’s enzymatic activity and, moreover, hydrophobic interactions have low specificity and are often substituted with other hydrophobic residues across evolution. This explains the large width of the \(\mathcal _}\) distribution (between \(-1.52\) and \(+1.64\)), and its only weakly negative average value (\(-0.70\)). On the other hand, \(\mathcal _}\) values are also sparse (between \(-3.05\) and \(+0.38\)) but are more shifted towards negative values (average of \(-1.60\)).
Comparing the coefficients in Eqs. (8) and (9) when all features of the linear regression are normalized by their standard deviation, we found the contribution of the evolutionary features to the final score to be about 3 times greater than that of structural features, which indicates that evolutionary terms hold a relatively larger predictive power. However, it is the combination of both contributions that leads to the highest precision and structural terms thus improve the detection of deleterious variants. For instance, most mutations of residue L244 have very low experimental fitness a display a largely negative \(\mathcal _}\) but a positive \(\mathcal _}\). We postulate that the deleterious nature of these mutations has not been detected by evolutionary features due to the relatively low frequency of leucine in the MSA at this position (about 0.02). Another advantage of the structural terms is that they are reliable on proteins or protein regions with low evolutionary information (resulting in low-depth MSAs regions), such as de novo designed proteins. Indeed, none of the structural terms rely on evolutionary information.
In summary, the combination of both structural and evolutionary terms makes it possible to interpret whenever the deleterious effect of a mutation is attributed to a loss of function or to a perturbation of the protein fold. Since evolution and structure are related, it is no surprise that we often observe correlated \(\mathcal _}\) and \(\mathcal _}\) values. However, this correlation is limited (Pearson correlation of 0.40). As a matter of fact, there are a lot of counterexamples where \(\mathcal _}\) and \(\mathcal _}\) have opposite signs, as seen in Fig. 2. This reflects the fact that the evolutionary and structural components of fitness are complementary, and that combining them into a single model increases both its accuracy and interpretability.
Fig. 1
Contributions of structural and evolutionary features to HMBS fitness, represented by \(\mathcal _}\) and \(\mathcal _}\), respectively. Negative z-scores (indicating mutations less fit than average mutations) are in red, close to zero scores in white and positive scores (indicating mutations fitter than average mutations) in blue. a, b Catalytic region, with the catalytic residues K98, D99, R149, R150, R167, R173 and C261 shown in sticks, and the substrate in green; c, d Salt bridge partners E250 and R116 shown in sticks; e, f Cluster of the three buried hydrophobic residues V124, I186 and L193 shown in sticks
Fig. 2
Scatter plots of paired \(\mathcal _}\) and \(\mathcal _}\) values for all single-site mutations in HMBS. Mutations of a the catalytic residues K98, D99, R149, R150, R167, R173 and C261, b the salt bridge residues E250 and R116 and c the hydrophobic cluster residues V124, I186 and L193 are highlighted in purple
Prediction of HMBS gain-of-function variantsVariants displaying an increased fitness compared to the wild-type, sometimes referred as gain-of-function (GoF) variants are known to be difficult to predict and to interpret [47]. Furthermore, as pointed out above, very high fitness values in yeast assays tend to be deleterious in human, making their interpretation even more ambiguous. FiTMuSiC, as well as the other assessed predictors, cannot be used to accurately detect GoF variants. However, we still note that the set of variants with experimental fitness above 1.1 (about one tenth of all HMBS mutations) have both positive \(\mathcal _}\) and \(\mathcal _}\) values (0.51 and 0.37, respectively). In addition, when comparing the average z-score of the GoF variant predictions, FiTMuSiC displays the highest value (0.54) among all tested methods.
FiTMuSiC application to HMBS variant pathogenicity and activityFitness predictors are expected to play a crucial role in the classification and interpretation of genetic variants by providing complementary information to the experimental characterizations [48]. It has however to be noted that the experimental HMBS fitness values of the CAGI6 challenge come from a deep mutagenesis experiment that uses functional complementation yeast assays, which cannot fully reflect the complex mechanisms underlying variants’ pathogenicity and activity.
In this context, we assessed all the predictors considered as well as the experimental yeast assay data [44] on their ability to distinguish clinically annotated pathogenic and benign variants in humans. To that end, we collected the 53 pathogenic or likely pathogenic variants in HMBS that are related to AIP and the 13 benign or likely benign variants from ClinVar [43]. The metrics we used to assess the methods’ performances are sensitivity, specificity and balanced accuracy (BACC), for which we used the default prediction thresholds provided by the methods (and 0.5 for FiTMuSiC), as well as a threshold-independent metric, the area under the receiver operating characteristic curve (AUC-ROC). We reported all performances in Table 2.
We observe that FiTMuSiC predicts with very high accuracy the pathogenicity of the variants with a BACC of 0.94 and an AUC-ROC of 0.98 only slightly outperformed by AlphaMissense with a BACC of 0.95 and an AUC-ROC of 0.99. It performs better than all other computational methods and also, notably, than the experimental high-throughput fitness data obtained by yeast complementation assays to evaluate variant pathogenicity. We found that some of the computational methods tested are heavily biased towards pathogenic variants, as for example PolyPhen-2 and FATHMM. This can be explained by the choice of the threshold values proposed by their authors. They have thus a very poor specificity and predict very few neutral variants. FiTMuSiC does not suffer from this bias and reaches almost perfect accuracy in identifying neutral variants. Note that EVE also shows good performances which are only slightly less accurate than FiTMuSiC.
Table 2 Performance on 66 HMBS variants with clear clinical annotations taken from ClinVar [44], using all predictors assessed as well as experimental fitness data obtained by yeast complementation assays [44]. The best score for each metric is indicated in boldAs an additional verification of FiTMuSiC robustness, we checked if it is able to predict the effect of variants on HMBS in vitro activity. We reported in Table 3 the correlations between the results of the predictors or high-throughput experiments and the experimentally measured activity of 35 variants described in [49]. These results show that FiTMuSiC performs very well. It even outperforms in Pearson correlation the experimental fitness data from [44] and is only outperformed by AlphaMissense.
Table 3 Correlation coefficients between experimental activity on 35 HMBS variants measured in [49] and the fitness values obtained by the assessed predictors and by experimental yeast complementation assays [44]. The best score for each metric is indicated in boldFiTMuSiC application to human glucokinaseTo further test the robustness of FiTMuSiC, we applied it to another blind test set containing experimental high-throughput fitness data of single-site variants in human glucokinase (GCK). This enzyme plays a key role in insulin secretion in pancreatic \(\beta\)-cells: it catalyzes the first step of the glycolysis by transforming glucose into glucose-6-phosphate [50]. Inactivating GCK variants were related to maturity-onset diabetes of the young as well as to permanent neonatal diabetes mellitus [50, 51]. Hyperactive GCK variants are also deleterious and lead to persistent hyperinsulinemic hypoglycemia of infancy.
In order to shed light on the molecular effects that lead to these disorders, the GCK activity of 8570 single-site variants have been experimental assessed using functional complementation yeast assays [52]. We used this set of variants as independent test set to assess the fitness predictors. To ensure homogeneity between this dataset and data provided for HMBS, we floored all negative fitness values to zero and excluded all values with standard error exceeding 0.3, as was done in the experimental data from [44]. This gives a final number of 6862 missense mutations; note that the experimental data appears to be noisier on GCK than on HMBS, as experiments on the latter were repeated twice. We show the performances of FiTMuSiC and other computational tools on GCK in Table 4. FiTMuSiC is among the top ranked predictors on this additional test set, with performance metric values in line with those of the HMBS benchmark.
We also evaluated the ability of the methods to classify deleterious and benign GCK variants that are defined based on clinical annotations. For that purpose, we curated a set of variants in GCK from ClinVar [43] with clear clinical interpretation. This led us to a collection 69 pathogenic or likely pathogenic variants, and 3 benign or likely benign variants. The very low number of benign variants and the bias of predictors towards deleterious variants make this test case relatively easy, and most methods thus reach very high scores: five methods have an AUC-ROC of at least 0.97 (Table 5). FiTMuSiC also shows good performance with a BACC of 0.89 and an AUC-ROC of 0.99. Due to the strong imbalance of this test set, we suggest to consider these results with caution.
It has to be noted that the use of experimental fitness data from complementation yeast assays to predict deleteriousness does not perform very well for GCK variants (Table 5). The BACC and AUC-ROC values are even lower than in the case of HMBS. Some reported pathogenic variants such as V62M, T65I and H137R, seem to be benign in the experimental fitness map. Their deleteriousness has been suggested to be related to effects such as modest structural instability which are not captured by the assay [52]. This observation underlines the importance of reliable and robust prediction methods to complement experimental data for annotation and interpretation of variants.
Table 4 Correlations between fitness values obtained by high-throughput experiments using functional complementation yeast assays [52] on 6862 GCK variants and those predicted by all the methods assessed. The best score for each metric is indicated in boldTable 5 Performance on 72 GCK variants with clear clinical annotations taken from ClinVar [43], using all predictors assessed as well as experimental fitness data obtained by yeast complementation assays [52]. The best score for each metric is indicated in boldWebserverIn order to make FiTMuSiC readily available to the scientific community, we have developed an easy-to-use webserver at http://babylone.ulb.ac.be/FiTMuSiC/. Users need to input a 3D structure of the target protein in one of three ways:
1.Provide its PDB ID if it is available in the Protein Data Bank (PDB) [53]; the structure is automatically retrieved.
2.Provide its UniProt ID; the corresponding AlphaFold DB structure [39] is then retrieved.
3.Provide a personal structure in PDB format (.pdb).
Since FiTMuSiC provides results on a per-chain basis, users need to select which chain they want the results for. Note that FiTMuSiC only outputs the results of a single chain, but the structural components of the model take into account all the chains contained in the structure file when computing the fitness score. Therefore, we recommend that users provide protein structures that correspond to biological units, especially when dealing with multimers.
Once the chain has been selected and submitted, the computation starts. Depending on the length of the query protein and the depth of its MSA, users should expect the computation to be completed in a few minutes for short proteins to a few hours for very long proteins. Once the computation is done, a CSV file with the results is sent to the email address provided during the submission. This file contains the RSA of all residues in the protein and the predicted fitness scores for all possible single-site variants. The last four columns contain fitness score information, i.e. the raw FiTMuSiC score and the z-scores \(\mathcal \), \(\mathcal _}\) and \(\mathcal _}\) (Eqs. 4, 7, 10, 11). More information about the webserver and its usage is available on the help page (http://babylone.ulb.ac.be/FiTMuSiC/help.php).
留言 (0)