Participants for the epidemiologic analysis
UK Biobank is a prospective cohort study of approximately 500,000 participants aged 40–69 years recruited across the UK. Demographic information, visual examinations, medical history, and surgery history were ascertained through touch-screen questionnaires at the baseline recruitment visit.
UK Biobank has ethical approval from the North West Multi-centre Research Ethics Committee (11/NW/0382). This paper’s access to patient records is under UK Biobank Resource project #62,525. Written informed consent was obtained from all participants of this study. The study was conducted adhering to the tenets of the Declaration of Helsinki. We have also received the Ethics Review Exemption from Guangdong Provincial People’s Hospital, Guangdong Academy of Medical Sciences, for the research use of data and records that are all publicly available.
Ascertainment of cataract and hearing difficulties
In the UK Biobank, cataract cases were defined through linkage to self-reported cataract operation (Field id: 20,004, code 1435) or/and a hospital record including a diagnosis code based on ICD-10 (ICD-10: H25 or H26), in accord with earlier GWAS research on cataracts [16]. Controls were participants who reported no eye disorders.
Hearing difficulties cases of the UK Biobank were identified by four hearing traits, which showed statistically significant heritability (h2) in earlier GWAS research on hearing difficulties [18]. The four traits used to determine self-reported hearing difficulties are (1) “Do you find it difficult to follow a conversation if there is background noise (such as TV, radio, children playing)?” (Field id: 2257, background noise problems); (2) “Do you have any difficulty with your hearing?” (Field id: 2247, hearing difficulty/problems); (3) “Do you use a hearing aid most of the time?” (Field id: 3393, hearing aid user); (4) “Do you get or have you had noises (such as ringing or buzzing) in your head or in one or both ears that last for more than five minutes at a time?” (Field id: 4803, tinnitus). Self-reporting hearing difficulties has previously been used in extensive cohort studies [26, 27]. Hearing difficulties cases were also defined through a hospital record including a diagnosis code based on ICD-10 (ICD-10: H90 or H91), that were classified as conductive and sensorineural hearing difficulties; ototoxic hearing difficulties; presbycusis; sudden idiopathic hearing difficulties, etc. We defined hearing difficulties as a positive response to any of the above questions and hospital record.
In sensitivity analysis, subjects responded “Yes” to both “background noise problems” and “hearing difficulty/problems” identified to detect hearing difficulties. Additionally, patients who had undergone cataract surgery were excluded, thus mitigating the impact of ocular surgery on the outcomes.
Ascertainment of covariates
Demographic information included age, sex, and ethnicity (recorded as white and non-white). The ethnicity was self-reported and recorded as white and non-white (Asian, Black, Chinese, Mixed, or other ethnic groups), with the genetic ancestry of ‘White’ also confirmed by genotypes. Other covariates including educational qualifications, smoking, alcohol consumption, physical activity, and family history of severe depression were obtained through standardized questionnaires. Obesity was defined as BMI > 30 kg/m2. Diabetes mellitus, hypertension, and hyperlipidemia were defined by self-report, diagnoses, medications, or physical measurements. All demographic information is shown in Table S1.
GWAS data sets
Summary statistics for investigating the genetic architecture of cataract was from the previous GWAS meta-analysis (67,844 cases and 517,399 controls), combining results from Genetic Epidemiology Research in Adult Health and Aging (GERA) and the UK Biobank cohorts [16]. The GERA project is a cohort of over 110,000 adult members participating in the Kaiser Permanente Medical Care Plan, Northern California Region, Research Program on genes, environment, and health.
Summary statistics for hearing difficulties were from the previous multi-trait analysis of hearing-related traits in the UK Biobank (n = 323,978), which supported 31 risk loci for hearing difficulty [18]. The multi-trait analysis was performed based on the above four hearing-related traits (background noise problems, hearing difficulty/problems, hearing aid user, and tinnitus), which had significant heritability. Individuals in all studies were predominantly of European ancestry, and detailed descriptions of sample recruitment and subsequent GWAS analyses are available in the original publications.
Statistical analysisPhenotypic analysis
Continuous variables were reported as mean (standard deviation) and compared through unpaired t-tests. Categorical variables were reported as numbers and percentages and compared through Pearson’s chi-square test. A matching process based on propensity score was done to equalize all potential prognostic factors mentioned above and to formulate a balanced 1:1 matched cohort study. Logistic regression models were used to estimate the adjusted OR and their 95% CI, adjusted for age and gender (model 1), or additionally adjusted for ethnicity, Townsend index, educational attainment, smoking, alcohol consumption, obesity, physical activity, and history of hypertension, diabetes, hyperlipidemia (model 2). All P values were two-sided, and a P value < 0.05 was considered significant. Analyses were performed using Stata version 13 (version 14.0; StataCorp).
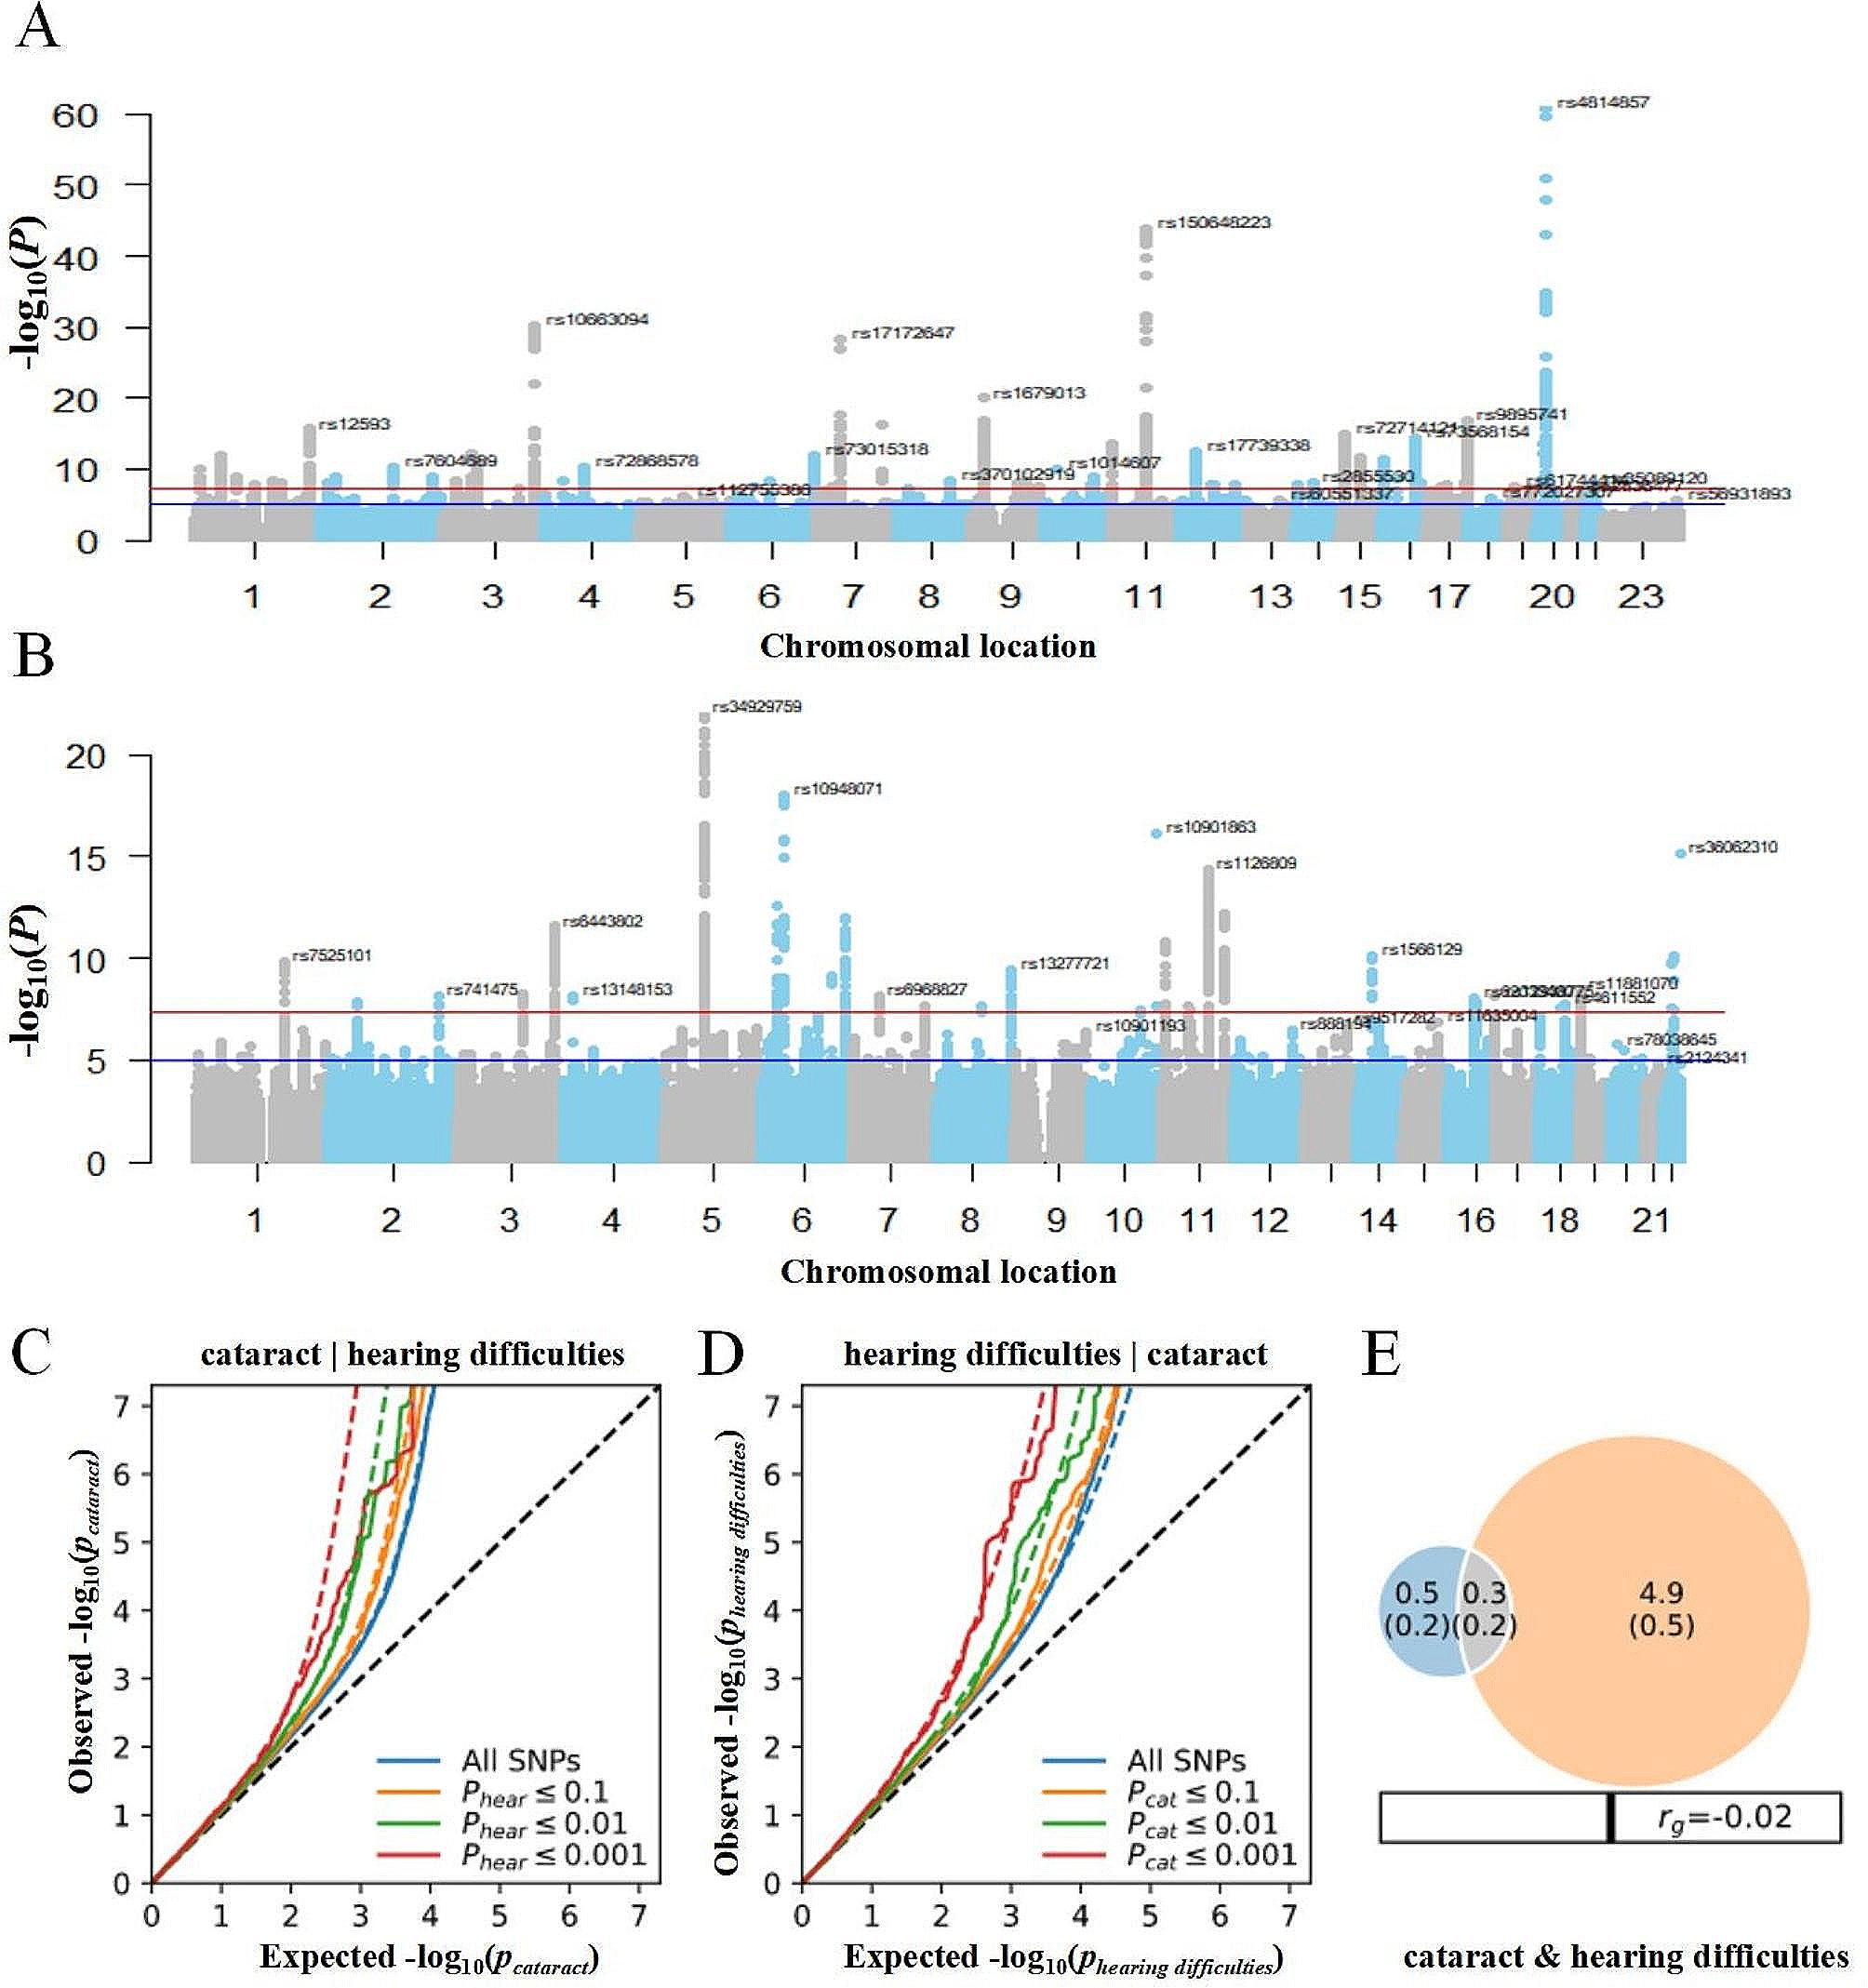
Conditional quantile-quantile (QQ) plots
We constructed conditional QQ plots to visualize the putative overlap in SNPs between cataract and hearing difficulties after excluding SNPs within four regions with complex LD patterns (major histocompatibility complex regions: chr6:25119106–33,854,733; 8p23.1: chr8:7200000–12,500,000; the MAPT region: chr17:40000000–47,000,000; and the apolipoprotein E region: chr19:44909039–45,912,650) [28]. Enrichment exists when the proportion of SNPs associated with a primary phenotype (e.g., cataract) increases as a function of the strength of the association with a secondary phenotype (e.g., hearing difficulties) [24]. Each QQ plot reveals the distribution of P values for the primary phenotype conditioning on the significance of association with the secondary phenotype at P < 0.10, P < 0.01, P < 0.001, and P < 0.0001.
MiXeR
Polygenic overlap between cataract and hearing difficulties, irrespective of genetic correlation between selected phenotypes, was evaluated by MiXeR [22]. Based on the Akaike information criterion, MiXeR evaluated model fitting based on the power of existing summary statistics. First, we constructed a univariate mixture model to estimate the number of disorder-influencing variants. Next, we performed a bivariate model additive genetic associations with two traits as a mixture of 4 bivariate Gaussian components, (i) SNPs not influencing either phenotype; (ii & iii) SNPs uniquely influencing either the primary or secondary phenotype; and (iv) SNPs influencing both phenotypes. Last, we used MiXeR to calculate a Dice coefficient, a ratio of shared variants to the total number of variants, to evaluate the polygenic overlap. Results were presented as Venn diagrams displaying the proportion of unique and shared SNPs.
Conditional and conjunction false discovery rate
The conditional/conjunctional false discovery rate (cond/conjFDR) approach was applied to increase genetic discovery power and identify specific shared loci between cataract and hearing difficulties [23]. Like standard GWAS analysis, the condFDR/conjFDR method does not operate on a causal level but identifies LD proxies of the underlying causal variants. In pleiotropy analysis, FDR reflects the possibility of non-pleiotropy for an SNP. The condFDR approach builds on Bayesian statistics and increases the power to identify loci associated with a primary phenotype (e.g., cataract) by leveraging associations with a secondary phenotype (e.g., hearing difficulties) [29]. Thus, this method re-ranks test statistics using the associations between variants and the secondary phenotype and re-calculates the associations between these variants and the primary phenotype. Inverting the roles of primary and secondary phenotypes yields the inverse condFDR value. ConjFDR is an extension of condFDR and can detect loci jointly associated with two phenotypes [30]. After repeating condFDR for both traits, we applied conjFDR analysis to identify shared genetic loci between cataract and hearing difficulties. ConjFDR is defined as the maximum of the two condFDR values, providing a conservative estimate of the false discovery rate for an SNP association with both phenotypes. We examined the significance and directionality of allelic association for identified loci in independent cohorts using lead SNPs. Overall, FDR thresholds of 0.01 and 0.05 were chosen for conditional and conjunctional FDR, respectively, consistent with previous publications [24, 31].
Genomic loci definition and functional annotation
The results of each analysis were filtered as follows [31]. First, we filtered the lists of significant SNPs by their LD structure (r2-value) as observed in the 1000 Genomes dataset and report only the most significant result per annotated gene. We considered an SNP an independent finding if LD r2 < 0.2 with all other SNPs. Second, we further filtered the list of significant SNPs for novelty. A locus that was not physically overlapping with findings from the original GWASs or National Human Genome Research Institute–European Bioinformatics Institute GWAS Catalog (https://www.ebi.ac.uk/gwas/home) was considered novel. Candidate SNPs were functionally annotated to characterize their biological significance and highlight putative causal genes. Genes were mapped using three strategies: (i) positional mapping: to genes within 10 kb distance; (ii) expression quantitative trait locus (eQTL) mapping; and (iii) chromatin interaction mapping: to genes with which they are predicted to interact by 3D modeling of chromatin structure physically [32].
To gain insights into the biological mechanisms, we checked the putative genes for any known association with cataract or hearing difficulties within public expression datasets obtained from the NCBI GEO (https://www.ncbi.nlm.nih.gov/geo/). From NCBI GEO, we interrogated the microarray and RNA-seq datasets of human eye and human lens cells (GSE3023 and GSE2256) and microarray data from cochlear inner and outer hair cells from mice (GSE56866). Previous GWAS studies have well illustrated considerations for using mouse cochlea rather than human for hearing difficulties [18] and discussed in the limitation. Differential expression for each dataset was interrogated using the GEO2R software using a moderated t statistic.


留言 (0)