Cell lines and cell culture
E14 mouse embryonic stem (ES) cells were purchased from ATCC and were maintained in the ESC medium containing KnockOut Dulbecco’s Modified Eagle Medium (DMEM, #10829018, Gibco), 10% bovine serum (FBS), l-glutamine (25030-081, Invitrogen), non-essential amino acids (#11140050, Gibco), penicillin/streptomycin (10378016, Gibco), and 2-mercaptoethanol and supplemented with Leukemia Inhibitory Factor (LIF, Sigma). Mouse embryonic fibroblasts (MEFs) were cultured from fetal mice and maintained in DMEM (#11965092, Gibco) containing 10% FBS, non-essential amino acids (#11140050, Gibco), and penicillin/streptomycin (10378016, Gibco). Human embryonic stem cell line (hESC) H9 and human iPSC line C11 [28] were cultured in mTeSR™1 media (#100–0276, STEMCELL Technologies) on tissue culture plates coated with Matrigel (#356234, BD Bioscience). Human fibroblast cell line SPF7 [29] was cultured in DMEM (#11965092, Gibco) containing 10% FBS, l-glutamine (25030-081, Invitrogen), non-essential amino acids (#11140050, Gibco), and penicillin/streptomycin (10378016, Gibco).
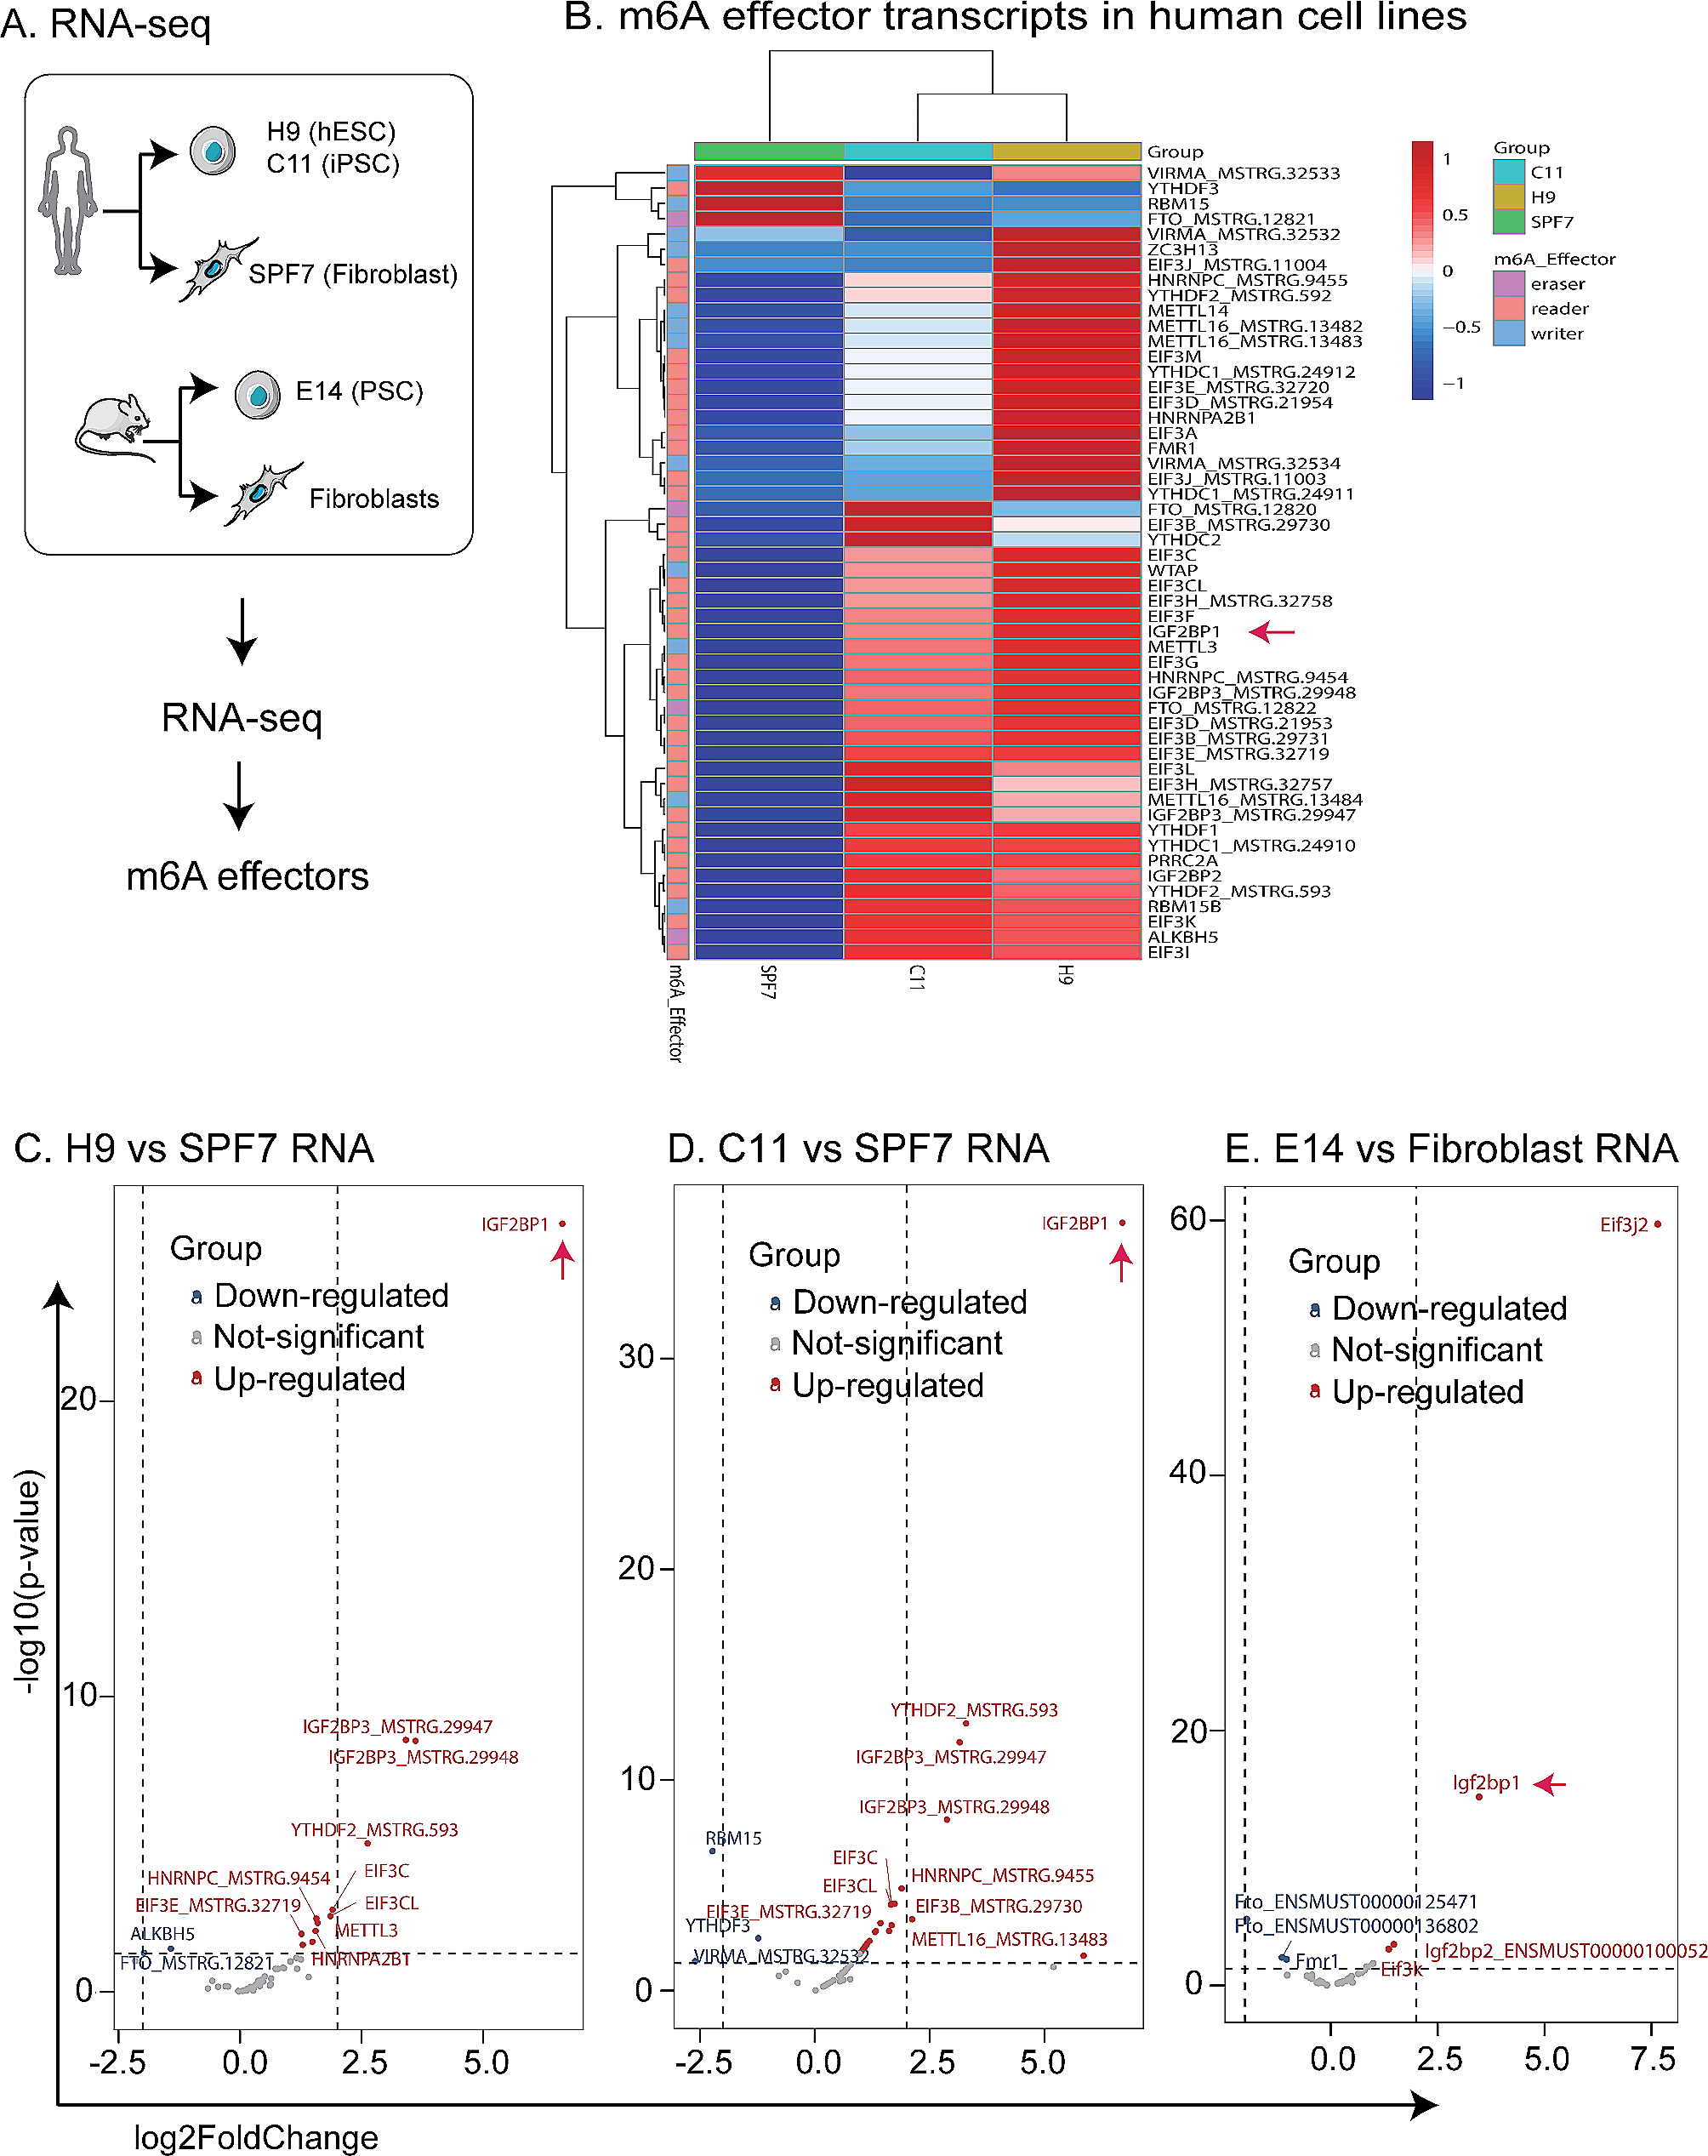
RNA-seq to identify the expression of m6A effectors
Total RNA was extracted by TRIzol reagent (#15596026, Invitrogen) from human and mouse iPSCs and fibroblasts. The indexed libraries were prepared using Illumina’s TruSeq RNA Sample Prep Kit v2. Paired-end sequencing in triplicate was performed by Jilin Epigenomes Biotechnology (Jilin, PRC) using a HiSeq4000 (Illumina). After Seqtk filtering, clean reads for E14, mouse fibroblasts, H9, C11, and SPF7 were mapped to the human genome (genome version: GRCh38/hg38) and mouse genome (genome version: GRCm38.p4/mm10) for mRNAs and lncRNAs using the STAR software [30]. Gene counts were normalized to the values of Fragments Per Kilobase of transcript per Million mapped reads (FPKM). Cuffdiff was used to calculate the differentially expressed RNAs when the fold-change was > 2 and P < 0.05 with an unpaired two-sided t-test.
RNA-seq data analysis
Differentially expressed genes were identified using the DESeq2 package in R language [31] with |log fold change (FC)| >1 and a false discovery rate (FDR) cutoff of 0.05 as the threshold value. The ggplot2, heatmap, and volcanoplot packages were used to visualize DEGs: red dots indicate up-regulation and blue dots indicate down-regulation in the volcano plot; different colors in the heatmap represent the trend of m6A effector expression in different cell lines.
We also collected and summarized the RNA-seq data of GSM1706720, which covers six human samples, including two fibroblast cell lines, two ESC lines (H9 and H7), and two hiPSCs [32]. The ggplot2 and heatmap were used to visualize DEGs.
Real-time RT-PCR (qPCR)
Total RNA was isolated from cells using TRIzol (#15596026, Invitrogen) and then stored at − 80 °C. The cDNA generation was performed with a Bio-Rad Thermol Cycler using PrimeScript™ RT Master Mix (#RR036B, TAKARA). The qPCR was performed using 2x Sybr qPCR Super Mix (#TBS4001R-10, Tribo science) as previously described. The target amplification was performed by RT-PCR of 1 cycle at 95 °C for 2 min; 40 cycles at 95 °C for 15s, and 60 °C for 30s; and dissociation stage. The threshold cycle (Ct) values of target genes were assessed by quantitative PCR in triplicate using a sequence detector (ABI Prism 7900HT; Applied Biosystems) and were normalized over the Ct of the β-actin as control. The primers used in our study were listed in Additional file 1: Table S1.
Western blot analysis
Whole-cell proteins were isolated from human and mouse stem cells and fibroblasts using RIPA lysis buffer (10% SDS, 1 mM DTT, and glycerin) and 3X Blue Loading Buffer (#7722S, CST). Protein samples were incubated with the following primary antibodies in 5% bovine serum albumin (BSA): anti-IGF2BP1 (1:1000 dilution, #ab184305, ABCAM), anti-IGF2BP2 (1:1000 dilution, #ab128175, ABCAM), anti-IGF2BP3 (1:1000 dilution, #ab177477, ABCAM), anti-YTHDF3 (#ab220161, ABCAM), anti-RBM15B (#ab300467, ABCAM), anti-SOX2 (1:1000 dilution, #ab97959, ABCAM), anti-OCT4 (1:1000 dilution, #ab19857, ABCAM), anti-NANOG (1:1000 dilution, #ab109250, ABCAM), and anti-β-actin (1:1000 dilution, #66009-1-Ig, Proteintech). Secondary antibodies were HRP-linked goat anti-mouse (1:1000 dilution, #ab6789, ABCAM), goat anti-rabbit (1:1000 dilution, #ab205718, ABCAM). Protein expression was assessed by NcmECL Ultra (#P10300, NCMbiotech) and detected on ChemiDoc MP Imaging System (#12003154, Bio-Rad). (Table 1)
Table 1 antibody list for western blot analysisKnockdown of IGF2BPs by siRNA
IGF2BPs siRNA were purchased from GenePharma (Shanghai GenePharma Co., Ltd, China). The siRNAs specific for IGF2BP1 mRNA (IGF2BP1-1, 5\(\prime\)-GCUCCCUAUAGCUCCUUUATT-3\(\prime\); IGF2BP1-2, 5\(\prime\)-GGGAAGAGCUGGAGGCCUA-3\(\prime\); IGF2BP1-3, 5\(\prime\)-UGAAUGGCCACCAGUUGGA-3\(\prime\)), IGF2BP2 mRNA (IGF2BP2-1, 5\(\prime\)-AGAAGUGAAGCUGGAAGCG-3\(\prime\); IGF2BP2-2, 5\(\prime\)-GCUGAUAGUUGGAGCAUUU-3\(\prime\); IGF2BP2-3, 5\(\prime\)-GGGAAGAUGUUAAGAUAUG-3\(\prime\)), and IGF2BP3 mRNA (IGF2BP3-1, 5\(\prime\)-AUGUAACCUAUUCCAGUAA-3\(\prime\); IGF2BP3-2, 5\(\prime\)-UAAGGAAGCUCAAGAUAUA-3\(\prime\); IGF2BP3-1, 5\(\prime\)-GAGCAAGACACAGACACUA-3\(\prime\)), and the scrambled siRNA control is 5\(\prime\)-UUCUCCGAACGUGUCACGUTT-3\(\prime\). H9 and C11 cell lines were transfected with siRNAs using jetPRIME transfection reagent (#19Y0301L14, Polyplus transduction) according to the manufacturer. 24 h after transfection, cells were incubated with the fresh complete medium for another 48 h before protein and mRNA analysis.
Lentivirus production and infection
Lentiviral inducible shIGF2BP1 cells were obtained by transduction of pLKO.1 puro (plasmid #8453, Addgene), containing either the shRNA or the shNC. The sense strands of shIGF2BP1-1 and shIGF2BP1-2 that we used are 5\(\prime\)-CCGGTGAAGATCCTGGCCCATAATACTCGAGTATTATGGGCCAGGATCTTCATTTTTG − 3\(\prime\) and 5’- CCGGGCAGTGGTGAATGTCACCTATCTCGAGATAGGTGACATTCACCACTGCTTTTTG − 3’. All the constructs were verified by sequencing. All transfection experiments were performed using Lipofectamine 2000 (#11668019, Thermo Fisher) and the production of lentivirus supernatant was described previously. The efficiency of gene silencing was evaluated at 24- and 48-hours post-transfection by real-time qPCR, and at 72 h by Western blot analysis.
IF of stem cell markers
IF was used to examine the expression and location of the stem gene proteins (SOX2 and OCT4) in stem cells. Briefly, cells were fixed by freshly made 4% paraformaldehyde for 10 min at room temperature, permeabilized with freshly made 0.5% v/v Triton X-100/PBS on ice for 5 min, then blocked in 1% w/v BSA for 30 min at room temperature. After incubation with primary antibodies diluted in 1% BSA overnight at 4 °C, samples were washed three times in PBST for 5 min each. The following antibodies were used in the immunostaining: rabbit anti-SOX2 (1:100 dilution, #ab97959, ABCAM), anti-OCT4 (1:100 dilution, ab19857, ABCAM). The cell samples were subsequently incubated with Alexa Fluor 647-labeled goat anti-rabbit IgG(H + L) secondary antibodies (1:500, #A0468, Beyotime) for 1 h at room temperature. After washing three times with PBS, samples were counterstained with DAPI (D1306, Invitrogen). Fluorescence images were acquired with a confocal laser scanning microscope (#FV3000, Olympus).
eCLIP data analysis
We collected the IGF2BPs eCLIP dataset GSE78509 based on GPL11154 platform (Illumina HiSeq 2000) [33]. The protein-RNA complexes in H9 cells were immunoprecipitated using IGF2BP1-3 antibodies and rabbit IgG [33]. Besides, a parallel Size-Matched Input (SMInput) library was generated as the control without any anti-RNA binding protein (anti-RBP) antibodies [33]. The raw data were downloaded from GEO and then processed in R language. eCLIP-seq was analyzed by gene enrichment analysis for GO (http://geneontology.org) and KEGG (https://www.genome.jp/kegg/) using DAVID v6.8 (https://david.ncifcrf.gov/). Enriched pathways were identified according to FDR ≤ 0.05.
m6A-IP data analysis
To analyze the m6A methylome of stem genes RNA in stem cells, we collected the m6A-IP dataset GSE54365 based on GPL16791 platform (Illumina HiSeq 2500). We selected a dynamic system wherein human fibroblasts undergoing reprogramming into iPSC following doxycycline-induced expression of polycistronic OCT4-KLF4-MYC-SOX2, and hESCs were used for further analysis. Eight samples were involved including GSM1339395 human_hESC, GSM1339396 human_hESC_input, GSM1339407 human_OKMSiPSC (fibroblasts fully reprogrammed into iPSC), GSM1339408 human_OKMSiPSC_input, GSM1339403 human_OKMSfibroplusDox (5 days post-induction with Dox), GSM1339404, human_OKMSfibroplusDox_input, GSM1339405 human_OKMSfibrominusDox (5 days after not inducing with Dox), GSM1339406 human_OKMSfibrominusDox_input [34]. Integrative Genomics Viewer (IGV) was used to analyze the m6A modification of stem genes (including SOX2, OCT4, NANOG, and KLF4).
Quantitative mass spectrometry data anlaysis
We collected quantitative mass spectrometry data from five samples IMR90_Fibro (IMR90 fetal fibroblasts), 4Skin_Fibro (foreskin fibroblasts), IMR90_iPS (human iPSCs through the reprogramming of IMR90 fetal fibroblasts), 4Skin_iPS (human iPSCs through the reprogramming of foreskin fibroblasts), and hESCs (HES-3) [35]. After calculating the hESCs/hiPSCs and Fibroblasts/hiPSCs, the heatmap and ggplot2 packages were used to visualize DEGs. Correlation analysis was conducted between m6A effectors and stem genes (including SOX2 and OCT4).
IGF2BP1 cross-linking immunoprecipitation (CLIP)
UV-crosslinked C11 cells were lysed in CLIP lysis buffer and sonicated. Anti-IGF2BP1 (#8482, CST) and rabbit IgG (#2729, CST) were used to immunoprecipitated IGF2BP1-RNA complexes, respectively. Meanwhile, an aliquot was saved as the input without anti-RBP antibodies. After reverse crosslinking, RNAs were purified and reverse transcripted. Enrichment of the IGF2BP1-binding cDNAs was quantitated by qPCR. The specific gene primers were listed in Table S3.
m6A-RNA immunoprecipitation (RIP)
C11 cell line was collected and lysed by lysis buffer for RIP. The cell extract was incubeated with magnetic beads cojugated with anti-m6A antibodies (#ab208577, ABCAM) or mouse lgG (#SC-2025, Santa cruz Biotechnology), respectively. The m6A modified RNA was immunoprecipitated after protein digestion by proteinase K. After purification and reverse transcription, enrichment of the m6A modified cDNAs was quantitated by qPCR using target gene primers (Table S3).
Statistical analysis
All numerical data are presented as mean ± standard deviation of triplicate assays. The statistical significances were determined using Student’s two-tail t-test, where p < 0.05 was considered statistically significant. In all figures, the statistical significances were indicated with * if P < 0.05 or ** if P < 0.01.


留言 (0)