All the chemicals and reagents used were of analytical grade. Amphetamine and Hydralazine were purchased from Sigma-Aldrich, Mumbai, India. All drug solutions were freshly prepared in saline water before each experiment. Concentrated sulfuric acid, potassium bismuth iodide, Wagner reagent, Hagers reagents, sodium hydroxide, copper sulfate, hydrochloric acid, hydrogen peroxide, 4-aminoantipyrine, 4-chlorophenol, phosphotungstic acid, sodium dihydrogen phosphate, citric acid, potassium sulfate, and trichloracetic acid were purchased from Deshpande Laboratories Pvt Ltd, Bhopal, India.
Collection and authentication of plant material
The whole plant of Paederia foetida was collected and dried in 2022 from Bankura, West Bengal, India, with the GPS coordinates of 22°59′51.7’’N 87°OO’39.4’’E. The plant was authenticated by department of Botany, Bankura Christian College, West Bengal, India. The whole plant was shade-dried under room temperature and grinned to a fine powder.
Preparation of extraction
A whole plant powder (100 g) of Paederia foetida was extracted by maceration in 400 mL of ethanol for 14 days with frequent agitation. The mixture was filtered through clean muslin cloth followed by double filtration with Whatman No. 1 filter paper and the filtrate was concentrated by rotary evaporator with the vacuum at 50 ºC, poured into glass Petri dishes, and brought to dryness at 60ºC oven.
Phytochemical screening of different extract
Preliminary phytochemical screening was performed to identify the phytoconstituents present in the extracts. Phytochemical tests, such as Molish test, Dragendroff test, Mayers test, Wagner test, Hager test, Biuret test, Million test, ferric chloride test, lead acetate test, gelatin solution test, Shinoda test, alkaline reagent test, Legal test, Bajlets test, and Liebermann-Burchard test, were performed to determine the carbohydrates, alkaloids, proteins, tannins, flavonoids, glycosides, saponin, and steroids from ethanolic extract of Paederia foetida.
Procurement of animals
The experiments were carried out according to the guidelines of the CPCSEA, New Delhi, India. The study protocol was approved by the Institutional Animal Ethical Committee of Aditya Bangalore Institute of Pharmacy Education and Research Bangalore, Karnataka, India ( approval number: 64/1611/CPCSEA). Female Wistar rats (Wistar strain) weighing between 150 and 200 g were obtained from local vendor, Bangalore, Karnataka. Animals were housed into five groups under standard laboratory conditions, i.e., 25 °C ± 1 °C/45–55% RH and 12/12 h light and dark conditions in the animal house of Aditya Bangalore Institute of Pharmacy Education and Research, Bangalore, Karnataka, India. The rats are kept with free access to food (Hindustan Lever, India).
Antihypertensive activity
The rats were divided into five groups and each group contain six rats (n = 6). Group I was for positive control, received 0.9% saline p.o, group II marked for negative control, and received Amphetamine 5 mg/kg/day, (i.p.). Groups III and IV were allocated as test 1 and test 2 and received Amphetamine (5 mg/kg/day, i.p.) along with Paederia foetida (200 mg/kg/day, p.o.) and Amphetamine (5 mg/kg/day, i.p.) along with Paederia foetida (400 mg/kg/day, p.o.) for 4 weeks, respectively. Group V was marked as standard and received Amphetamine (5 mg/kg/day, i.p.) and Hydralazine (25 mg/kg., i.p.).
Blood pressure monitoring
Blood pressure was determined by placing an animal in the supplied restrainer. The tail-cuff warming chamber was attached and selected the number of test cycles and then pressed auto-calibrate to run. The tail-cuff method required the minimum amount of heat to measure blood pressure.
Noninvasive method of blood pressure determination
The cuff consists of latex balloon measuring 5 cm × 2 cm with 0.5 mm thickness. This balloon was placed in a circular plastic case having a diameter of 23 mm with a central hole of 12 mm diameter. The balloon was kept in such a manner that it remains in contact with the inner surface of the plastic case around the central hole so that this balloon encircles the tail. One end of the triway was connected with the balloon (tail-cuff) and the other two ends were connected to an inflating–deflating pump and sphygmomanometer. The system measured the systolic BP by determining the cuff pressure (reflected on the sphygmomanometer) and the blood flow (pulse) to the tail was eliminated. This elimination of blood flow (pulse) was recorded by a pulse transducer connected to a single-channel physiograph through a suitable coupler. The animals were acclimatized and kept in restrainers. The tail was passed through the hole of the newly designed cuff and the pulse transducer was tied around the tail distal to the cuff. As the system was switched on and the pulse was recorded on the physiographic paper. The cuff was inflated by the pump and the pressure in the cuff was raised until the pulse was eliminated. The pressure at which the pulse was eliminated, and noted as the systolic BP of the animal. The systolic BP and pulse were also recorded by the NIBP system of ADI for comparison.
Estimation of electrolytesMethod for assessment of serum electrolyte
Wistar rats were used for the biochemical analysis of serum. The rats were provided with the usual diet and the blood samples were collected for the determination of the amount of electrolytes present in blood (Na+, K+).
Sodium and potassium ion estimation
Sodium and potassium determination was performed in an automated Roche 9180 electrolyte analyzer (Basel, Switzerland). The 2 ml of blood samples was collected from rats through retro-orbital plexus after anesthetizing through a diethyl ether inhaler. The blood samples were kept for 30 min then centrifuged in a cooling centrifuge at 5000 rpm for 10 min to obtain the serum. The calibration of the instrument was performed, then run a control sample as mentioned. Finally, the serum sample was run to obtain the results.
In silico analysisLigand and protein preparations
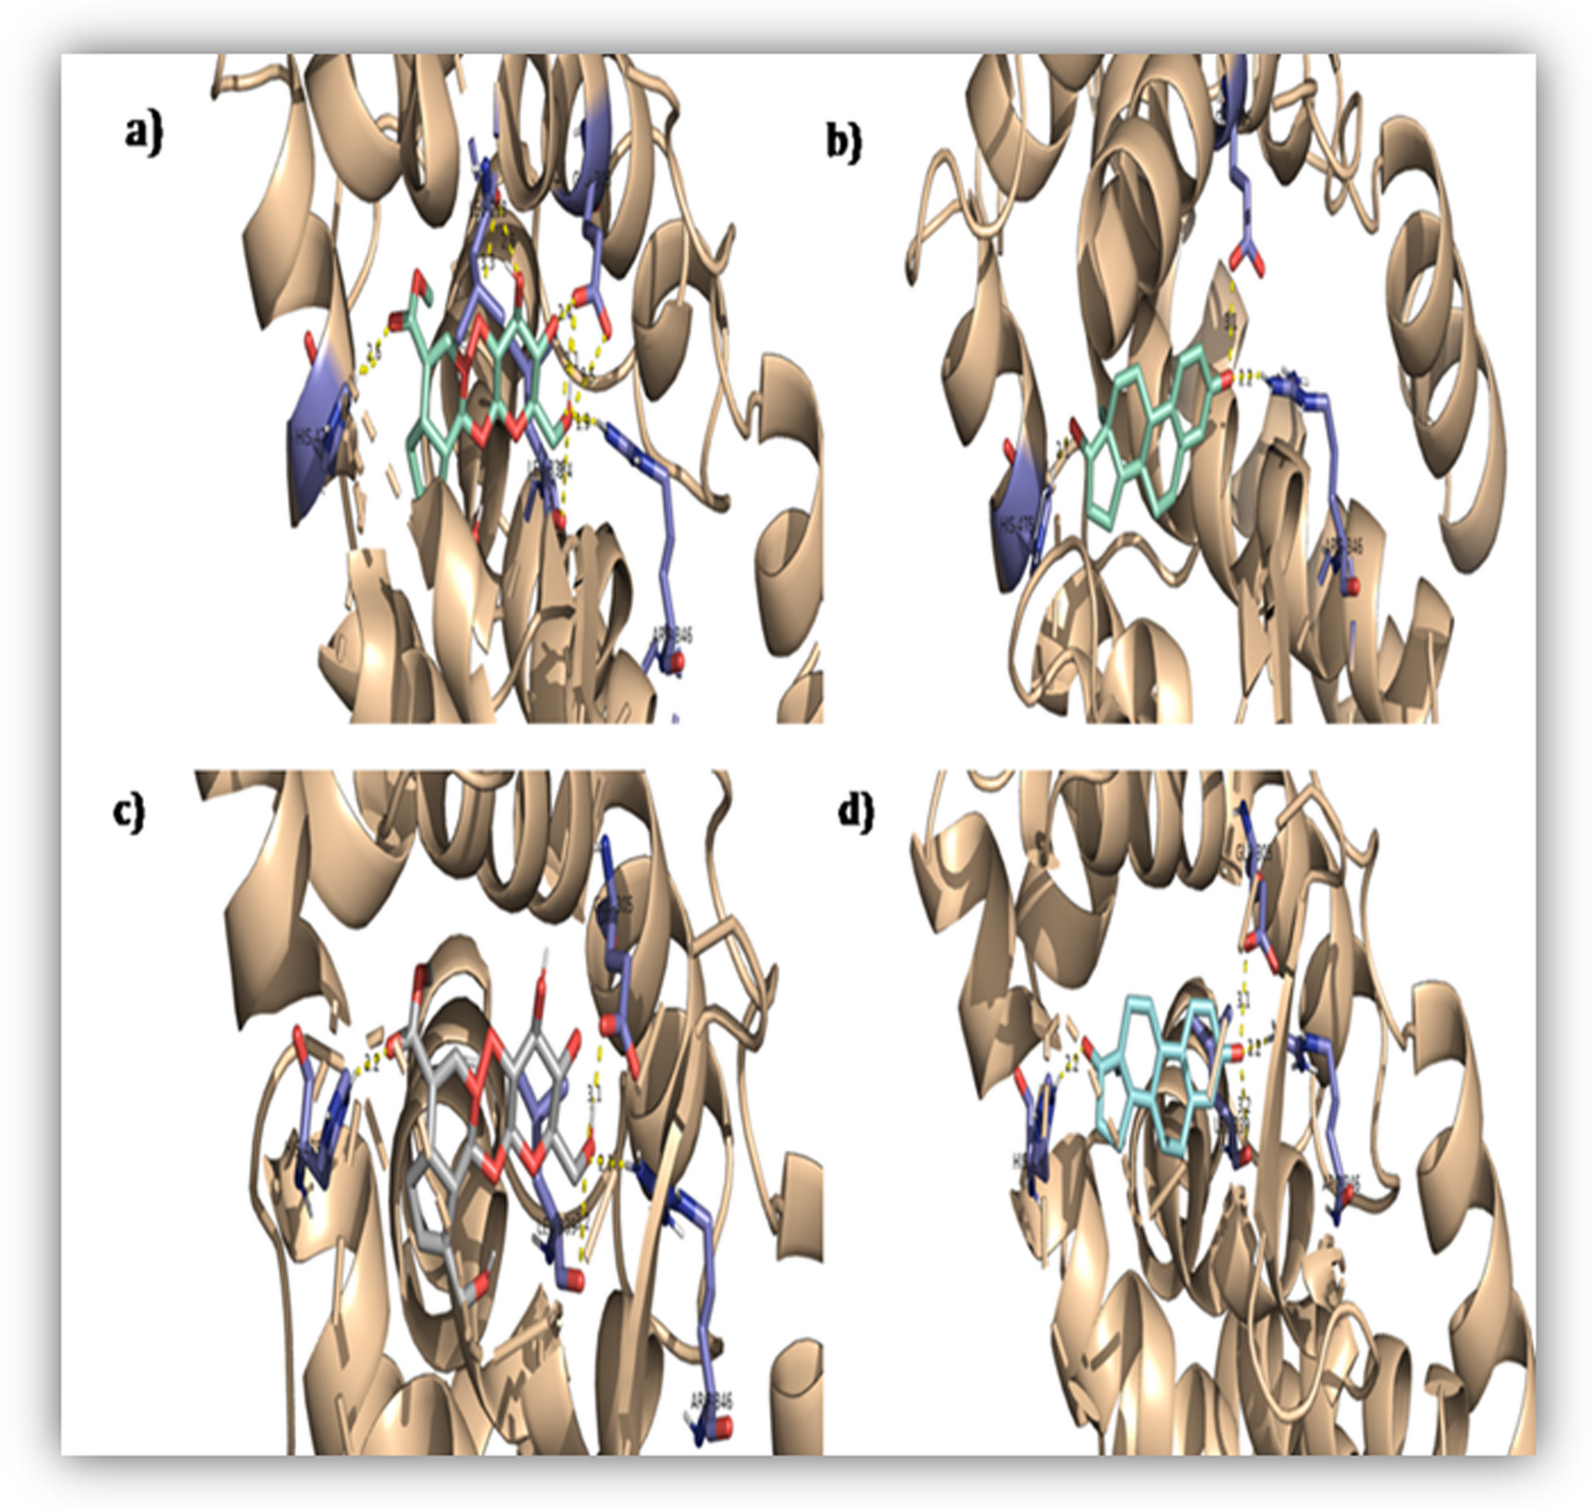
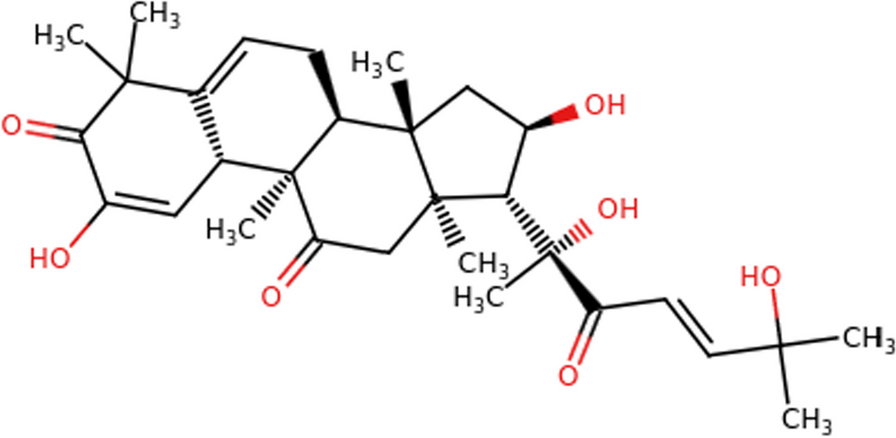
The selected compound Geniposide and Estradiol (Internal ligand) were utilized for the molecular docking analysis for estrogen receptors. The three-dimensional structures of Geniposide and Estradiol were acquired from the PubChem database (https://pubchem.ncbi.nlm.nih.gov) (accessed on 20 April 2023) in SDF MOL format. The SDF MOL format was converted into PDB format by using OpenBableGUI 3.1.1 software. Three-dimensional structures (mainly crystal) of different PDB ID like 3OLL [40], 3OLS [40], 5DX3 [41], 5DXE [41], and 6PIT [42] were chosen for the investigation acquired from RCSB Protein Data Bank (PDB). 3OLL-Crystal structure of phosphorylated estrogen receptor beta ligand binding domain, 3OLS-Crystal structure of phosphorylated estrogen receptor beta ligand binding domain, 5DXE-Estrogen Receptor Alpha Ligand Binding Domain Y537S Mutant in Complex with Stapled Peptide SRC2-P4 and Estradiol, 5DX3-Estrogen Receptor Alpha Ligand Binding Domain Y537S Mutant in Complex with Stapled Peptide SRC2-P3 and Estradiol & 6PIT-Estrogen Receptor Alpha Ligand Binding Domain Y537S Mutant in Complex with SRC2 Stapled Peptide 41A and Estradiol. The process of getting ready the proteins involved accessing the PDB ID to retrieve the protein from the server, uploading the molecule, adding hydrogens, applying specific turning to residues, examining interactions and geometry for all atoms, and acquiring the finished protein file. Estradiol was isolated from the protein's binding pocket as an internal ligand to reveal the grid coordinates throughout the active region. The stabilized structure was stored after being downloaded from the server in PDBQT format for the purpose of protein–ligand docking.
Molecular docking of protein and ligand
The Autodock-4.2.6 program (ADP) was used to carry out molecular docking of Geniposide & Estradiol with estrogen receptors. ADP tools were used to prepare the protein and ligands. The coordinate values used in grid settings were acquired from re-docking studies, and the dimensions of the grid box were 60 × 60x60 in the x, y, and z directions. In each case, the spacing of the grid point was 0.375". Auto grid-4.2 was utilized to create the map files. For search criteria, a genetic algorithm (GA) was employed. Autogrid and Autodock operation were the last step of docking analysis and were performed in Autodock-4.2.6. The molecular docking of individual ligands on the appropriate protein was carried out using Autodock-4.2 and Autogrid-4.2, respectively. Interactions between molecules and binding energy (kcal/mol) were measured and analyzed.
ADME profile
The Swiss ADME online server (http://www.swissadme.ch/index.php) was used to assess the drug-likeness patterns and pharmacokinetic characteristics of the investigated compounds, where SMILES format of the compounds was uploaded to the webpage and the assessment procedure was completed.
Toxicity profile
The ProTox-II online server (https://tox-new.charite.de/protox_II/index.php) was used to predict the toxicities of the investigated compounds, where SMILES format of the compounds was uploaded to the webpage and the assessment procedure was completed.
Molecular dynamic simulation
Molecular dynamics (MD) simulation was carried out using GROMACS 2022.2. The following steps were utilized.
(a) Preparation of enzyme
The 3-dimensional (3D) models of the Estrogen receptor in complex with Geniposide were exported to PDB format using Pymol. The dynamic behavior of the complex was evaluated using molecular dynamic (MD) simulation in the GROMACS package program (version 2022.2) [43,44,45]. Protein topology was constructed by pdb2gmx with the CHARMM27 force field [46], and ligand topology was generated using the SwissParam server [47].
(b) Setting up a system for simulation
After applying the force field, the complex was inserted into the system. It was solvated with the TIP3P water model [48] in a cubic box greater than 1 nm from the edge of the protein with periodic boundary conditions. The system was neutralized by adding Na + ions, and energy minimization was done for 50,000 steps using the steepest descent algorithm. It was then followed by 100 ps of NVT simulation at 300 K and 100 ps of NPT simulations to equilibrate the whole system. The Leapfrog algorithm was employed in the constant-temperature, constant-pressure (NPT) ensemble to separately couple each component like protein, ligand, water molecules, and ions [49]. The Berendsen temperature and pressure coupling constants were set to 1 and 2, respectively, to keep the system in a stable environment (300 K temperature and 1 bar pressure) [50]. Finally, MD simulation for 100 nswas performed in isothermal and isobaric condition ensemble at 300 K. The pressure coupling with time-constant was set at 1 ps to maintain pressure constant at 1 bar, and the LINCS algorithm [51] was used to constrain the bond lengths. The Van der Waals and Coulomb interactions were truncated at 1.2 nm, and the PME algorithm [52] inbuilt into GROMACS was used to minimize the error from truncation.
(c) Visualization and analysis of simulation
The trajectory file was visualized through VMD (Visual Molecular Dynamics) 1.9.2 [53] and analyzed by the tool Hero MD Analysis [54, 55] and Xmgrace 5.1.25 [56, 57].


留言 (0)