
記住我


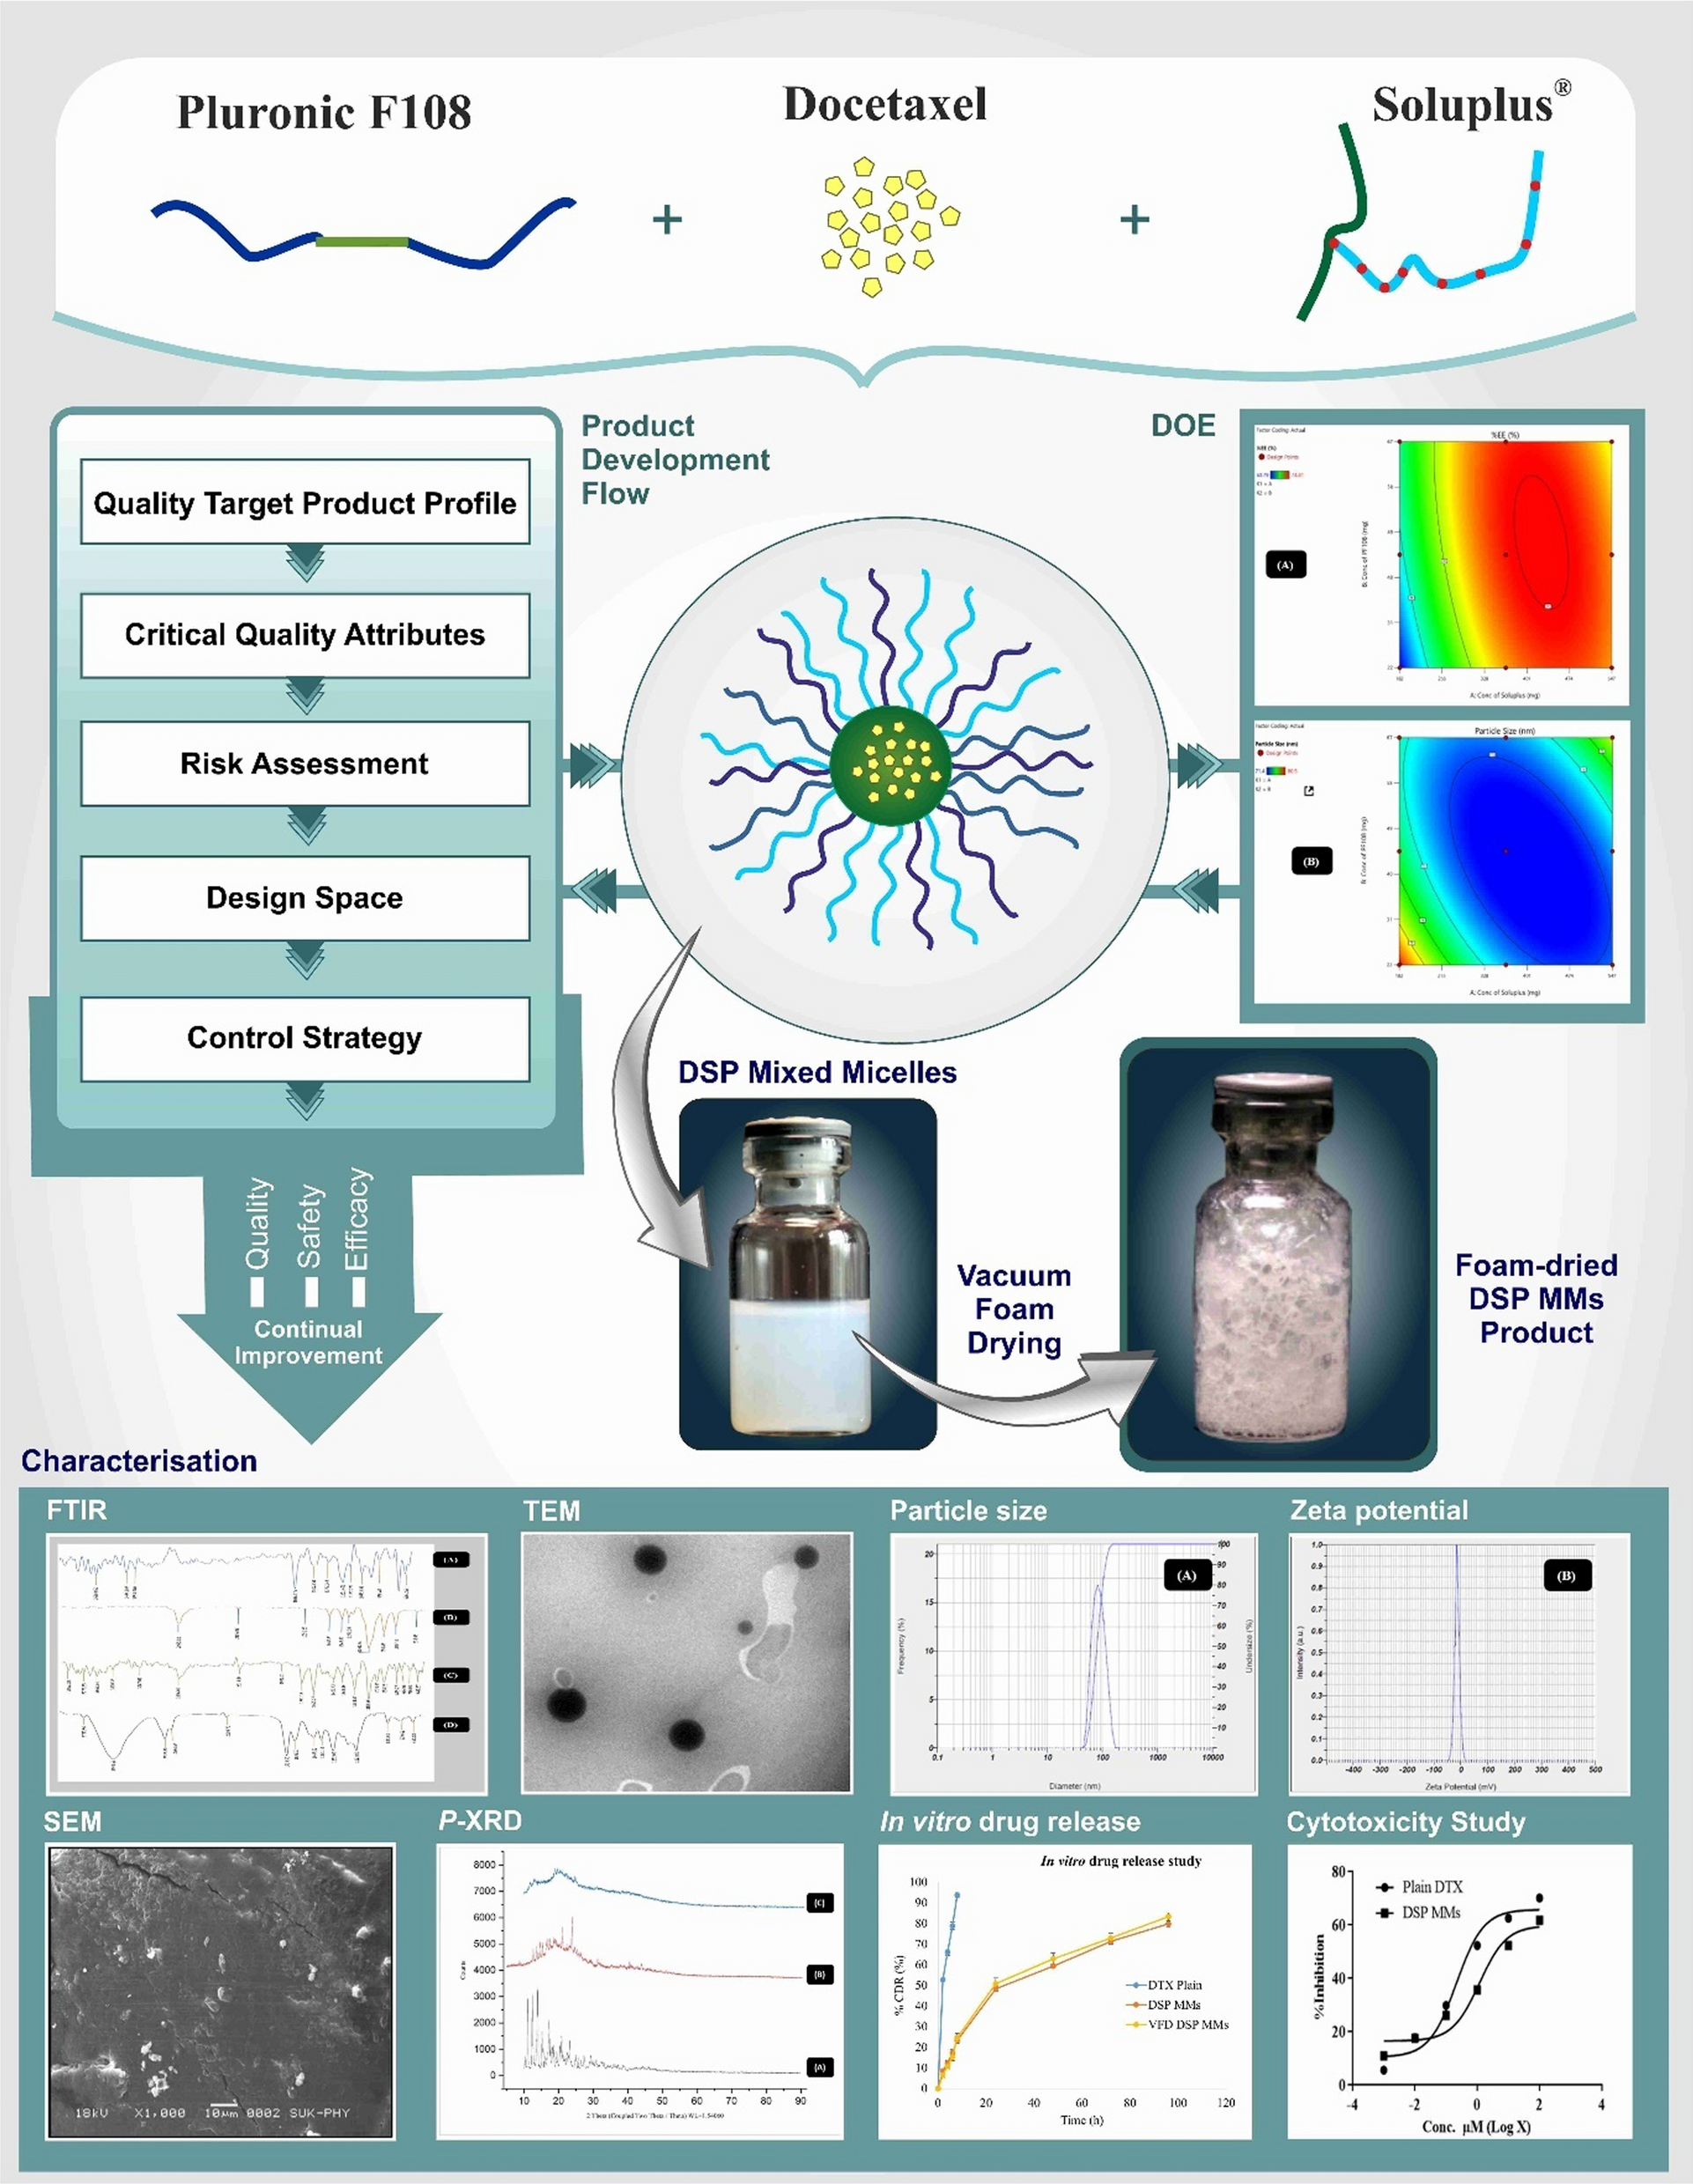
This research aimed to prepare DSP MMs containing Soluplus® and PF108 by leveraging the essential properties of the excipients. The additional application of VFD was employed to overcome various challenges associated with previous methods. Soluplus®, a novel polymer renowned for its exceptional solubilization properties, particularly for poorly soluble APIs, was combined synergistically with PF108. The selection of PF108 was based on its outstanding foaming capacity, strategically intended for use in the novel VFD process. Simultaneously, Soluplus® was chosen strategically to facilitate the solubilization of the drug and achieve the formation of mixed micelles (MMs) with a size below the accepted threshold of 100 nm.
CMC of polymers and mixtureIn this study, the iodine UV–visible spectrophotometric method was used to determine the CMC. Iodine served as a hydrophobic probe, and its conversion from I3 to I2 in the solution indicated the formation of micelles. This method is preferred over the cloud point method, because the reliability of the cloud point method is compromised by temperature sensitivity, making it less robust without strict control [32]. Additionally, its subjective nature, relying on visual observation, can introduce variability in results due to individual interpretation. The CMC values of pure Soluplus®, PF108, and Soluplus® + PF108 mixture were 0.0031 mg/mL, 0.01047 mg/mL, and 0.001 mg/mL, respectively, as shown in Fig. 1. The lower CMC of the Soluplus® + PF108 mixture is indicative of enhanced drug loading capacity, drug delivery efficiency, and significant in vivo stability which is crucial for pharmaceutical applications [12].
Fig. 1
CMC of Soluplus®, PF108, and Soluplus® + PF108 mixture
Development and optimization of MMsIn the pursuit of product development, preliminary experiments were conducted, followed by formulation optimization using a 32 full factorial design. Two independent variables, Soluplus® concentration (X1) and PF108 concentration (X2), were investigated at three different levels, resulting in nine possible combinations of DSP-MMs as presented in Table 1. The impact of independent variables was assessed with two dependent variables %EE (Y1) and MPS (Y2). Through optimization, batch R5 emerged as the most promising, exhibiting %EE of 74.81 ± 1.35%, MPS of 71.4 ± 0.2 nm, and drug loading of 29.27%.
Table 1 Formulation compositions using 32 full factorial design and results of their characterizationEffect of formulation variables on %EEThe effect of Soluplus®(X1) and PF108 (X2) concentrations on the %EE was estimated using a contour plot, Fig. 2A, and a 3D surface response plot Fig. 2B.
Fig. 2
A Contour plot of %EE, B 3D surface plot of %EE, C contour plot of particle size, D 3D surface plot of particle size
The %EE of DTX in MMs was observed to be increased with an increase in the concentration of both PF108 and Soluplus®. However, at a medium Soluplus® concentration (365 mg), a substantial increase in %EE was observed that ranged from 72 to 74.81%. The %EE of the DSP-MMs also increased with an increase in concentrations of both the components up to medium concentrations. Beyond this point, further increases in Soluplus® and PF108 concentrations led to a decrease in %EE [33]. This can be attributed to establishing a saturation point within the carrier system at elevated concentrations, which diminished the progressive advantages of additional Soluplus® and PF108. Moreover, apprehensions about potential aggregation or precipitation of these components emerged as concentrations increased, significantly compromising their efficacy in enhancing encapsulation efficiency. The simultaneous increase in solution viscosity due to heightened concentrations was also recognized as a pertinent factor contributing to this phenomenon, potentially obstructing the unobstructed diffusion of the DTX into the MMs.
The final %EE equation in terms of coded components is given below in Eq. 4:
$$\% } = + 74.59I + 4.21A + 0.8633B - 1.82AB - 5.95A^ - 1.13B^$$
(4)
Equation (4) shows a positive value indicating an increase in %EE owing to an increase in the concentration of Soluplus® and PF108. The Model F-value of 153.92 and a p value of 0.0008 being < 0.05 indicates that the model terms are significant.
Effect of formulation variables on particle sizeThe effect of Soluplus® (X1) and PF108 (X2) concentrations on the MPS was revealed using a contour plot, Fig. 2C, and a 3D surface response plot, Fig. 2D.
The MPS of DSP-MMs formulations were in the range of 71.4 ± 0.2 nm to 80.5 ± 1.4 nm. The concentration of PF108 and Soluplus® significantly affected MPS. The MPS of the DSP-MMs goes on decreasing with the increase in the concentration of both variables up to a certain extent after which it further goes on increasing with the increase in the concentration [34].
$$} = + 70.76I - 1.18A - 0.1500B + 2.80AB + 3.32A^ + 2.12B^$$
(5)
The model F-value 41.77 and a p value 0.0056 < 0.0500 indicates that the model terms are significant [31].
Mean particle size and zeta potential:The MPS of the MMs in the absence of DTX was found to be 74.4 nm, as shown in Fig. 3A. The MPS and zeta potential of DSP-MMs optimized batch R5 are presented in Fig. 3B and C were found to be 71.4 ± 0.2 nm and − 17.6 mV, respectively. TEM analysis confirmed the MPS estimated by dynamic light scattering [9].
Fig. 3
A MPS of MMs in the absence of DTX, B MPS of DSP MMs, C zeta potential of DSP MMs, D MPS of DSP-MMs VFD product, E zeta potential of DSP-MMs VFD product
Drug-excipient compatibility studyFTIR analysisFigure 4 displays the overlain FTIR spectra of DTX, PF108, Soluplus®, and the optimized formulation DSP MMs. In product development, FTIR analysis is pivotal for studying drug-excipient interactions and assessing formulation stability. DTX FTIR peaks include O–H, N–H stretching at 3630, 3444, and 3355 cm−1, aromatic C=C stretching at 1699 cm−1, and C–O–C stretching at 1157, 1251 cm−1. PF108 shows C–H stretching at 2875 cm−1, C–H bending at 1462 cm−1, and C–H bending at 840 cm−1. Soluplus® exhibits O–H, N–H stretching at 3656 cm−1, C–H stretching at 2886 cm−1, C=O at 1731 cm−1, and C–O, C–O–C stretching at 1102 cm−1[34].
Fig. 4
FTIR spectrums: A Docetaxel, B PF108, C Soluplus® and D DSP MMs
DSC analysisDSC analysis is vital in product development, offering insights into thermal transitions and formulation properties. The overlain DSC thermograms in Fig. 5I depict DTX and DSP MMs VFD products. DTX exhibits an endothermic peak at 178–188 °C, while DSP MMs VFD product shows a peak at 308.16 °C, indicating polymer melting and a solid-to-liquid transition. Notably, the DTX melting point peak disappears in DSP MMs VFD products, suggesting a transition from a crystalline to a partially amorphous state, crucial for optimizing drug delivery properties in pharmaceutical development [35].
Fig. 5
(I): DSC thermograms: A DTX, B DSP-MMs (R5), and C VFD product and (II) P-XRD: A Plain DTX, B DSP-MMs, and C DSP-MMs VFD product
Characterization of DSP-MMs VFD productThe DSP-MMs VFD products were a lightweight, porous material with a high surface area that was obtained under reduced pressure conditions. The product formed facilitates rapid drying by removing moisture at lower temperatures than traditional drying methods. The resulting product typically exhibits characteristics such as enhanced porosity, improved rehydration capabilities, and a unique texture, as shown in Fig. 6A. The DSP-MMs VFD products underwent characterization to evaluate MPS, zeta potential, PDI, EE, drug loading, moisture content, and reconstitution time. The MPS was 82.7 ± 0.98 nm (Fig. 3D), zeta potential was − 14.1 ± 0.9 (mV) (Fig. 3E), PDI was 0.073 ± 0.011, %EE was 79.98 ± 0.97%, DLC was 98.2 ± 1.3%, moisture content was 2.25 ± 0.36%, and reconstitution time was 46 ± 5 s (Fig. 6B). These findings provided valuable insights into the physical properties and performance of the final product.
Fig. 6
DSP-MMs product: A VFD product and B reconstituted VFD product
Morphological characterization using TEM and SEM analysisThe morphological characteristics of the optimized R5 formulation DSP-MMs structure and DSP-MMs VFD product are validated by TEM analysis Fig. 7A and B. The self-assembled MMs were observed to be spherical in shape. TEM images confirmed the nanoscale of generated MMs, which was comparable with the results, obtained using Zetasizer [36]. The SEM images revealed a highly porous structure of DSP-MMs VFD product (Fig. 7C and D). This porous nature facilitates the rapid reconstitution of DSP-MMs VFD products into micellar solutions [37].
Fig. 7
TEM images: A DSP-MMs, B DSP-MMs VFD product and SEM images: C DSP-MMs, D DSP-MMs VFD product
Powder X-ray diffraction analysisThe P-XRD patterns of the plain DTX, DSP-MMs, and DSP-MMs VFD products are displayed in Fig. 5II. Plain DTX showed characteristic strong, high-energy diffraction peaks, indicating crystallinity. In the case of optimized DSP-MMs, these peaks were dramatically broadened with reduced peak intensities indicating partial amorphization. These characteristic peaks disappeared in the diffractogram of VFD products, indicating the amorphization of DSP-MMs VFD products [38].
In vitro drug release studyIllustrated in Fig. 8I are the release profiles of DTX from different formulations: plain DTX DSP-MMs and DSP-MMs VFD products. When dissolved in methanol, plain DTX exhibited an impressive release rate of over 90% after 8 h in PBS (pH 7.4) with 0.5% w/v tween 80, maintaining the sink condition. Comparatively, the DTX release from DSP-MMs after 96 h was measured to be 81.95 ± 1.3%. However, the DSP-MMs VFD product showcased even more remarkable sustained release capabilities, reaching 83.23 ± 1.5%, outperforming plain DTX in terms of sustained release performance [9].
Fig. 8
(I)In vitro drug release study from DTX, DSP MMs (R5), and DSP-MMs VFD product, (II) Drug release kinetics for DSP-MMs VFD Product, and (III) In vitro cytotoxicity against B16F10 cell line
The drug release pattern was analyzed by fitting the %CDR data from the release profile into various models, including zero-order, first-order, Higuchi, and Korsmeyer-Peppas models. Among these models, the Higuchi model demonstrated the highest correlation coefficient (R2), as depicted in Fig. 7II. Consequently, this model was selected as the best fit for the data, indicating that the main drug release mechanisms from DSP-MMs involve dissolution and diffusion [39].
In vitro hemolysis studyThe hemolysis assay was performed to assess the biocompatibility and safety of the formulations. The results of in vitro hemolysis in plain DTX, blank Soluplus®/PF108 MMs, DSP-MMs, and DSP-MMs VFD products are presented in Fig. 9. The positive control displayed complete hemolysis, while the negative control showed minimal hemolysis. Plain DTX exhibited a higher percentage of hemolysis compared to DSP-MMs and DSP-MMs VFD products at the same dose. Compared to Taxotere, a marketed formulation of the DTX and previously prepared docetaxel nanoformulations, DSP-MMs VFD product exhibits reduced hemolysis, providing evidence of the enhanced quality of the developed product. This indicates that encapsulation of DTX in DSP-MMs and the subsequent DSP-MMs VFD product significantly reduced the hemolytic potential of the formulation. The reduced hemolytic activity indicates a decreased risk of red blood cell damage and supports the potential for safe and effective delivery of DTX using DSP-MMs and DSP-MMs VFD products intravenously [40].
Fig. 9
Hemolysis study of DTX, DSP blank, DSP-MMs, and DSP-MMs VFD product
In vitro cytotoxicity studyAll the test samples showed a cytotoxic effect on the B16F10 cell line that was concentration-dependent (Fig. 8III and Table 2). At the same doses, both plain DTX and DSP-MMs demonstrated virtually comparable cytotoxicity against cancer cells. On the B16F10 cell line, the simple DTX displayed a lower IC50 value of 0.2155 µM than DSP-MMs with an IC50 value of 1.170 µM. In comparison to conventional DTX, DSP-MMs displayed a slightly higher IC50 value, indicating lesser cytotoxicity against the B16F10 cell line. The sustained release of DTX from DSP-MMs, as seen in the in vitro release study, can be attributed to reduced cytotoxicity. The sustained release of DTX from MMs corresponded to a previous study described by Patil et al. [9].
Table 2 In vitro cytotoxicity study of formulationsStability study of DSP-MMs and DSP-MMs VFD productThe comparison between the stability of the developed formulations, DSP-MMs, and DSP-MMs VFD products under accelerated storage conditions is depicted in Table 3. The table showcases key physical properties at two distinct time junctures: initial time (time zero) and following a 3-month storage period. This evaluation provides valuable insights into the endurance of the formulations over time and in the face of adverse storage conditions [25].
Table 3 Stability study of DSP-MMs
留言 (0)