Sample collection, processing, and isolation of LAB
Fermented food samples were collected from two different villages in the Darjeeling district of West Bengal, India, during March and April 2022. Chhurpi, a dairy-based fermented product, was collected from Tukdah Forest village, while soft Chhurpi and vegetable-based fermented preparations, namely Gundruk, Kinema, and Sinki, were collected from Bijanbari village. The samples were collected separately in sterile 50mL centrifuge tubes and transported to the laboratory in thermally insulated ice boxes to maintain their integrity. Standard procedure was followed for the collection of the samples [10].
Similar to the traditional processing for consumption, Kinema, Gundruk, and Sinki were mixed with distilled water and incubated at 37 ℃ for 20 min. Then, 200µL sample from these liquid mixtures was taken and added to separate De-Man, Rogosa, and Sharpe (MRS) (Hi-Media, India) broth and incubated at 37 ℃ for 48 h. Hard and soft Chhurpi was directly used as inoculum for MRS broth and incubated following the same process. After 48 h of incubation, all the inoculated broths were serially diluted up to 10–7 in phosphate buffer saline (PBS) (SRL, India) and spread on MRS agar plates separately. These plates were then incubated at 37 ℃ for 48 h. Plates with a suitable number of colonies (neither too many nor too few) were selected, and their colony numbers were counted in terms of colony-forming units (CFU). Bacterial load of all the food samples was calculated in CFU per milliliter (mL) or CFU per gram (g) unit. Colonies with distinct physical characteristics were then selected and streaked onto fresh MRS plates to make single colonies and to isolate pure cultures.
The isolated pure colonies were then transferred to MRS agar slants for experimental use and stocked in 40% glycerol for storage. The isolates were named based on the source (C for Chhurpi, G for Gundruk, K for Kinema, and S for Sinki), the month of collection (M for March, A for April), and the district of collection (D for Darjeeling), followed by sequential numbers to represent each isolate from each source. The slants were stored at 4 ℃ and sub-cultured every 15 days, not exceeding 2 passages (the transfer of organisms from an established culture to a fresh medium), while glycerol stocks were stored at – 20 ℃ and restocked every 2 months (not exceeding 5 passages) [11].
Preliminary screening of the isolates based on gastro-inhibition tolerance activity
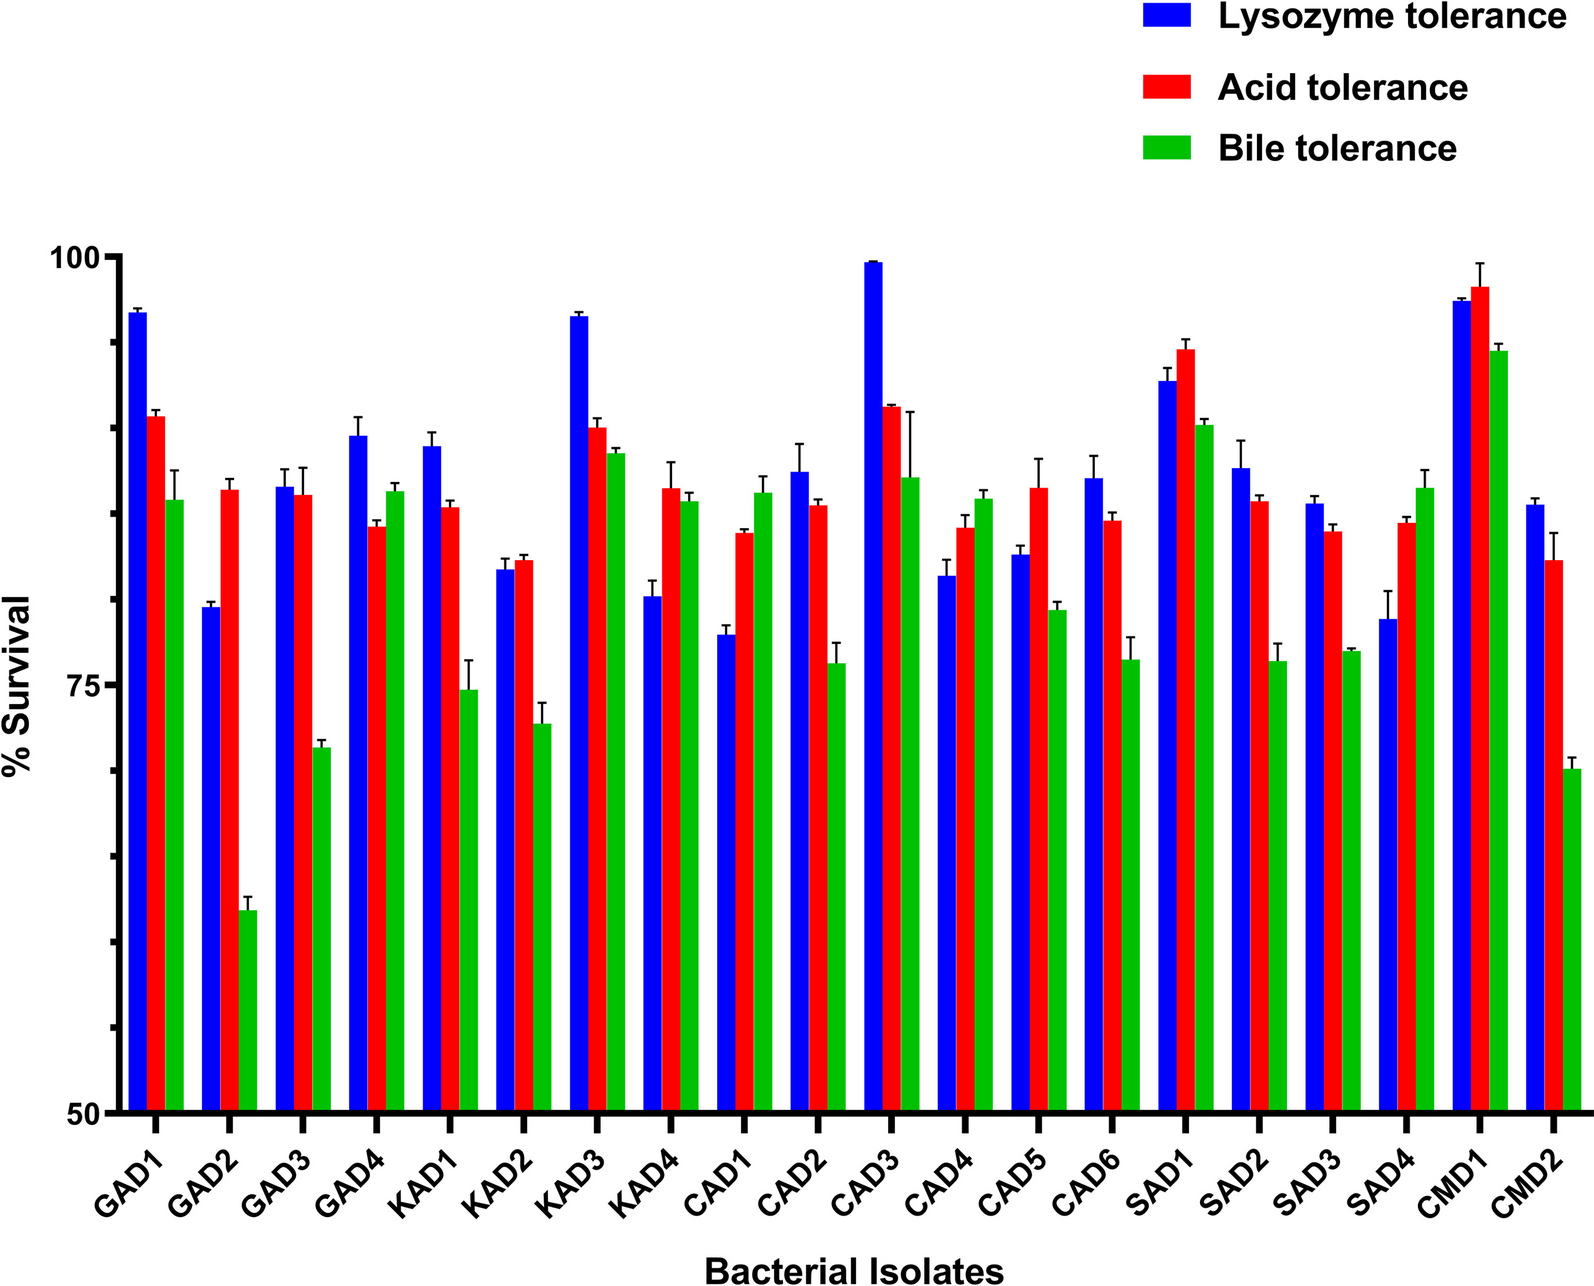
In order to identify the most resilient LAB from the initial isolates, the isolates were exposed to conditions resembling the harsh environment of the human gastrointestinal (GI) tract. These conditions included lysozyme-mediated degradation, acidic pH, and high bile concentration [12]. After the preliminary screening, tolerance to alkaline pH was also evaluated for the selected strains.
To assess lysozyme tolerance, a standard protocol was followed [13]. Briefly, overnight-grown bacterial cells were subjected to lysozyme tolerance testing. The cells were harvested, washed, and resuspended in Ringer's solution. A suspension of 10 μL was inoculated into a sterile electrolyte solution containing lysozyme at a concentration of 100 mg/L (SRL, India). A control broth without lysozyme was also prepared. The samples were then incubated at 37 °C, and after 2 h, the viable cell count was determined as a measure of lysozyme tolerance (in terms of Log CFU/mL).
For the analysis of acid and bile tolerance, standard protocols with certain experimental adjustments were followed [14, 15]. To assess acid tolerance, the isolates were cultured in acidic MRS broths (Test) adjusted to pH 3.0 with 1 M hydrochloric acid, alongside control MRS broth with normal pH. Here, a direct endpoint method was employed. This involved determining the survival percentage by comparing the bacterial count (expressed as log CFU/mL) in the control broth (not subjected to acidification) with that in the test broth (acidified to pH 3.0). For the experimental assessment of bile, acid, and lysozyme tolerance, L. plantarum MCC 2156 served as the positive reference strain [16]. The assessment was performed after a fixed incubation time of 3 h, utilizing an overnight-grown culture as the inoculum at a concentration of 1% V/V. Similarly, for the bile tolerance assay, a test broth containing 2% (w/v) deoxycholic acid (SRL, India) was used, and again, Log CFU/mL values of the ‘Test’ broth were compared with those of the 'Control' broth involving the same incubation parameters. The survivability of the isolates was calculated by comparing the Log CFU/mL values of the 'Test' and the ‘Control’ broths, and the survivability for each isolate was expressed as ‘Percent Survival’ (% Survival) using the following formula:
$$}\,}\,(\% \,}) = \frac}\,}\,}\,}\,}\,}}}}\,}\,}\,}\,}\,}}} \times 100$$
Isolates showing survival values ≥ 85% for the GI conditions (lysozyme, acid, and bile tolerance) were selected for further analysis. The chosen cut-off value of “85%” was selected because scoring more than 85% of all three parameters creates a probability of success (85% × 85% × 85%) and reinforces the strains’ potential to thrive in the harsh GI environment, making them promising candidates for probiotic use.
After preliminary screening, survival of the selected isolates in alkaline pH was further assessed, taking alkaline-tolerant Escherichia coli K12 strain as control. Briefly, broths with pH levels of 8.5, reflecting the maximum pH detected in the human gastrointestinal tract [17], were prepared alongside control broths with unaltered pH. Inoculums were incubated for 12 h at 37 °C, and the % OD change of the individual broths was measured at 600 nm in a spectrophotometer (Shimadzu UV-1900I, Japan) indicating the extent of growth inhibition due to alkaline pH.
Molecular identification of the LAB isolates
The selected LAB isolates were identified by analyzing the partial sequences of their 16S rRNA genes through molecular phylogeny. The genomic DNA of each isolate was separately extracted following standard protocols outlined by De et al. [18]. The partial 16S rRNA gene was then amplified using universal primers 27F (5′-AGAGTTTGATCCTGGCTCAG-3′) and 1492R (5′-TACGGTTACCTTGTTACGACTT-3′) as described in a previous study by Frank et al. [19]. For amplification, reaction mixture was prepared using reagents from Promega (USA) and Eurofins Genomics, India (primers) following the manufacturer’s instructions. Thermal cycling was carried out in a Mastercycler® Nexus GX2 thermal cycler (Eppendorf instrumente gmbh, Germany). The PCR products were visualized on an ethidium bromide-agarose gel under a UV transilluminator (Hi-Media, India). The PCR products were purified and sequenced using Sanger's method at Heredity Biosciences, India. The resulting sequences were aligned in the NCBI-BLAST (https://blast.ncbi.nlm.nih.gov/blast.cgi) for similarity analysis and to infer functional and evolutionary relationships between sequences. The raw sequences obtained were trimmed and aligned using the MEGA 11 version 11.0.13 package with similar sequences retrieved from the database for drawing the phylogenetic relationship [20]. Finally, the curated sequences were deposited in the GenBank (https://www.ncbi.nlm.nih.gov/websub/) for public access. Phylogenetic tree and evolutionary relationships were constructed using the neighbor-joining method in the MEGA 11 (v. 11.0.13) package, with Leuconostoc gasicomitatum strain Tb1-10 serving as the outgroup [20]. To assess the accuracy of the tree topologies, bootstrap analysis with 100 repetitions was performed [21].
Assessment of probiotics propertiesCarbohydrate fermentation profiling and esculin hydrolysis
A good probiotic strain should have the ability to utilize multiple carbohydrate sources, which ensures its survival in the host’s digestive tract [22]. To identify the patterns of sugar fermentation, and esculin hydrolysis of the LAB isolates, a standard carbohydrate fermentation kit (Hi-Lacto Identification Kit, KB020-10KT, Hi-Media, India) was used. For the assessment, 50 μL of overnight-grown cultures was aseptically applied to each of the specific designated wells of the kit by surface inoculation method, and then, the kits were again sealed off and incubated at 37 °C for 24 h, and after the incubation, the results were interpreted as per the instruction manual (as positive, + or negative, −).
Auto-aggregation assay
Modified version of the auto-aggregation assay developed by Del Re et al. [23] was used to test the capacity of the isolated LAB isolates to auto-aggregate. Briefly, 2 mL of bacterial suspension from overnight-grown cultures was vortexed, and then, the mixture was allowed to stand in static condition at 37 °C, and at regular intervals (30 min, 60 min, 90 min, 120 min, and 150 min) 100 μL of liquid from the upper surface from each bacterial culture was taken and combined with 900 μL of PBS (0.1 M), and then, the absorbance was measured using a microplate reader (SPECTROstarNano, BMG Labtech, Germany) at 600 nm (A600). The auto-aggregation (%) of all the LAB isolates was then calculated by the formula:
$$} - }\,(\% ) = \frac - A_ }} }} \times 100$$
where A0 is A600 at 0 h and AT represents the A600 of cell suspension at different time intervals (30 min, 60 min, 90 min, 120 min and 150 min). For comparison and analysis, the percentage value of each time frame was compared with the previous time frame for individual LAB isolates.
Co-aggregation assay
For co-aggregation assay, four commonly used laboratory strains were used as control. These were Escherichia coli K12 ATCC® 29425™, Pseudomonas aeruginosa CCEB-481 ATCC® 10145™, Staphylococcus aureus NCTC-8532 ATCC® 12600™, Bacillus cereus CCM-2010 ATCC® 14579™. For assessing the co-aggregation properties, standard protocols were followed with some modifications [24]. For this assay, overnight cultures of LAB isolates were mixed with the overnight cultures of the above-mentioned laboratory strains in equal volumes to form a cell suspension of a definite bacterial count (109 CFU/mL). The mixed suspensions were then incubated at 37 °C for 2 and 8 h. 2 mL of pure bacterial suspensions (for each bacterium) was taken as control. After the defined time duration, the optical density was measured at 600 nm. The following formula calculated the percentage values of co-aggregation of all the LAB isolates:
$$}(\% ) = 100 \times \left[ }}} + A_}}} }}} \right) - A_}}} }}}}} + A_}}} }}} \right]}}} \right]$$
where ALS and ALAB stand for the OD600 of the pure cultures of the laboratory strains (LS) and LAB (LAB) isolates, respectively. Amix is the OD of the mixed suspension different LAB and LS. Percent co-aggregation of the 8th h was compared with that of the 4th h (for each LAB to each LS).
For the auto- and co-aggregation assays too, L. plantarum MCC 2156 served as the reference strain [16] for comparing the performance of the isolated LABs.
Bile salt hydrolase activity (BSH)
One of the most potent health-promoting features of any LAB is the BSH activity, which determines its ability to break down conjugated bile salts [25]. For the assessment of BSH activity, one of the standard protocols laid down by Hernández-gómez et al. [26] was used with few modifications. Briefly, bile salt (Oxbile, Hi-Media) and CaCl2 were added to MRS agar at 0.5% (w/v) and 0.37 g/L, respectively. Sterile disks made from filter paper were spot inoculated with 10 µl of overnight-grown LAB cultures in MRS broth, and finally, the disks were laid over modified MRS agar plates and then incubated at 37 °C for 48 h (to give ample amount of time for the deposition of detectable amount of precipitate). It was considered positive when bile acid precipitations started to form surrounding the disk in a diffused manner.
Cell surface enzyme characteristics
Extracellular enzyme activities like proteolytic, lipolytic, and amylolytic properties were evaluated following standard protocol [27].
For proteolytic property assessment, skim milk powder (SRL, India) was dissolved in 100 mL of bacteriological agar media to create skim milk agar plates. Then fresh overnight cultures of LAB isolates were inoculated onto skim milk agar plates, which were then incubated for 24 h at 37 ℃. The bacteria showing translucent haloes around the colonies were thought to have proteolytic properties.
Tributyrin supplement (SRL, India) was employed as a source of lipids to assess extracellular lipase activity. Tributyrin was autoclaved at 120 ℃ for 15 min. It was then diluted by 1/100 mL and added to Tributyrin Supplement Agar (TSA; SRL, India). The resultant colloidal medium was plated, allowed to dry, streaked with the LAB isolates, and then incubated for 24 h at 37 °C. Positive result was interpreted by the presence of a clear zone and the emergence of broken lipid droplets around the colonies.
For amylolytic activity assessment, 1 g starch is added in 100 mL of sterile nutrient agar media (SRL, India) and autoclaved at 121 ℃ for 15 min. The starch agar plates were streaked with cultures of the LAB isolates, incubated for 24 h at 37 °C, and after that, the plates were flooded with 1% iodine solution. Clear zones around the streaked lines indicated the presence of extracellular amylase enzyme, while the absence of such zones indicated negative results.
Antimicrobial properties
In order to check the antimicrobial activity, indicator strains, viz. E. coli K12ATCC® 29425™, E. coli HB101 ATCC® 33694™, P. aeruginosa CCEB-481 ATCC® 10145™, S. aureus NCTC-8532 ATCC® 12600™, B. cereus CCM-2010 ATCC® 14579™, were used and the experiment was conducted following a standard protocol [15] with experimental modifications. The overnight cultures of LAB isolates were centrifuged for 5 min at 8000×g (Eppendorf 5430R, Eppendorf Instrumente GmbH, Germany), the cells were pelleted out, and the cell-free supernatant was utilized to assess the antibacterial activity. A sterile borer was used to make 6-mm-diameter wells in Muller Hinton Agar (MHA) plates (SRL, India) that had been surface inoculated with overnight-grown culture suspensions of the indicator organisms (100 mL). Each well received 150 mL of cell-free supernatant of all LAB isolates, after which the plates were kept at 37 °C for a day and checked for zones of inhibition (ZOI). Results were interpreted as no inhibition = − , ‘ + ’ = ZOI: 1–3 mm; ‘++’ = ZOI: 3–8 mm; ‘+++’ = ZOI: ≥ 8 mm (the ZOI was calculated after subtracting the well diameter size, i.e., 6 mm).
Cell surface hydrophobicity (CSH) assessment
One of the most commonly used methods to evaluate CSH activity is to find the hydrocarbon attachment propensities of the bacteria in question. CSH of the LAB isolates was determined using a standard protocol [28] with certain modifications. Briefly, after 24 h of incubation bacterial cultures were washed twice in PBS and then resuspended to a concentration of ~ 109 CFU/mL, and the initial absorbance at 600 nm value was determined (A0). A two-phase system was then created by adding 3 mL of cell suspension with 1 mL of solvent (Xylene, Ethyl acetate, Acetone). It was then vortexed for 2 min. After 20 min of incubation, the aqueous phase was removed, and its absorbance at 600 nm was measured (A1). CSH or ‘% adhesion’ or hydrophobicity was calculated according to following formula:
$$}\,}\,}\,}\frac - A_ }} }} \times 100$$
where A0 is the OD600 of bacterial culture before solvent mixing and A1 is the OD600 of bacterial culture after solvent mixing.
In vitro antidiabetic assessment
Partial or complete inhibition of carbohydrate-hydrolyzing enzymes determines the glucose-lowering activity of any LAB isolates because it reduces the amount of available free glucose in peripheral circulation.
α -amylase inhibitory activity
The ability of the isolated LAB strains to inhibit α-amylase was assessed following standard protocol [29]. Briefly, 250 µL of cell-free supernatant of each overnight LAB culture was mixed with 250 µL of 0.5 mg/mL α-amylase (Merck, India) solution and then incubated for 10 min at 25 °C. After that, 250 µL of starch solution (1% w/v in 0.02 M sodium phosphate buffer) was added to the reaction mixture and again incubated at 25 °C for 10 min. The reaction was then terminated with the addition of 500 µL of 3,5-dinitrosalicylic acid (DNS) color reagent (Merck, India) (96 mM DNS and 5.31 M sodium potassium tartrate in 2 M sodium hydroxide solution). The reaction mixture was heated for 5 min, cooled at room temperature, and diluted four times, and then, the absorbance was measured at 540 nm. The reaction mixture without bacterial supernatant was taken as a control. The inhibition propensity (%) was calculated according to the following formula:where AC is the absorbance of the control reaction mixture and AB is the absorbance of the reaction mixture with bacterial supernatant.
$$\alpha - }\,}\,}\,}\left[ - A_ )}} }}} \right] \times 100$$
α -glucosidase inhibitory activity
The α-glucosidase inhibition activity was carried out following standard protocol [30]. Briefly, 25 µL of cell-free supernatant from each overnight LAB culture was mixed with 150 µL 0.01 M of potassium phosphate buffer (pH 6.8) and incubated for 10 min. To this mixture, 50 µL of α -glucosidase (Merck, India) enzyme was added and again incubated for 15 min at 37 °C. Then to this reaction mixture, 75 µL of 5 mM p-nitrophenol-D-glucopyranoside (pNPG) (Merck, India) substrate was added and incubated for 30 min at 37 °C; the enzymatic reaction was stopped with the addition of 1 mL of 0.1 M Na2CO3. The absorbance of the reaction mixture was measured at 540 nm. The reaction mixture without bacterial supernatant was taken as a control. The inhibition propensity (%) was calculated according to the following formula:
$$\alpha - }\,}\,}\,} = \left[ }} }}} \right] \times 100$$
where AC is the absorbance of the control reaction mixture and AB is the absorbance of the reaction mixture with bacterial supernatant.
Several strains of L. plantarum have been documented for their significant anti-diabetic properties, alongside notable in vitro inhibition of α -amylase and α -glucosidase enzymes. Hence, L. plantarum MCC 2156 has been employed as a reference strain to validate the experimental protocols and to assess the performance of the isolated LABs in these assays [31, 32].
Safety assessmentAntibiotic susceptibility profiling
Antibiotic susceptibility of a potent probiotic is linked with host safety. Antibiotic susceptibility of the selected isolates was carried out on MHA plates using antibiotic discs (Hi-Media Combi IV Octadisc, Hi-Media, India) of standard antibiotics, ampicillin (amp) 10 μg, cephalothin (cep) 30 μg, chloramphenicol (c) 30 μg, clindamycin (cd) 2 μg, erythromycin (e) 15 μg, gentamicin (gen) 10 μg, oxacillin (ox) 1 μg, vancomycin (va) 30 μg, streptomycin (str) 10 μg, kanamycin (kana) 15 μg, and tetracyclin (tet) 20 μg standard antibiotics. The results obtained were interpreted according the standard methods [33]. Briefly, the obtained ZOI diameter values were grouped into 2 subsection, “ + ” (having ZOI ≤ 8) and “−” (having ZOI ≥ 8) and the result was interpreted in a table.
Hemolytic activity
The hemolytic activity of bacteria is its capacity to degrade red blood cells and release hemoglobin, and it is required for the safety assessment of a putative probiotic. For this assay, standard protocol with slight modification was used [34]. Briefly, overnight cultures of LAB isolates were spread onto Blood Agar Plates (tryptone soy agar plate containing 5% human blood) and incubated for 24 h. The plates were then examined for patterns of hemolysis that is whether complete (beta), partial (alpha), or absence of visible (gamma) destruction of RBCs indicated [35] by a clear zone around the colonies. E. coli K12 was taken as positive hemolytic indicator strain to define the experiment’s accuracy.
In vivo acute toxicity test
To ensure the safety of the LAB (probiotic isolates), acute oral toxicity study was conducted on Swiss albino mice (20 ± 2 g) aged 6–8 weeks. The mice were sourced from a licensed animal dealer (Chakraborty Enterprise, Kolkata, India; Regd. No. 1443/PO/Bt/s/11/CPCSEA) and housed in controlled conditions with specific temperature, humidity, and light–dark cycle. They were acclimatized for two weeks in the animal house keeping them in cages and with free access to pellet diet and water. The study was approved by the Institutional Animal Ethical Committee (IAEC) of the Committee for the Purpose of Control and Supervision of Experiments on Animals (CPCSEA) of the University as per rules, under the animal ethical approval number IAEC/NBU/2022/27. The mice were randomly divided into six groups a vehicle group and five groups with dietary LAB supplementation. Each group received a single dose of bacterial suspension (6 \(\times\) 109 CFU/Kg body weight). Observations of various parameters such as aggression, food and drink intake, sedation, diarrhea, fur loss, and lethargy were recorded at regular intervals over 2 weeks. Particular attention was given to identifying any late signs of toxicological effects within the first four hours of each day. The investigation followed the OECD guideline for acute oral toxicity testing [36, 37].
Statistical analysis and graphical interpretation
All in vitro experiments were repeated three times. The data were represented by the replicate value’s mean and standard deviation. GraphPad prism software package Version 8.0.2 was used for statistical analysis for data normality (Shapiro–Wilk test), statistical differences (ANOVA), multiple-comparison post hoc testing (Dunnet’s or Tukey’s test for significance test), and data visualization. p ≤ 0.05 were considered significant.


留言 (0)