
記住我
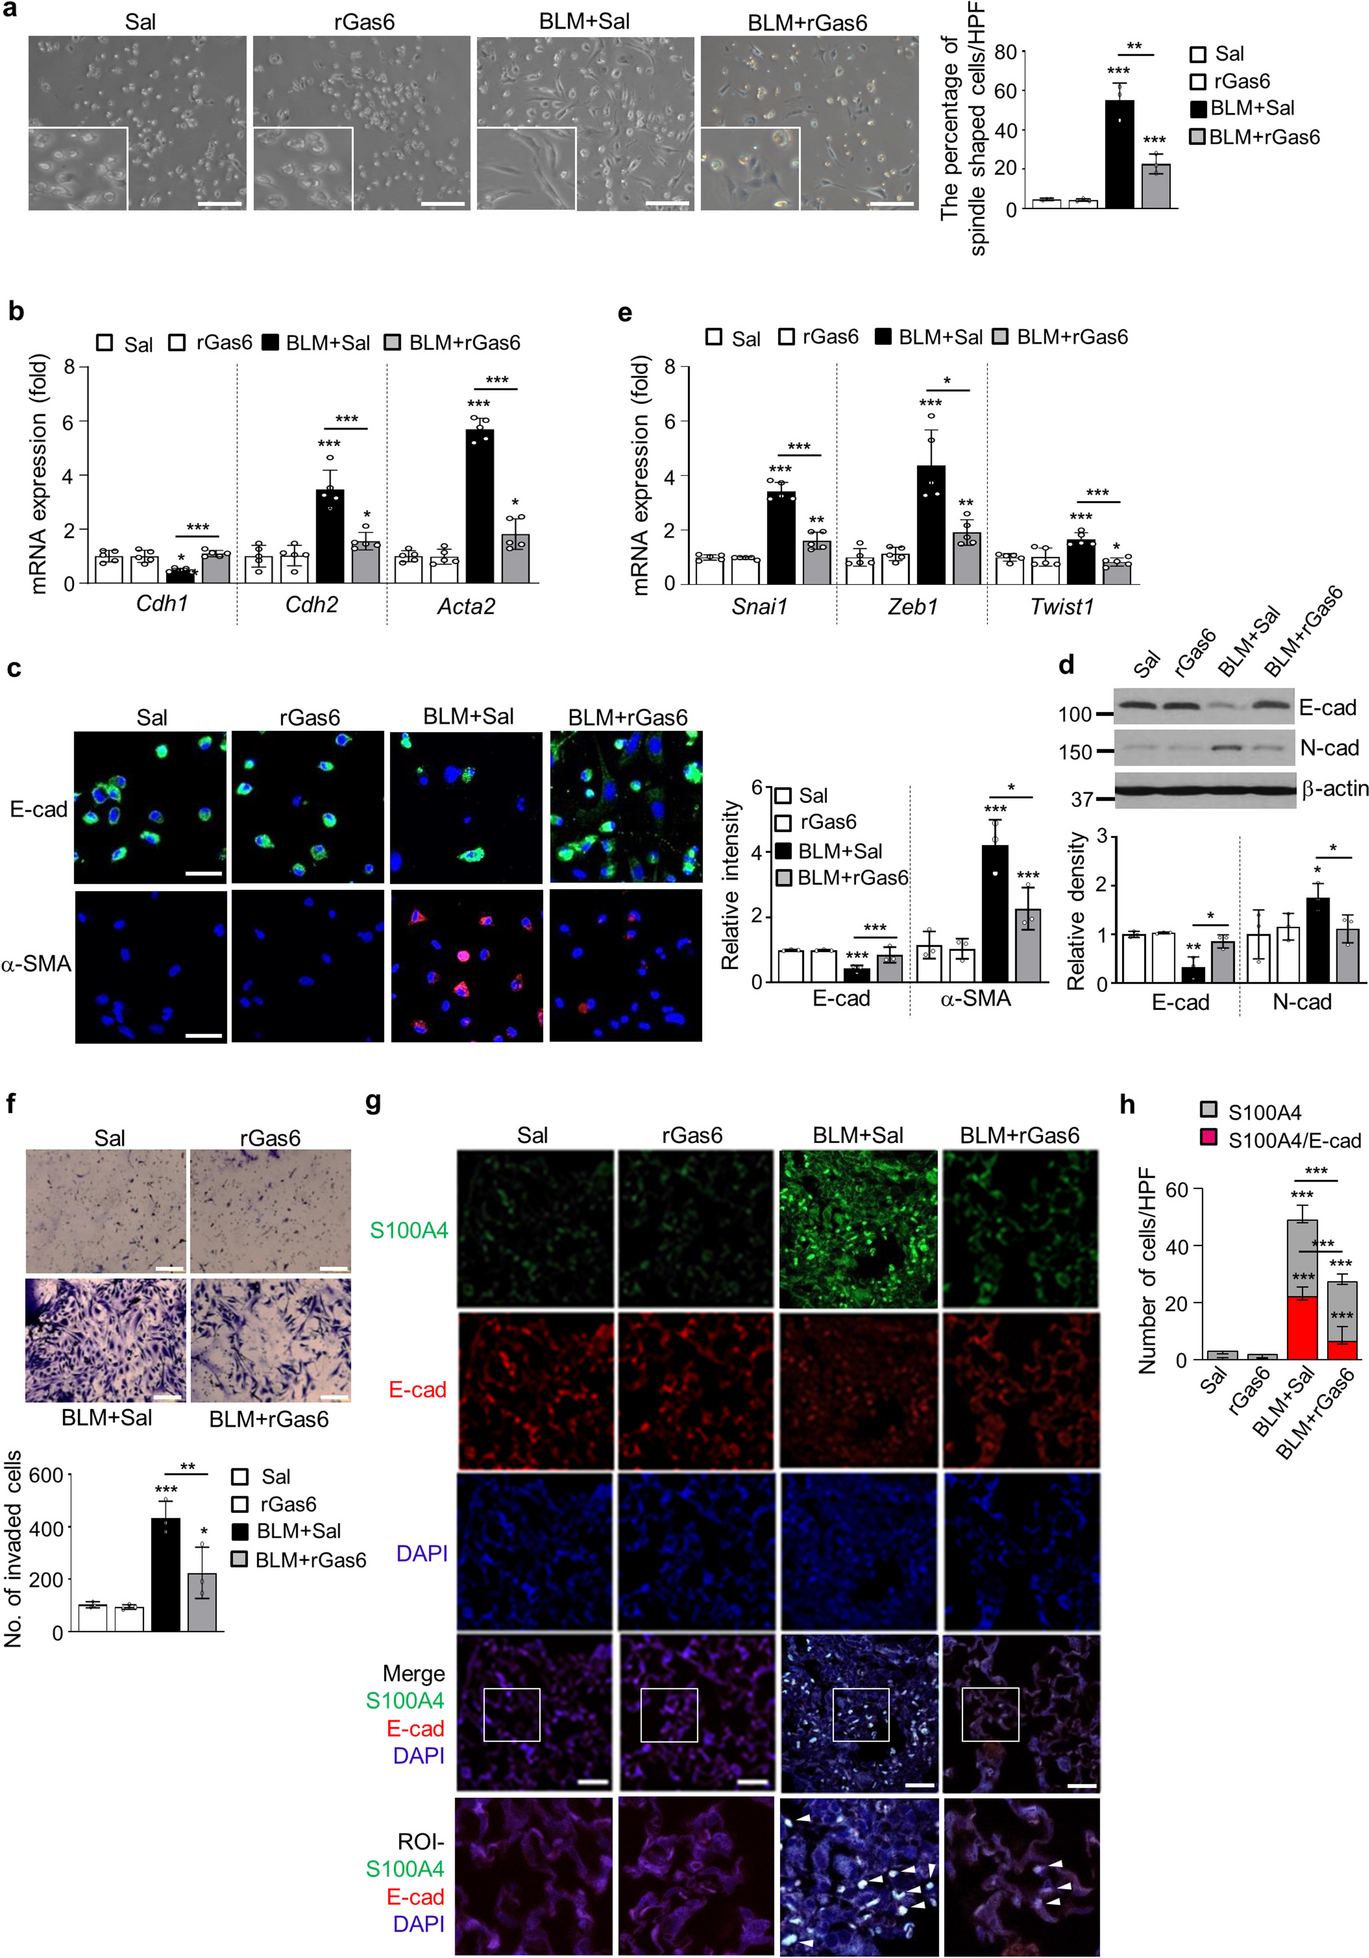
In our prior investigation (Lee et al. 2017), we developed an experimental approach for isolating primary ATII cells from mouse lung tissues, following the methodology outlined in a previous study (Bortnick et al. 2003). Through this approach, isolation of ATII cells was carried out from the lung tissues of mice subjected to BLM treatment. We found that approximately 53% of the isolated ATII cells 14 days post-BLM treatment exhibited a spindle-shaped morphology compared with those from control mice, when plated on a culture dish (Fig. 1a). The EMT process converts tightly adherent cells into an elongated, motile phenotype and has been linked to the progression of organ fibrosis (Kasai et al. 2005). Here, we demonstrate that rGas6 administration changed the morphology of isolated ATII cells a stretched, fibroblast-like morphology to a characteristic rounded shape at 14 days post-BLM treatment (Fig. 1a) and inhibited the mRNA expression profile of EMT markers (Fig. 1b). These actions induced a reduction of E-cadherin mRNA levels and enhancement of mRNA levels of N-cadherin and α-SMA, indicators of mesenchymal features, at 14 days post-BLM treatment. Immunofluorescence was conducted with monoclonal antibodies against E-cadherin (labeled in green) and α-SMA (labeled in red) to confirm alterations in EMT marker proteins. rGas6 treatment reversed decreased E-cadherin expression and increased α-SMA expression in primary ATII cells by BLM treatment (Fig. 1c). Similarly, 14 days post-BLM treatment, rGas6 prevented BLM-induced changes in the protein expression levels of N- and E-cadherin (Fig. 1d). The transition from epithelial to mesenchymal characteristics is orchestrated through the cooperative efforts of the Basic helix-loop-helix, ZEB, and Snai transcription factor families (Gonzalez and Medici 2014). Thus, 14 d following BLM treatment, we investigated if rGas6 injection reduces the expression of these transcription factors in primary ATII cells. ATII cells in the BLM + rGas6 group had considerably lower levels of Snai1, Zeb1, and Twist1 mRNA than cells in the group that received BLM alone (Fig. 1e). The adoption of a mesenchymal phenotype by epithelial cells is linked to heightened invasive properties (Lamouille et al. 2014). Thus, Transwell invasion assays were conducted to evaluate cellular invasiveness in response to a chemoattractant gradient. Our data showed that rGas6 administration inhibited the invasive ability of primary ATII cells at 14 days after BLM treatment (Fig. 1f).
Fig. 1
Inhibition of EMT and primary ATII cell invasion by rGas6 administration. Mice were intratracheally instilled with BLM (5 U/kg). Either rGas6 (50 μg/kg) or saline (Sal) was intraperitoneally administered 1 day before BLM treatment and once every 2 days thereafter. Mice were euthanized 14 days after BLM treatment. (a) Left: morphological changes in isolated ATII cells (Scale bars: 100 μm). Representative images are shown from three replicates per condition with cells pooled from two mice per replicate. Right: percentage of spindle shaped cells/high-power fields (HPF). (b) qRT-PCR of EMT markers in ATII cell samples. (c) Left: immunofluorescence staining for E-cadherin (green) and α-SMA (red). Right: quantification of proteins in ATII cells. Original magnification: 400 × . Scale bars: 20 μm. Imaging medium: Vectashield fluorescent mounting medium containing DAPI. (d) Immunoblot analysis of E-cadherin and N-cadherin in lung homogenates. Below: Densitometric analysis of each band normalized to that of β-actin. Values represent the means ± S.E.M. from three mice per group. (e) qRT-PCR of Snail1, Zeb1, and Twist1 in ATII cell samples. (f) Phase-contrast microscopy and quantification of invaded ATII cells. Scale bars: 100 µm. *P < 0.05, **P < 0.01, ***P < 0.001 compared with control or for BLM + Sal vs. BLM + rGas6. Data were obtained from three (c right, f below) or five replicates (b, e) per condition with cells pooled from two mice per replicate. Data are shown as the means ± S.E.M. (g) Immunofluorescence staining for E-cadherin (red), α-SMA (red), or S100A4 (green) in lung sections. Arrowheads indicate colocalization of E-cadherin in lung fibroblasts. Imaging medium: Vectashield fluorescence mounting medium containing DAPI. Scale bars: 20 μm. Representative images were obtained from three mice in each group. (h) Graph representing the number of S100A4/E-cadherin double-positive cells compared with the total S100A4-positive cell population in lung parenchyma. Mean of five HPFs/section ± S.E.M. from three mice in each group
To validate the inhibitory impact of rGas6 on the EMT process, we conducted double immunofluorescence staining for E-cadherin and S100A4 in lung tissue. The noted existence of cells positive for both E-cadherin and S100A4 indicates an epithelial origin and a potential transitional phase of EMT. (Fig. 1g). Approximately 45% of fibroblasts positive for S100A4 were originated from lung epithelium at 14 days following BLM treatment (Fig. 1h), suggesting an obvious EMT occurrence after BLM treatment. Notably, both the quantity of fibroblasts originating from epithelial cells and the amount of S100A4 expression were reduced following Gas6 administration (~ 24% cells positive for both markers). When combined, these findings provide credence to the in vivo studies showing that rGas6 injection prevents lung fibrosis caused by BLM from progressing through the EMT stage.
rGas6 administration inhibits apoptosis of ATII cell during lung fibrosisIn addition to EMT, many studies have shown that injury and apoptosis of alveolar epithelial cells are important early features of IPF (Todd et al. 2012). Using a TUNEL assay and flow cytometry analysis, we examined whether rGas6 administration attenuates apoptosis of primary ATII cells in the BLM-induced fibrotic phase. Similar to the findings from others studies (Safaeian et al. 2013), apoptosis of ATII cells were significantly enhanced at 14 days after BLM treatment (Fig. 2a and b). However, rGas6 decreased the count of TUNEL-positive ATII cells per HPF 14 days after BLM treatment (Fig. 2a). Additionally, rGas6 suppressed the apoptosis levels of primary ATII cells 14 days post-BLM treatment according to annexin V/PI staining and flow cytometry (from 28.3% to 17.7%) (Fig. 2b). In the lung tissue of the group subjected to both BLM and rGas6 treatment, the protein levels of apoptosis-related markers, including Bax, cleaved caspase-3, and cleaved PARP, were found to be lower than the group treated with BLM alone. However, the protein levels of antiapoptotic marker Bcl-2 were recovered in the BLM + rGas6 group (Fig. 2c). Furthermore, double immunofluorescence staining for cleaved-caspase-3 and SPC (a marker of ATII cells) in lung tissue was explored. When compared to the group treated with BLM alone, administration of rGas6 inhibited apoptosis of ATII cells (cleaved-caspase-3+/SPC+) 14 days after BLM treatment (Fig. 2d and e). Collectively, administration of rGas6 inhibited ATII cell apoptosis in the late fibrotic stage after BLM treatment.
Fig. 2
Inhibition of apoptosis in ATII cells by rGas6 administration. The experimental design was as described in Fig. 1. Mice were euthanized 14 days after BLM treatment. (a) Left: Representative TUNEL-stained and fixed ATII cells (original magnification: 400 ×). Positive staining depicted in green. Nuclei were observed by DAPI staining. Scale bars: 20 μm. Right: Quantitation of the number of TUNEL-positive cells (number/HPF) in the different groups. (b) The cell viability in primary ATII cells was measured by flow cytometry after annexin V-FITC/PI dual staining. Apoptotic cells were quantified as the sum of the percentages of cells in the early and late stages of apoptosis. **P < 0.01, ***P < 0.001 compared with control or for BLM + Sal vs. BLM + rGas6. Data were obtained from three replicates per condition with cells pooled from two mice per replicate (a right, b right). The data are shown as the means ± S.E.M. (c) Immunoblot analysis of Bax, Bcl-2, cleaved caspase-3, and cleaved PARP in lung homogenates. Below: Densitometric analysis of each band normalized to that of β-actin. (d) Representative confocal images of lung sections stained with an anti-SPC antibody (red), anti-cleaved caspase-3 antibody (green), and DAPI (blue) (left). Original magnification: × 400. Scale bars = 20 μm. Quantification of cleaved caspase-3 staining in SPC.+ ATII cells (right). The values represent the means ± S.E.M. of results from three mice from each group. **P < 0.01 compared with Sal control or for BLM + Sal vs. BLM + rGas6
rGas6 administration inhibits fibroblast activationWe determined whether rGas6 administration could inhibit lung fibroblast activation after BLM treatment. Enhanced expression of mRNA related to fibroblast activation markers, like collagen type 1, fibronectin, and α-SMA, after BLM treatment were reversed by rGas6 (Fig. 3a). We explored immunofluorescence to detect activated fibroblasts in lung tissue. Fibroblasts undergoing activation or differentiation into myofibroblasts were identified as cells positive for both S100A4 (a fibroblast marker) and α-SMA (a myofibroblast marker) (Piera-Velazquez and Jimenez 2019; Xia et al. 2017). Approximately 47% of myofibroblasts marked by the expression of α-SMA in the interstitium at 21 days post-BLM treatment (Fig. 3b and c). Lung sections showed a reduction in the quantity of double-stained cells (around 21%), and the protein expression of these markers upon administration of rGas6 at 21 days after BLM treatment. Significantly, the advancement of lung fibrosis relies on the conversion of fibroblasts into an aggressive myofibroblast phenotype. Hyaluronan synthase 2 (HAS2) and CD44 are upregulated in this particular phenotype, and matrix metalloproteinases (MMPs) and their inhibitors are coordinately expressed (Li et al. 2011). The present study showed that BLM-induced increases in invasion in isolated lung fibroblasts were substantially inhibited by rGas6 (Fig. 3d). In addition, enhanced mRNA levels of Has2, CD44, and MMPs, including MMP9, MMP12, and MMP14, in primary lung fibroblasts following BLM treatment were reversed by administration of rGas6 (Fig. 3e). These data suggest that rGas6 administration restrains the aggressive characteristics of stimulated fibroblasts by downregulation of these molecular markers.
Fig. 3
Inhibition of fibroblast activation by rGas6 administration. The experimental design was as described in Fig. 1. Mice were euthanized 14 (a, d-g) or 21 days (b) after BLM treatment. (a, d–f) Primary fibroblasts were isolated from murine lungs. (a) qRT-PCR of collagen type 1, fibronectin, and α-SMA in fibroblast samples. (b) Immunofluorescence staining for α-SMA (red) or S100A4 (green) was performed in lung sections. Arrowheads indicate colocalization of α-SMA in lung fibroblasts. Imaging medium: Vectashield fluorescence mounting medium containing DAPI. Scale bars: 20 μm. Representative images were obtained from three mice per group. (c) Graph representing the number of S100A4/α-SMA double-positive cells compared with the total S100A4-positive cell population in the lung parenchyma. Mean of five HPFs per section ± S.E.M. from three mice in each group. ***P < 0.001 compared with control or for BLM + Sal vs. BLM + rGas6. (d) Phase-contrast microscopy (left) and quantification of invaded fibroblasts (right) using Matrigel-coated Transwell plates. Scale bar: 100 µm. (e) qRT-PCR of Has2, CD44, MMP9, MMP12, and MMP14 in fibroblast samples. *P < 0.05, **P < 0.01, ***P < 0.001 compared with control or for BLM + Sal vs. BLM + rGas6. Data were obtained from five replicates per condition with cells pooled from two mice per replicate (a, d right, e). The data are shown as the means ± S.E.M. (f) Selected heatmaps showing differentially expressed genes encoding adhesion and ECM molecules in primary lung fibroblasts between the BLM + Sal and BLM + rGas6 groups. Red: increased expression; blue: decreased expression. Data were obtained from two replicates per condition with cells pooled from two mice per replicate. (g) Relative expression levels of selected genes from PCR array profiling (f). Log2 fold-change values (ApoSQ-CAF CM vs. CAF CM, fold change > 1.5)
To gain further understanding of the mechanisms through which rGas6 inhibits fibroblast invasion in vivo, we conducted a comprehensive analysis of 84 genes associated with cell adhesion and remodeling of ECM, employing a targeted qRT-PCR array. Comparing the expression of twelve genes linked to cell adhesion between the groups treated with BLM plus rGas6 and the group treated only with BLM, the expression of these genes was reduced by more than two times, including Spp1, Pecam1, Entpd1, Tgfbi, Itga2, Itga4, Itgb2, Itgam, Itgax, Emilin1, Thbs2, Fbln1 (Fig. 3f). Nine ECM remodeling-related genes, including Adamts8, Mmp8, Mmp9, Mmp3, Col2a2, Mmp12, Mmp1a, Col3a1, Adamts2, were also downregulated (> twofold) in the group that received both BLM and rGas6 treatment as opposed to those who received BLM treatment alone. These patterns of gene expression resembled those of non-invasive fibroblasts (Lovgren et al. 2011), suggesting that rGas6 administration inhibits the transition to an invasive myofibroblast phenotype induced by BLM.
rGas6 administration suppresses lung fibrosisThe concentrations or proportion of HGF/TGF-β1are likely pivotal in determining the equilibrium between damage and restoration in the later phases of fibrosis (Lee et al. 2012a, b). To confirm that the suppressive impacts of rGas6 on the EMT and fibroblast activation consequently prevent lung fibrosis, the levels of TGF-β and HGF, the major profibrotic and antifibrotic cytokines, respectively (Lee et al. 2012a, b), were examined following BLM treatment with or without rGas6. In BAL fluid 14 and 21 days after BLM treatment, rGas6 administration inhibited generation of the biologically active TGF-β, whereas HGF production was upregulated in comparison to the group that received BLM alone (Fig. 4a and b). At 14 and 21 days following BLM treatment, rGas6 substantially prevented the increase of mRNA and protein levels of myofibroblast phenotypic markers in lung tissue, such as collagen type 1, fibronectin, and α-SMA (Fig. 4c and d). Importantly, accumulation of collagen in lung tissue, assessed through hydroxyproline content, at 21 days after BLM treatment was substantially attenuated by rGas6 (Fig. 4e). Moreover, Masson’s trichrome staining illustrated a decrease in interstitial areas stained with collagen, accompanied by impaired alveolar structures 21 days after BLM treatment, indicating the protective effects of rGas6 (Fig. 4f). Histopathological assessment of pulmonary fibrosis was conducted employing the established Ashcroft scoring system (Ashcroft et al. 1988). The fibrotic score significantly decreased in the group receiving BLM and rGas6 in comparison to the group receiving BLM alone (Fig. 4g). Collectively, these findings imply that the administration of rGas6 inhibits EMT and fibroblast activation, thereby reducing ECM accumulation and preventing extensive lung injury in this BLM-induced murine lung fibrosis model.
Fig. 4
Inhibition of lung fibrosis by rGas6 administration. The experimental design was as described in Fig. 1. Mice were euthanized on days 14 and 21 after BLM treatment. (a, b) Levels of the active form of the TGF-β1 and HGF proteins in BAL fluid were quantified by ELISAs. (c) qRT-PCR of collagen type1, fibronectin, and α-SMA in lung tissue samples. (d) Left: Immunoblot analysis of the indicated proteins in lung homogenates. Right: Densitometric analysis of each band normalized to that of β-actin. (e) Collagen deposition in the whole lung was determined by measuring the hydroxyproline content on day 21. (f) Lung sections were visualized with Masson’s trichrome staining on day 21. Representative results from five mice per group are shown (scale bar: 50 μm). (g) Ashcroft scoring of the lung sections. The values represent the means ± S.E.M. of results from three (d) or five mice (a–c, e, g) in each group. *P < 0.05, **P < 0.01, ***P < 0.001 compared with Sal control or for BLM + Sal vs. BLM + rGas6
rGas6 administration increases Gas6/Axl signaling events, including COX-2-derived PGE 2 and PGD 2 productionNotably, Gas6 induction has been demonstrated in several fibrosis diseases, including IPF and liver fibrosis (Espindola et al. 2018; Bárcena et al. 2015). In particular, patients with IPF have higher levels of Gas6 expression in both mRNA and protein, compared to normal lung samples and fibroblasts, respectively (Espindola et al. 2018). This trend was consistently observed in our study, where protein levels of Gas6 increased in BAL fluid and in the conditioned media from primary ATII cells and alveolar macrophages of mice lungs post-BLM treatment (Fig. S2a). Moreover, in both primary ATII cells and lung tissue samples from mice, there was an increase in Gas6 expression at the mRNA and/or protein levels following BLM treatment (Fig. S2b–d). We further examined whether rGas6 administration enhances further Gas6 production in the lung post-BLM treatment. The Gas6 protein abundance was not further enhanced in BAL fluid and in the culture media from primary ATII cells and alveolar macrophages by administration of rGas6 (Fig. S2a). In addition, when compared to the group treated with BLM alone, the mRNA and/or protein levels of Gas6 in primary ATII cells and lung tissue in the group treated with both BLM and rGas6 did not increase further (Fig. S2b–d). Collectively, these findings indicate that rGas6 administration does not induce further increases in endogenous Gas6 production in ATII cells and lung tissue.
Next, we examined whether in vivo administration of rGas6 induces such activation of Axl and Mer events in BLM-induced fibrosis. The findings from immunofluorescence demonstrated that the total protein expression levels of Axl and Mer in primary ATII cells (red and green, respectively) were notably increased in the group received both BLM and rGas6 as well as in the group received BLM alone (Fig. 5a). However, the phosphorylation level of Axl in ATII cells was further enhanced by rGas6 compared with that in the group treated solely with BLM, whereas the Mer phosphorylation level was similar to that in the BLM only treated group. Alveolar macrophages showed similar results in the group treated with both BLM and rGas6 showing a greater increase in Axl phosphorylation than the group treated with BLM alone, and between these groups, there was no variation in Mer's phosphorylation levels (Fig. S3). Western blot analysis showed that Axl phosphorylation was further enhanced in lung tissue by administration of rGas6 compared with that in the BLM only treated group, and the Mer phosphorylation levels were comparable between these experimental groups (Fig. 5b). In addition, activation of a downstream molecule in Gas6/Axl signaling, Akt, was also further enhanced in lung tissue by administration of rGas6 in comparison to the group treated with BLM alone (Fig. 5c).
Fig. 5
Axl activation and COX-2-derived PGE2 and PGD2 production induced by rGas6 administration. The experimental design was as described in Fig. 1. Mice were euthanized on day 14 after BLM treatment. (a) Left: Immunofluorescence staining for phospho-Axl (green), total Axl (red), phospho-Mer (red), and total Mer (green) in primary ATII cells. Images were captured at 400 × magnification. Right: Quantification of phospho-Axl, total Axl, phospho-Mer, and total Mer staining in ATII cells. Imaging medium: Vectashield fluorescence mounting medium containing DAPI. Scale bars: 20 μm. Data were obtained from three replicates per condition with cells pooled from two mice per replicate. (b) Left: Immunoblot analysis of total/phospho-Axl and total/phospho-Mer in lung tissue homogenates. Right: Densitometric analysis of each band normalized to that of β-actin. (c) Immunoblot analysis of total/phospho-Akt in lung tissue homogenates. Below: Densitometric analysis of each band normalized to that of total Akt. Data are from independent experiments with three mice per group (mean ± S.E.M.). (d, e) qRT-PCR of COX-2 and COX-1 in ATII cells and lung tissue samples. (f) Immunoblot analysis of COX-2 and COX-1 in lung tissue homogenates. Below: Densitometric analysis of each band normalized to that of β-actin. (d) Data were obtained from five replicates per condition with cells pooled from two mice per replicate. Data were obtained from independent experiments with five (e) or three (f) mice per group. (g, h) PGE2 or PGD2 levels in BAL fluid (BALF, n = 5 mice) and culture supernatants from ATII cells and alveolar macrophages (AM) were measured using an enzyme immunoassay. (h) Data were obtained from five replicates per condition with cells pooled from two mice per replicate. Values represent the means ± S.E.M. *P < 0.05, **P < 0.01, ***P < 0.001 compared with Sal control or for BLM + Sal vs. BLM + rGas6
Next, 14 days after BLM treatment, we measured the COX-1 and COX-2 expression as well as the synthesis of PGE2 and PGD2. In comparison to the BLM alone treated group, the administration of rGas6 further elevated the COX-2 mRNA levels in primary ATII cells as well as the COX-2 mRNA and protein levels in lung tissue (Fig. 5d–f). However, the amounts of COX-1's mRNA and protein remained constant. When rGas6 was administered, the synthesis of PGE2 and PGD2 in BAL fluid as well as the culture supernatants of isolated ATII cells and alveolar macrophages was further increased in comparison to the BLM alone treated group (Fig. 5g and h). Taken together, these findings indicate that rGas6 administration significantly enhances Axl phosphorylation and production of COX-2-derived bioactive molecules, such as PGE2 and PGD2, in ATII cells and alveolar macrophages.
Next, we aimed to confirm an in vivo role of Axl activation after rGas6 administration for PGE2 and PGD2 synthesis by COX-2 using the Axl inhibitor BGB324. The ATII cells' COX-2 mRNA level and the PGE2 and PGD2 levels in their culture media were both elevated by rGas6 day 14 post-BLM treatment. These effects were reversed by co-administration with BGB324, as shown in Fig. S4a-c. However, when NS-398 was co-administered with rGas6, rGas6-induced increases in PGE2 and PGD2 production were downregulated in the culture media from ATII cells (Fig. S4b and c). Collectively, these data suggested that rGas6-induced increases in Axl activation in ATII cells induce COX-2-dependent PGE2 and PGD2 production, which are well known for their inhibitory roles in EMT and fibroblast activation, thus preventing lung fibrosis [41, 42].
Gas6/Axl signaling events are required for inhibition of EMT and fibroblast activationTo confirm the involvement of Gas6/Axl signaling pathways in mediating the inhibitory effects on BLM-induced EMT and fibroblast activation, the Axl selective inhibitor BGB324, the COX-2 inhibitor NS-398, and PGE2 and PGD2 receptor antagonists, including EP2/EP4 (AH-6809) and DP2 (BAY-u3405) antagonists, were co-administered with rGas6 1 day before BLM treatment and then administered once/day (AH-6809) or once every 2 days (BGB324, NS398, and BAY-u3405) for 2 weeks after BLM treatment. When BGB324, NS-398, AH-6809, or BAY-u3405 was administered together, the anti-EMT effects of rGas6 were significantly reduced. This included the inhibition of E-cadherin loss, the reduction of N-cadherin and α-SMA synthesis at the mRNA levels (Fig. 6a), and the restoration of Snai1, Zeb1, and Twist1 mRNA levels in primary ATII cells 14 days after BLM treatment (Fig. 6b). However, these inhibitors alone had no effect in mice treated with BLM alone.
Fig. 6
Inhibition of EMT and fibroblast activation via Gas6/Axl signaling events. Where indicated, the Axl inhibitor BGB324 (BGB, 5 mg/kg, i.o.), COX-2 inhibitor NS-398 (NS, 5 mg/kg, i.o.), EP1/EP2 inhibitor AH-6809 (AH, 5 mg/kg, i.p.), or DP2 inhibitor BAY-u3405 (BAY, 30 mg/kg, i.p.) was co-administered with rGas6 1 day before BLM treatment and then administered once/day (AH) or once every 2 days (BGB, NS, and BAY). Mice were euthanized 14 days following BLM treatment. (a, b) qRT-PCR of EMT markers and EMT-regulating transcription factors in primary ATII cells. (c, d) qRT-PCR of activated fibroblast markers and invasive myofibroblast-related molecules in primary lung fibroblasts. (e) Left: The cells were visualized by phase-contrast microscopy to analyze their invasive ability in Matrigel-coated Transwell assays. Scale bar: 100 µm. Right: The invaded fibroblasts were quantified by counting the number of cells adhering to the bottom surface of the upper chamber. *P < 0.05, **P < 0.01, ***P < 0.001 compared with BLM + Sal or for BLM + Gas6 vs. BLM + rGas6 + the inhibitor. Data were obtained from five replicates per condition with cells pooled from three mice per replicate (means ± S.E.M.)
We also examined whether Gas6/Axl signaling events inhibit fibroblast activation using these inhibitors. Importantly, co-administration of inhibitors (BGB324, NS398, AH-6809, or BAY-u3405) inhibited the rGas6-induced reduction in the mRNA expression levels of activated fibroblast markers, such as collagen type 1, fibronectin, and α-SMA, as well as invasive fibroblast phenotype-mediating factors, such as Has2, CD44, MMP9, MMP12, and MMP14, in primary fibroblasts at 14 days post-BLM treatment (Fig. 6c and d). However, these inhibitors had no significant effect in mice treated with BLM alone. Indeed, the inhibition of fibroblast invasion by rGas6 administration was also counteracted by co-administration of these inhibitors. (Fig. 6e). Collectively, these findings suggest that Gas6/Axl signaling events consequently mediate rGas6-induced inhibition of the EMT process and fibroblast activation in BLM-induced lung fibrosis.
The progression of the EMT and the activation of fibroblasts are aggravated in Gas6 −/− miceTo confirm the suppressive function of endogenous Gas6 in BLM-induced fibrosis, we examined changes in the EMT process, fibroblast activation, and hydroxyproline content using Gas6−/− and wild-type (WT) control mice after BLM treatment. Using fluorescent immunocytochemical staining, we confirmed the loss of Gas6 in primary ATII cells of Gas6−/− mice (Fig. S5a). Additionally, in both isolated ATII cells and lung tissue from Gas6−/− animals with or without BLM treatment, endogenous Gas6 expression at the mRNA and/or protein levels was not detected (Fig. S5b-d). After 14 days of BLM treatment, ATII cells from Gas6−/− mice exhibited modifications in EMT markers' mRNA levels caused by BLM, including α-SMA, N-cadherin, and E-cadherin, as well as increases in transcription factors that regulate EMT, including Snai1, Zeb1, and Twist1, when compared to WT control mice (Fig. 7a and b). Comparing lung tissue from Gas6−/− mice to WT control mice, similar results were found regarding the mRNA expression levels of EMT markers and EMT-regulating transcription factors (Fig. 7c). Significant elevation in the mRNA levels of activated fibroblast markers, such as collagen type 1, fibronectin, and α-SMA, and invasive fibroblast phenotype-regulating molecules, such as CD44, MMP9, MMP12, and MMP14, were also observed in primary fibroblasts from Gas6−/− mice at 14 days post-BLM treatment than in those from WT control mice (Fig. 7d). Additionally, BLM-induced alterations in markers related to EMT and fibroblast activation, including E-cadherin, N-cadherin, collagen type-1, fibronectin, and α-SMA, at the protein level were amplified in lung tissue from Gas6−/− mice compared with that from WT mice (Fig. 7e). Simultaneously, BLM-induced the levels of PGE2 and PGD2 in BAL fluid and conditioned media from ATII cells and alveolar macrophages were reduced in Gas6−/− mice (Fig. 7f and g), but the hydroxyproline amount in lung tissue from Gas6−/− mice was further enhanced compared with that in WT control mice (Fig. 8a). Furthermore, interstitial regions marked by collagen deposition in interstitial areas with impaired alveolar structures, and fibrotic scores were additionally heightened in Gas6−/− mice 14 days post-BLM treatment compared with those in WT control mice (Fig. 8b and c). Collectively, these data suggest Gas6-deficient mice exhibit exaggerated BLM-induced EMT and fibroblast activation, leading to further accumulation of collagen and intensified fibrosis, indicating a protective role of Gas6 against the progression of pulmonary fibrosis.
Fig. 7
Effect of Gas6 deficiency on EMT and fibroblast activation. WT and GAS6−/− mice were intratracheally instilled with BLM (5 U/kg). Mice were euthanized 14 days after BLM treatment. (a–c) qRT-PCR of EMT markers and EMT-regulating transcription factors in primary ATII cells (a, b) and lung tissue (c). (d) qRT-PCR of activated fibroblast markers and invasive myofibroblast phenotype-regulating molecules in primary fibroblasts. (e) Left: Immunoblot analysis of the indicated proteins in lung tissue. Right: Densitometric analysis of each band normalized to that of β-actin. (f, g) PGE2 and PGD2 levels in BAL fluid (BALF) and conditioned media of ATII cells and alveolar macrophages (AM) were measured using an enzyme immunoassay. *P < 0.05, **P < 0.01, ***P < 0.001 compared with Sal control or for WT + BLM vs. GAS6−/− + BLM. Data were obtained from three (f and g middle, right) or five replicates (a, b, d) per condition with cells pooled from two mice per replicate (means ± S.E.M.). Values represent the means ± S.E.M. of results from three (e right, f and g left) or five mice (c) per group
Fig. 8
Effect of Gas6 deficiency on collagen deposition in lung fibrosis. WT and GAS6−/− mice were intratracheally instilled with BLM (5 U/kg). Mice were euthanized 14 days after BLM treatment. (a) Collagen deposition in the whole lung was determined by measuring hydroxyproline content. (b) Lung sections were visualized with Masson’s trichrome staining on day 14. Representative results from three mice per group are shown (scale bar: 50 μm). (c) Ashcroft scoring of the lung sections. *P < 0.05, **P < 0.01, ***P < 0.001 compared with Sal control or for WT + BLM vs. GAS6−/− + BLM. Values represent the means ± S.E.M. of results from three (c) or five mice (a) per group
In vitro exposure of LA-4 cells to rGas6 inhibits myofibroblast phenotypic markersTo ascertain the direct relationship between GAS6 signaling in ATII cells and the activation of lung fibroblasts, the conditioned medium from ATII-like lung (LA-4) epithelial cells treated with rGas6 (400 ng/ml) was applied to lung fibroblasts (MLg cells) with or without TGF-β1. Exposure to this conditioned medium inhibited TGF-β1-induced mRNA and protein expression of collagen type 1, fibronectin, and α-SMA (Fig. S6a-d). However, conditioned medium derived from LA-4 cells without exposure to rGas6 did not exhibit the inhibitory effect. These data indicate that the downregulation of fibroblast activation is contingent upon paracrines secreted from LA-4 cells stimulated with rGas6.
留言 (0)