
記住我
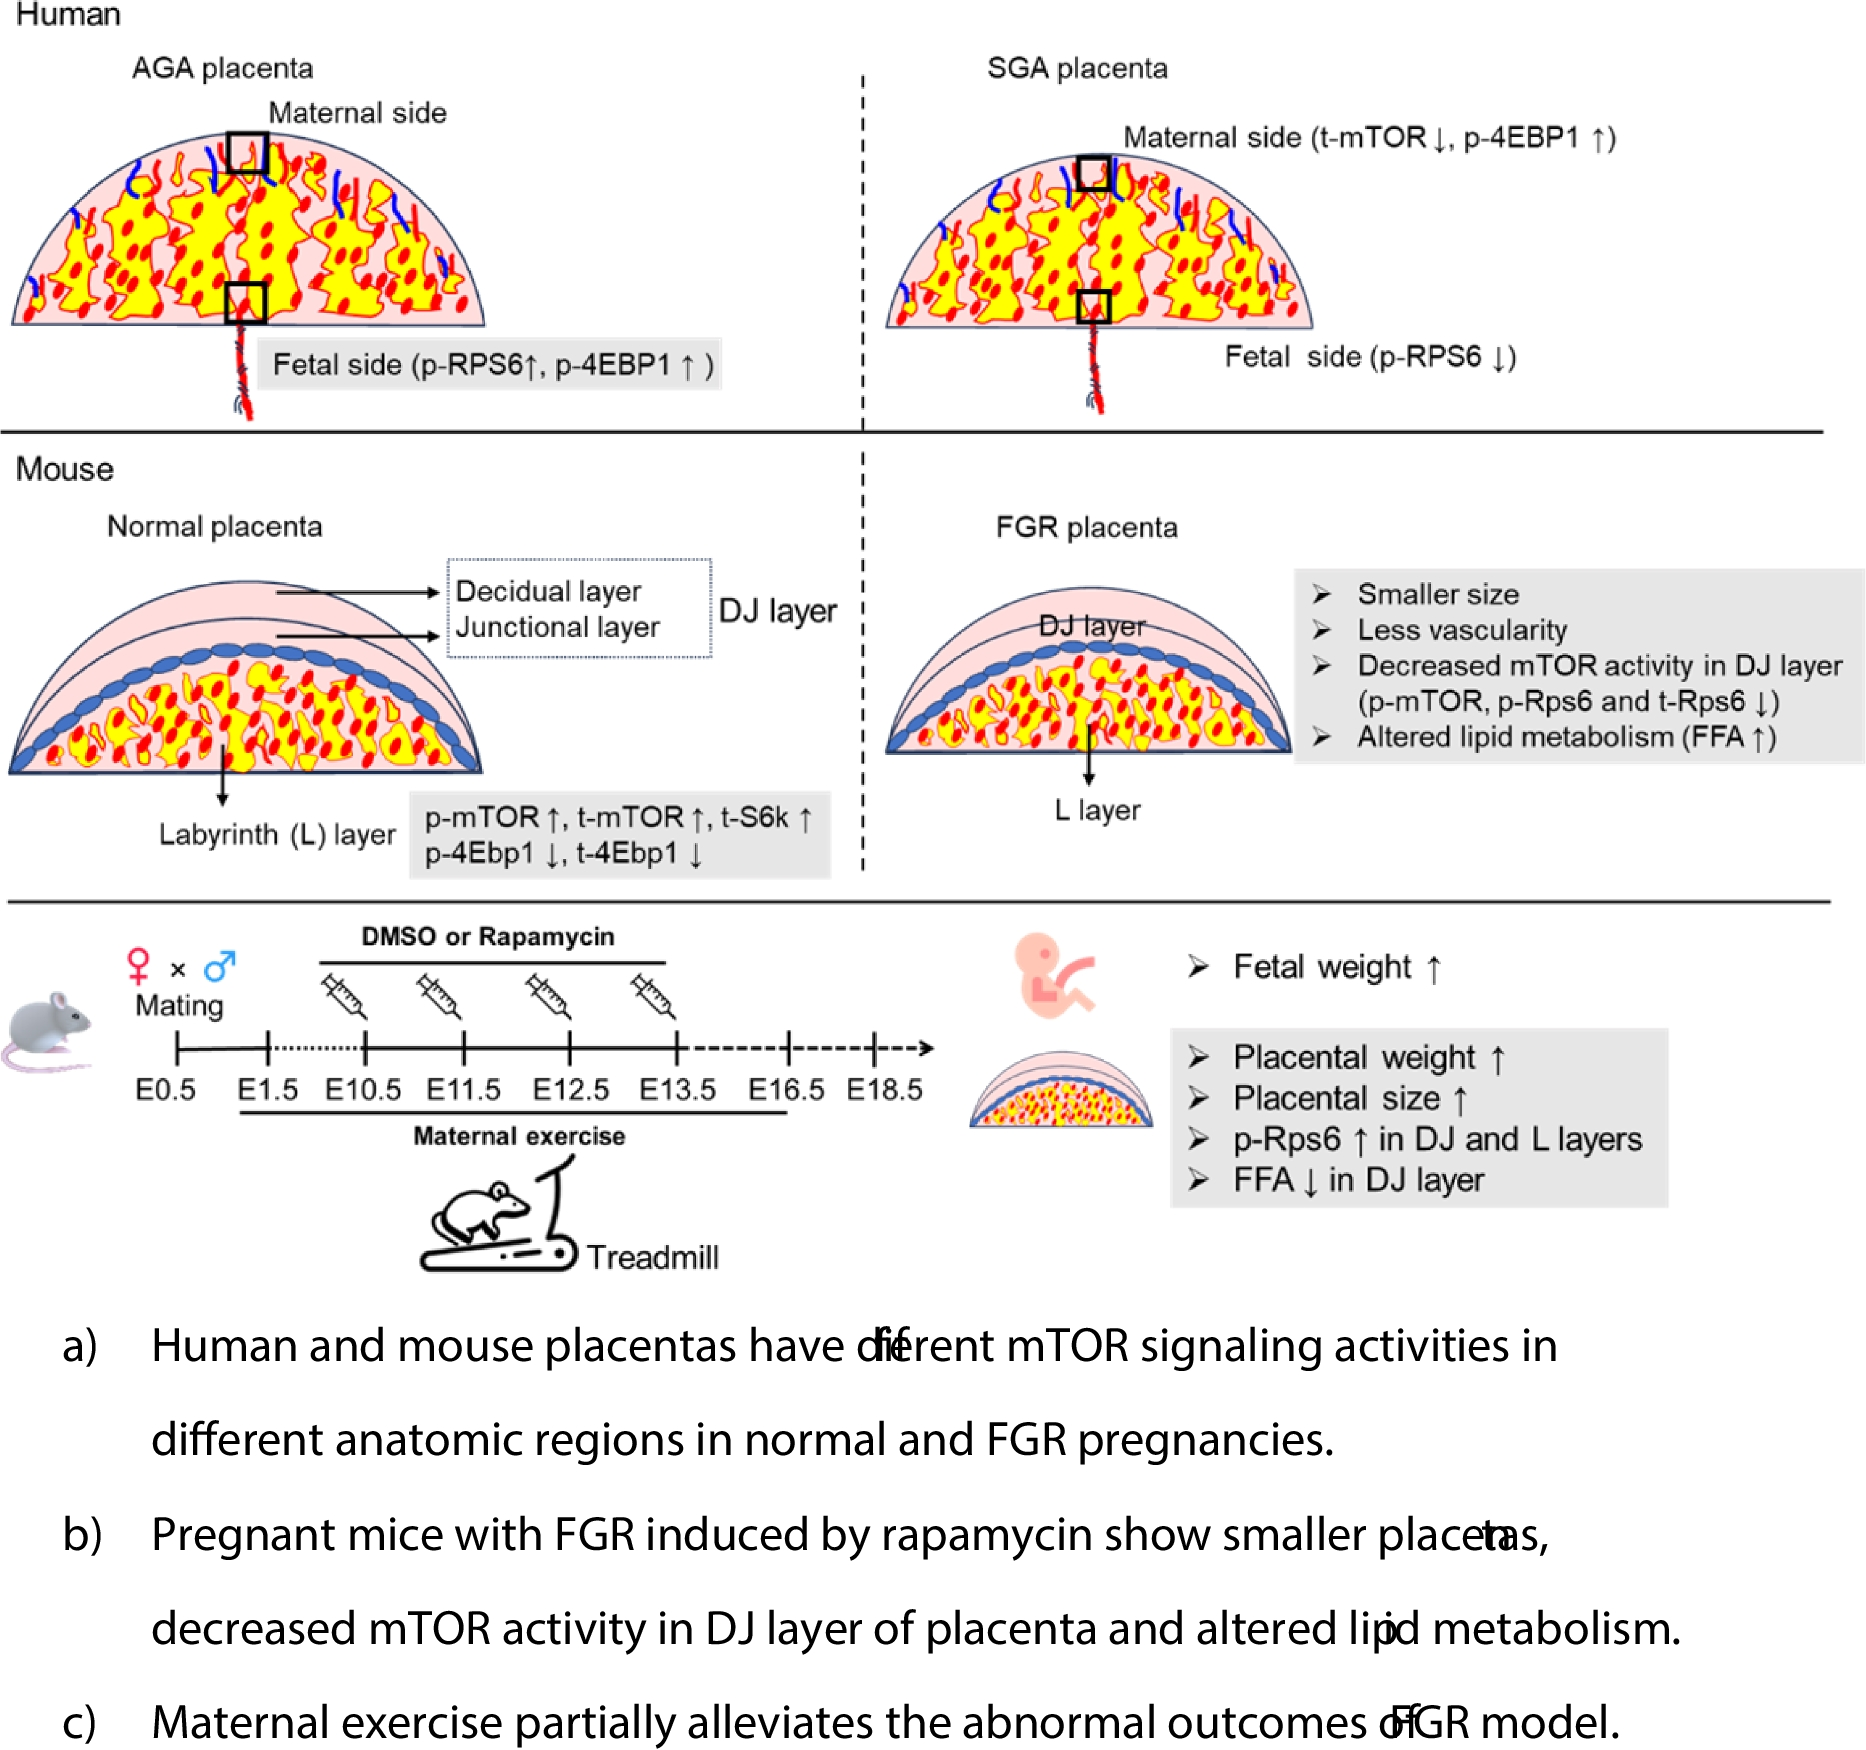
We firstly compared the levels of the total and phosphorylated mTOR-related proteins (including mTOR, S6K, RPS6 and 4EBP1) in the placentas of normal human pregnancies (clinical information shown in Supplementary Table 1). We found that p-RPS6 and p-4EBP1 had significantly higher levels in the fetal side of placenta compared to the maternal side, and the levels of p-mTOR, t-mTOR, t-S6K, t-RPS6 and t-4EBP1 were similar between the fetal and maternal sides (Fig. 1a and b). The results suggested that the activities of mTOR-related proteins in the fetal side were different from the maternal side.
Fig. 1
The protein levels of the key genes associated with mTOR signaling in human full-term placentas. (a): The comparison of mTOR-related protein levels (t-mTOR, t-S6K, t-RPS6 and t-4EBP1) and phosphorylation activities (p-mTOR, p-RPS6 and p-4EBP1) between maternal-side and fetal-side of human placentas (n =6/each side). (b): The representative blots of mTOR-related molecules and total proteins shown by Coomassie staining in normal full-term human placentas. (c): The comparison of mTOR-related protein levels and phosphorylation activities in maternal side of human placentas between AGA (n =10) and SGA (n =8) group, and the representative blots. (d): The comparison of mTOR-related protein levels and phosphorylation activities in fetal side of human placentas between AGA (n =10) and SGA (n =8) group, and the representative blots. Pair-wise or Student’s t-test was used for statistical analysis and p-value < 0.05 was significant. ns: not significant, *p < 0.05, **p < 0.01
Subsequently, we analyzed the changes in mTOR activity in the fetal and maternal sides of placentas from SGA compared to control, or AGA, neonates. The baseline clinical data are reported in Supplementary Table 2. Our results showed that in the maternal side of SGA placentas the expression of t-mTOR was significantly decreased while the level of p-4EBP1 was increased, compared to controls (Fig. 1c). However, in the fetal side of SGA placentas, we only observed a robust reduction in the level of p-RPS6 (Fig. 1d). These findings suggest that mTOR activity exhibits inconsistent patterns in different anatomic locations of human placentas under both normal and SGA conditions.
Differential expression of mTOR-related proteins in different anatomic layers of mouse placentasAs depicted in Fig. 2a, we partitioned the mouse placenta into three segments: the decidua junction (DJ) layer, the labyrinth (L) layer, and the composite DJ and L (DJ + L) layer. HE staining displayed the general structures of DJ, L and DJ + L layers, as shown in Figure S1. By means of IF staining of Tpbpa, a specific biomarker for spongiotrophoblast cells, we distinguished the DJ and L layers in the mouse placenta (Fig. 2b). The RT-qPCR and WB assays demonstrated that Tpbpa mRNA and protein were preferentially expressed in the DJ layer compared to the L layer, indicating the significance and purpose of our mouse placenta separation methodology for subsequent analyses (Fig. 2c and e). We assessed the protein levels and phosphorylation activities of four key mTOR-related genes (mTOR, S6k, Rps6, and 4Ebp1) in mouse placentas. Our results indicated that the levels of p-mTOR, t-mTOR, and t-S6k were significantly lower in the DJ layer than in the L layer, whereas the levels of p-4Ebp1 and t-4Ebp1 were markedly higher in the DJ layer than in the L layer. No differences were found in the levels of p-Rps6 and t-Rps6 between the DJ and L layers (Fig. 2d and e). Our findings demonstrate that the key molecules in mTOR signaling exhibit variable expression and phosphorylation activity across distinct anatomic regions in mouse placentas.
Fig. 2
The expression levels of Tpbpa, mTOR, S6k, Rps6 and 4Ebp1 in different anatomic regions of mouse placentas at E14.5. (a): The separation of mouse placenta based on its structure layers. One mouse placenta was divided into decidual and junctional (DJ) layer, labyrinth (L) layer and half of the whole one (DJ + L layer) for RT-qPCR and WB. (b): The IF staining of Tpbpa, a marker for spongiotrophoblast cells, was used to distinguish DJ and L layer. (c): The mRNA and protein expression of Tpbpa in DJ, L and DJ + L layers of mouse placentas (n =6 dams). (d): The mTOR-related protein levels and phosphorylation activities in different anatomic regions (DJ, L and DJ + L) of mouse placentas (n =6 dams). (e): The representative protein blots. One-way ANOVA test was used for the global comparison and Turkey’s test for the pairwise comparison, and p-value < 0.05 was significant. ns: not significant, *p<0.05, **p<0.01, ***p<0.001
Differential expression of mTOR-related proteins in different anatomic layers of rapamycin-induced FGR mouse placentasGiven the differential expression and phosphorylation of key proteins in the mTOR signaling pathway across anatomical regions of normal mouse placenta, we sought to investigate whether there would be variation in these findings with FGR placentas. Utilizing the rapamycin-induced FGR mouse model (Fig. 3a), pregnant mice receiving low-dose (0.01 mg/kg) or high-dose (0.02 mg/kg) rapamycin exhibited significantly reduced fetal and placental weight at E14.5, with the survival rate of fetuses being lower in the high-dose group (Fig. 3b, c). We primarily compared control and low-dose rapamycin groups in the subsequent experiments.
Fig. 3
The activity changes of mTOR signaling in different regions of mouse placentas in the FGR model. (a): The rapamycin-induced FGR model. Pregnant mice at E10.5 received daily intraperitoneal injection with 0.01 or 0.02 mg rapamycin or DMSO per dam from E10.5 to E13.5, and sacrificed at E14.5. (b): The fetal weight and placental weight at E14.5 in control (Ctrl) and rapamycin (Rapa) group (n =8–10 dams/each group). (c): The survival rate of fetuses after rapamycin injection (n: the number of fetuses). (d): The mTOR signaling activity in DJ layer after rapamycin treatment (n =9 dams/each group). (e): The mTOR signaling activity in L layer after rapamycin treatment (n =9 dams/each group). (f): The mTOR signaling activity in DJ + L layer after rapamycin treatment (n =9 dams/each group). One-way ANOVA test or student’s t-test was used for the statistical analysis. ns: not significant, **p<0.01. ****p<0.0001
To confirm the inhibitory effect of rapamycin on placental mTOR signaling in mice, we examined mTOR activity in the three parts of mouse placentas, as depicted in Fig. 2a. Our results showed that in the DJ layer the levels of p-mTOR, p-Rps6, and t-Rps6 were significantly reduced in rapamycin-treated compared to control placentas (Fig. 3d and Figure S2a-d). In contrast, no changes were observed in the levels and activities of mTOR-related targets in the L layer between the two groups (Fig. 3e and Figure S2e-h). Notably, in placentas containing both DJ and L components, there was a substantial decrease in the levels of p-Rps6 and t-Rps6 in the rapamycin group compared to control (Fig. 3f and Figure S2i-l). These data collectively suggest that FGR established by inhibiting placental mTOR signaling in our mouse model develops through variable levels of activity of key mTOR signaling molecules in different regions of the placenta.
Histological findings in rapamycin-induced FGR mouse placentasTo investigate the potential mechanisms underlying FGR induced by rapamycin treatment, we conducted morphological analyses of control and FGR placentas. HE staining revealed that FGR placentas were smaller in size and thinner than control placentas, especially in the junctional layer (Fig. 4a). To study the change of the spongiotrophoblast distribution in mouse placentas, we analyzed Tpbpa protein, which labels spongiotrophoblast cells. We observed that the Tpbpa-positive area was relatively flat in FGR placentas exposed to rapamycin, compared to the irregular shape observed in control placentas (Fig. 4b). Moreover, the ratio of Tpbpa-positive area was significantly reduced in FGR placentas (Fig. 4c). To examine the overall distribution of vascular endothelial cells and mesenchymal cells in mouse placentas, we performed IF staining using CD31and Vimentin, respectively. Our results revealed that CD31 intensity was significantly decreased in FGR placentas compared to controls, but Vimentin expression was similar (Fig. 4d-f, and Figure S3). Collectively, our findings suggest that the mouse placenta displays abnormal morphological characteristics in the FGR model induced by rapamycin.
Fig. 4
The morphological analysis of mouse placentas from Ctrl and Rapa (low-dose/ 0.01 mg Rapa) groups at E14.5. (a): HE staining and placental thickness (n =5/each group). Each placenta sample contains DJ and L layer. (b): IF staining of Tpbpa (red) and DAPI (blue) used for nuclear staining. (c): The comparison of the ratio of Tpbpa-positive area between Ctrl and Rapa placentas (n =5/each group). (d): IF staining of Vimentin (a marker for interstitial cell, red), CD31(a marker for endothelial cells, green) and DAPI (blue). (e): The comparison of Vimentin intensity between Ctrl and Rapa placentas (n =5 dams/each group). (f): The comparison of CD31 intensity between Ctrl and Rapa placentas (n =5 dams/each group). Student’s t-test was used for statistical analysis and p-value<0.05 was significant. ns: not significant, **p<0.01. ***p<0.001
Analysis of mRNA sequencing in control and rapamycin-induced FGR mouse placentasTo explore the underlying molecular mechanisms involved in FGR induced by rapamycin, we conducted mRNA transcriptome analysis on mouse placentas from three groups: control, low-dose rapamycin, and high-dose rapamycin. Compared to control placentas, we identified 68 differentially expressed (DE) mRNA in the low-dose rapamycin group and 106 DE mRNA in the high-dose group (Fig. 5a). To further refine the DE transcripts, we focused on the 37 overlapped DE mRNA (12 upregulated and 25 downregulated) among the three groups and generated a heatmap (Fig. 5b). Subsequent enrichment analysis of the DE mRNAs revealed multiple biological processes including regulation of development growth, regulation of lipid localization, organ growth, intestinal lipid absorption, and receptor ligand activity (Fig. 5c). Cnetplot of KEGG enrichment analysis also reflected the involvement of the lipid-related pathways and corresponding genes (Fig. 5d). Given the crucial role of lipid metabolism in placental and fetal growth, we further identified the expressions of five genes (Enpp7, Acacb, Cyp4f18, Msr1 and Clps) associated with lipid metabolism. The mRNA levels of Enpp7, Acacb, and Clps were significantly decreased in both the DJ and L layers of FGR placentas compared to control (consistent with the mRNA sequencing results), while the expressions of Cyp4f18 and Msr1 were not altered in FGR placentas (Fig. 5e and f). Collectively, these findings suggest that FGR induced by rapamycin may be attributed to the disruption of lipid metabolism within the mouse placenta.
Fig. 5
The analysis of mRNA sequencing on mouse placentas from Ctrl and Rapa fetuses at E14.5. (a): The number of DE mRNAs among the three groups (Ctrl, 0.01 mg Rapa and 0.02 mg Rapa, n =5 dams/each group). DE mRNAs were set as |Log2FC|> 1.5 and p<0.05. (b): The heatmap of DE mRNAs, showing the overlapped 37 DE mRNAs (blue: downregulation, red: upregulation). (c): Functional enriched signaling pathways for the overlapped DE mRNAs. (d): Cnetplot of KEGG enrichment analysis for common DE genes, showing enriched KEGG terms and corresponding genes. The mRNA expression identification of genes (Enpp7, Acacb, Clps, Cyp4f18 and Msr1) associated with lipid metabolism in DJ-layer (e) and L-layer (f) of mouse placentas (n =6/each group) between Ctrl and 0.01 mg Rapa group. Student’s t-test was used for statistical analysis and p-value<0.05 was significant. ns: not significant, **p<0.01. ***p<0.001. ****p<0.0001
Analysis of lipid molecules in different anatomic layers in rapamycin-induced FGR placentasLipids are essential for placental and fetal development and their activity may be altered in FGR placentas, as indicated by the enrichment analysis results of DE mRNAs mentioned previously. We thusly compared the lipid components between control and low-dose rapamycin groups using lipidomics analysis in both the DJ and L layers of mouse placentas. The original data are listed in Supplementary Excel 1 and 2, respectively. We quantified the comparative values of individual lipid types and found that 138 lipid molecules were changed in the DJ layer and 246 lipids changed in the L layer of FGR placentas compared to controls (Fig. 6a). A total of 61 different lipid components were simultaneously changed in the DJ and L layers of mouse placentas between the two groups (Fig. 6a, Supplementary Table 3). The principal component analysis revealed that clusters of lipid molecules in FGR placentas differed significantly from controls, regardless of the tissue origin (DJ layer or L layer) (Fig. 6b). Specifically, we analyzed 29 different types of lipids in the DJ and L layers of mouse placentas, comparing lipid content of rapamycin-induced FGR placentas to those of control placentas (Fig. 6c, d). We found that in the DJ layer four types of lipids (FFA, CE, Gb3 and CL) were substantially upregulated, while GM3 was downregulated (Fig. 6e), and in the L layer seven lipid types (DAG, PS, CE, TAG, FFA, CL and BMP) were significantly increased, whereas acylcarnitine was decreased (Fig. 6f). When further examining lipid types, we found that in general those lipids involved in energy metabolism, such as TAG and FFA, were up-regulated in FGR placentas while structural type lipids, such as CL, PE, and PS, were down-regulated (Supplementary Table 3).
Fig. 6
The comparison of lipid concentrations and ATP-associated protein levels between Ctrl and Rapa (low-dose/ 0.01 mg Rapa) mouse placentas at E14.5. (a): Principal component analysis of lipid molecule concentrations detected by lipidomics in DJ and L layer of mouse placentas (n=6/each group) from Ctrl and Rapa group, respectively. (b): Lipidomic heatmap showing the differential abundance of major lipid components in DJ layer of mouse placentas from Ctrl and Rapa group (n =6 dams/each group). (c): The heatmap showing the differential abundance of major lipid components in L layer of mouse placentas. (d): The comparison of multiple lipids which are significantly changed in DJ layer of Rapa placentas compared with controls (n =6 dams/each group). (e): The comparison of multiple lipids which are significantly changed in L layer of Rapa placentas comparing with controls (n =6 dams/each group). (f): The number of lipid components with significantly different levels in DJ and L layers of mouse placentas between Ctrl and Rapa group. (g): The expressions of ATP regulatory proteins CII and CV in DJ and L layer of mouse placentas between Ctrl and Rapa group (n =7 dams/each group), measured by WB. Student’s t-test was used for statistical analysis and p-value<0.05 was significant. ns: not significant, *p<0.05, **p<0.01, ***p<0.001
Previous studies have reported that rapamycin administration can impact lipid concentrations in circulating blood (Morrisett et al. 2002; Framarino-dei-Malatesta et al. 2014). We measured the serum concentration of the three major lipids FFA, TAG, and Cho in pregnant mice and did not observe a difference between control and rapamycin groups (Figure S4 a-c). Our data suggests that FGR affects the levels of multiple lipids in mouse placentas without impacting maternal circulating lipids.
To further understand the potential mechanism underlying the lipid changes observed in FGR placentas, we assessed the mRNA levels of several genes involved in lipid oxidation (Cpt1a, Cpt1b, Cpt1c, Acaca and Acacb), lipogenesis (Fasn), lipid transport (Slc27a2, Slc27a4, Slc27a6 and Cd36), and relevant regulation factors (Srebf1, Srebf2, Soat1, Soat2, Ppar-α, Ppar-β/δ and Ppar-γ). The results showed that in the DJ layer the most investigated genes (including Acaca, Fasn, Slc27a6, Srebf1, Srebf2, Soat1, Soat2, Ppar-β/δ and Ppar-γ) showed lower mRNA levels in FGR placentas than in controls (Figure S5a). Similarly, in the L layer, several genes (including Cpt1a, Cpt1b, Fasn, Slc27a6, Cd36, Srebf2, Soat1 and Ppar-β/δ) were expressed at lower levels in FGR placentas than in controls (Figure S5b). The findings suggest that many of the genes associated with lipid metabolism are downregulated in FGR placentas, which may explain the abnormal changes observed in several lipid components. We found the concentration of multiple lipids to be increased in the DJ and L layers of FGR mouse placentas. We investigated whether energy supply was altered in FGR placentas by measuring the expression of ATP regulatory proteins. We recognized that the expression of CII was unaltered in the DJ layer of FGR placentas; however, the abundance of CV was significantly increased by 23.9% and 48.0% in the DJ or L layers of FGR placentas, respectively (Fig. 6g). These findings indicate that energy metabolism may be altered in the FGR placentas.
Effect of maternal exercise on rapamycin-induced FGR in miceAs FGR placentas exhibited smaller size, high lipid state, and down-regulation of genes associated with lipid transport and metabolism, we speculated that high lipid content and decreased lipid transfer and supply may be because of the limited blood-exchange area in the labyrinth layer of FGR placentas. Studies report that physical exercise during pregnancy is beneficial to placental perfusion and fetal growth (Genest et al. 2012; Brett et al. 2015). We suggest that maternal exercise may promote lipid utilization in FGR placentas and therefore mitigate FGR induced by rapamycin. The experimental design diagram was shown in Figure S6 and consisted of control groups with or without exercise (Ctrl and Ctrl + Ex), and Rapa group with or without exercise (Rapa and Rapa + Ex). The data demonstrated that maternal exercise contributed to a significant increase in fetal and placental weight at late gestation (E18.5) in FGR pregnancies, although it did not fully reverse the reduced fetal growth (Fig. 7a) or placental weight (Fig. 7b). Additionally, we observed increased invasion of spongiotrophoblast cells, as evidenced by Tpbpa staining, in the labyrinth of FGR placentas exposed to maternal exercise (Fig. 7c and Figure S6a). IF staining revealed that CD31 intensity was decreased in FGR placentas compared to controls at E18.5, but increased with receiving maternal exercise (Fig. 7c and Figure S6b).
Fig. 7
The effect of maternal exercise on fetal and placental weight, placental morphology and mTOR signaling in mouse FGR model caused by rapamycin (low-dose/ 0.01 mg Rapa). (a): The fetal weight at E18.5 in Ctrl (n =9 dams), Ctrl + Ex (n =10 dams), Rapa (n =9 dams) and Rapa + Ex group (n =10 dams). (b): The placental weight at E18.5 in Ctrl (n =9 dams), Ctrl + Ex (n =10 dams), Rapa (n =9 dams) and Rapa + Ex group (n =10 dams). (c): The IF staining of Tpbpa and CD31 in placentas from the four group (n =5/each group) at E18.5. The mTOR signaling activities in DJ-layer (d) and L-layer (e) of mouse placentas from Ctrl (n =6 dams), Ctrl + Ex (n =8 dams), Rapa (n =6 dams) and Rapa + Ex group (n =8 dams) at E18.5, respectively. One-way ANOVA test was used for the global comparison and Turkey’s test for the pairwise comparison, and p-value<0.05 was significant. ns: not significant, *p<0.05, **p<0.01, ***p<0.001, ****p<0.0001
We investigated the effect of maternal exercise on the mTOR signaling pathway in rapamycin-induced FGR mouse placentas. As presented in Fig. 7d, the phosphorylation of Rps6 (p-Rps6) in the DJ layer was significantly decreased in the FGR group compared to controls, but was restored with maternal exercise exposure. In the L layer, we observed that placentas from pregnancies exposed to maternal exercise had an elevated p-Rps6 level, despite no significant difference seen between the unexercised FGR and control groups at E18.5 (Fig. 7e). Additionally, we found the phosphorylation of 4Ebp1 in the L layer of mouse placentas to be significantly reduced in the FGR group, regardless of maternal exercise, compared to the control group (Fig. 7e).
Due to the changes in mTOR signaling observed in different placental regions of FGR mice exposed to maternal exercise, we supposed that placental lipid metabolism may also be affected. We tested the three lipids FFA, TAG, and Cho in mouse placentas. We found that, similar to E14.5, at E18.5 FGR placentas had increased FAA levels in the DJ layer compared with controls, but maternal exercise exposure lowered this level in FGR placentas closer to that of controls (Fig. 8a). When examining TAG levels in the DJ layer, in contrast to E14.5 when similar levels were observed in FGR and control placentas, at E18.5 decreased TAG levels were identified in FGR placentas and maternal exercise was not found to alter these levels (Fig. 8a). Total and free Cho as well as CE were measured and showed no significant differences in the DJ layer of placentas among the four groups at E18.5 (Fig. 8a). Unexpectedly, we did not find the levels of FFA, TAG, or Cho to be different in the L layer of FGR and control placentas with or without maternal exercise at E18.5 (Fig. 8b).
Fig. 8
The change of lipid concentrations and ATP-associated protein levels in mouse placentas at E18.5. (a): The levels of FFA, TAG, total Cho, free Cho and CE in DJ-layer of mouse placentas from Ctrl, Ctrl+Ex, Rapa and Rapa+Ex group (n =5 dams/each group), respectively. (b): The levels of FFA, TAG, total Cho, free Cho and CE in L-layer of mouse placentas from Ctrl, Ctrl+Ex, Rapa and Rapa+Ex group (n=5 dams/each group), respectively. The expressions of ATP regulatory proteins (CII and CV) in DJ-layer (c) and L-layer (d) of mouse placentas from Ctrl (n=6 dams), Ctrl+Ex (n=8 dams), Rapa (n=6 dams) and Rapa+Ex group (n=8 dams), respectively. One-way ANOVA test was used for the global comparison and Turkey’s test for the pairwise comparison, and p-value<0.05 was significant. ns: not significant, *p<0.05, **p< 0.01, ***p< 0.001
Finally, we tested whether maternal exercise altered the expression of ATP regulatory proteins. In the DJ layer of FGR placentas at E18.5 we found that CII expression was significantly decreased and not reversed by maternal exercise, whereas CV expression was not found to be different between the four groups (Fig. 8c). In the L layer of FGR placentas at E18.5 we found that CII expression was not changed but CV level was increased and maternal exercise seemed to further increase CV expression (Fig. 8d).
These results suggest that maternal exercise is beneficial for improving the rapamycin-induced FGR outcomes, and it may be associated with increased placental Rps6 activity as well as availability of FFA in the DJ layer.
留言 (0)