Preparation of fruit extract
The HU fruit samples which were purchased in the second month (February) of the year 2023 from a local resident marketplace in Dopemu, Lagos State, Nigeria (6° 07′ N to 7° 00′ N latitude and 3° 43′ E to 4° 00′ E longitude) had been identified, authenticated and assigned voucher LUH 8996 as earlier illustrated by Salisu et al. [43]. Extraction employed was modified using the method of maceration [2]. The process involved preparing the fresh fruits by washing, slicing, oven-drying at 40 °C and grinding into a powder using electronic milling machine grinder, Lab. Mill, Serial No. 4745, Christy and Norris Ltd. The ground fruit (254 g) was macerated in 1.4 L of absolute sterile water within 72 h. A thin cloth and cotton wool were used to filter homogenate to get rid of every possible residue. The filtrate was placed in a fan assisted oven at 20 °C to dry. The aqueous extract (paste like form) yielded 3.95 g was stored in glassware and used for further analysis.
Qualitative phytochemical examination
Crude aqueous extract (20 mg) from HU fruit was mixed gently with 6 ml of 1% HCl, warmed, filtered, then tested for availability of alkaloids, anthraquinone and cardiac glycosides, saponins, phenol, flavonoids, tannins, phyloba-tannins, terpenoids as well as steroids. The presence (+) and absence (−) of tested phytochemicals were observed and recorded.
Test for alkaloidsWagner’s assay
Dilute HCl and Wagner’s reagent (1 ml) were added to fruit filtrate (3 ml) and shook well. Afterward, colored precipitate (reddish–brown) was formed as the presence of alkaloids [40].
Tests for glycosidesBorntrager’s test of anthraquinone glycoside
Addition of 5% H2SO4 (1 ml) to fruit extract solution (1 ml) made a mixture that was boiled, filtered, shaken with the same volume of chloroform and kept to still for 5 min. Then the lower layer of chloroform was shaken with half of its volume with dilute ammonia. Nonappearance of bright red coloration of ammoniacal layer indicates absence of anthraquinone glycosides in the fruit [40].
Keller–Killiani test of cardiac glycoside
A small amount of fruit extract (5 mg) were treated with anhydrous acetic acid (1 ml) and few drops of ferric chloride solution in a test tube. Then, concentrated sulphuric acid (2 ml) was added cautiously to prepared mixture. An observed reddish–brown ring at the junction of two layers and development of aqua at the lower layer indicated cardiac glycosides existence [45].
Test for saponins
A mixture of fruit sample (1 g) and distilled water (10 ml) was prepared, boiled for 5 min and shaken vigorously and observed in a test tube. Absence of froths indicates lack of saponins [15].
Test for phenol
A few fruits sample (1 g), ethanol (10 ml) and three drops of phenol solution were mixed in a labeled test tube. Nonappearance of a deep green coloration specifies absence of phenol [16].
Test for flavonoids
A mixture of HU fruit extract (1 g), 10 ml of ethanol and 2 drops of FeCl3 was prepared. Observed dark green color specifies flavonoid [15].
Test for tannins
Decoction of fruit extract (1 g) with 10 ml of distilled water was prepared by boiling for 10 min, filtered, cooled and mixed with 0.1% ferric chloride reagent. An observed blue–black precipitate implies tannins availability as delineated in a modified method of Banso and Adeyemo [10].
Test for phyloba-tannins
Aqueous hydrochloric acid (1 ml) was stirred with fruit extract (2 ml), boiled and allowed to cool down. Availability of phyloba-tannins was implicated in precipitate (red) observed. [10].
Test for terpenoids
Some concentrated sulphuric acids (5 ml) were gently added to fruit extract sample (0.5 g) in a test tube. Observation revealed reddish brown coloration indicating terponoids’ presence [9].
Salkowski test for steroids
The crude fruit extracts (2 mg each) were dissolved with chloroform (2 ml) and mixed gently by shaking to form a mixture. Oil of vitriol (2 ml) was poured in prepared mixture to observe red topmost layer in the test tube. This indicates existence of terpenoid [9].
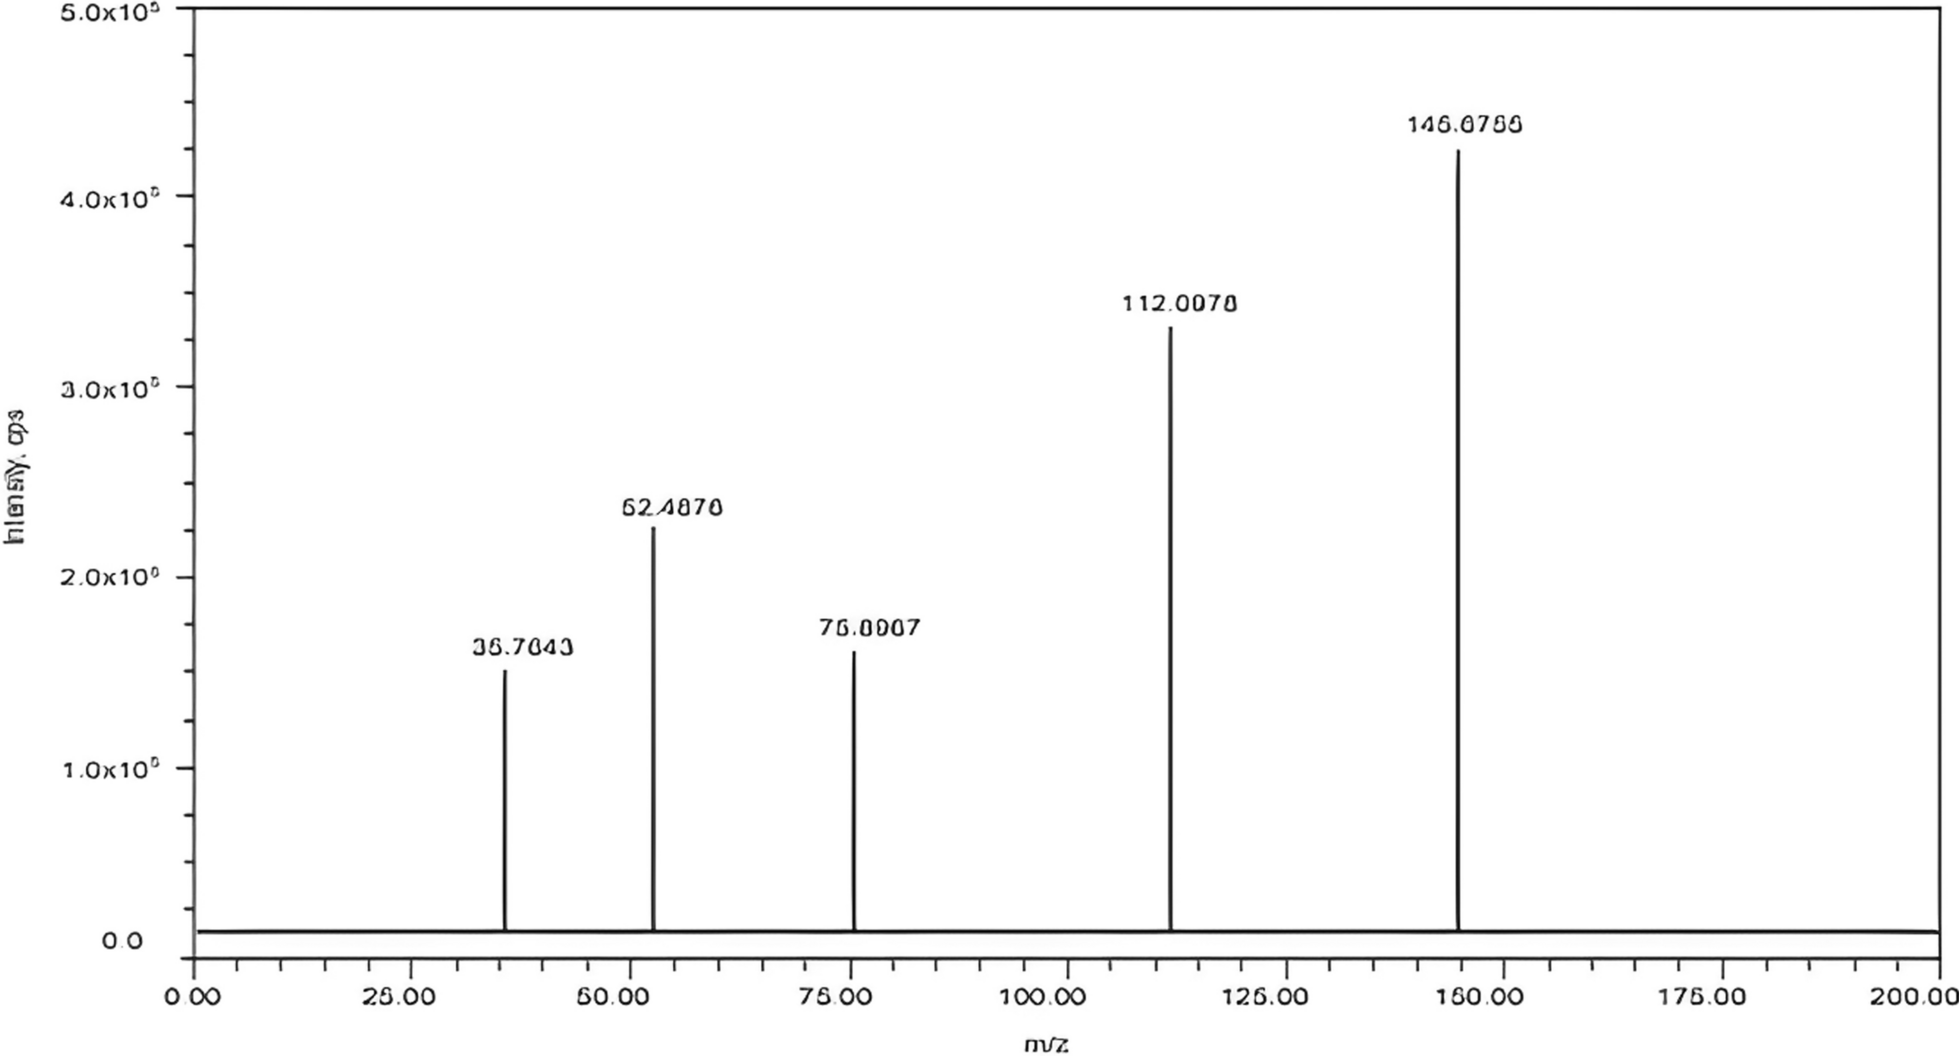
Gas chromatograph/mass spectrometer (GCMS) analysis of bioactive components of Hunteria umbellata fruits
Gas Chromatograph/Mass Spectrometer (GCMS) analysis as reported earlier [42] was carried out in Central Research Laboratory, University of Lagos Akoka, using 7890A Gas chromatography system attached to VL/MSD 5975C mass spectrometer (GC–MS Agilent Technologies, Santa Clara, USA) instrument employing the following settings: Column HP5MS fused silica capillary column [30 m (length) × 0.32 mm (diameter) × 0.25 μm (film thickness)] composed of 100% dimethyl polysiloxane). 1 g of ground fruit samples was dissolved in 10 ml chromatographic grade methanol, filtered by using syringe filter and the clear sample was later injected in GCMS column. Helium gas (99.9999%) was used as the carrier gas at constant flow rate of 1 ml/min and an injection volume of 1 μl was employed with injector temperature at 250 °C and pressure at 8.802 psi. The oven temperature was programmed originally from 80 °C (held for 2 min) with an increase of 5–120 °C/min., then 10–240 °C/min., to hold for 6 min. The total GC running time for the fruit sample was 24 min. The area under a peak accurately represents the quantity of the component present in the sample. Software adopted to handle mass spectra and chromatogram was a ChemStation. The interpretation on mass spectrum of GCMS was done by means of the database of National Institute of Standard and Technology (NIST) version 2, year 2015 library. The mass spectrum of the unknown components was compared with the spectrum of the known components stored in the NIST library to establish the name, molecular weight and structure of the components of the fruit extract.
Collection of bacterial isolates and antibacterial assay
A gram-positive organism, S. aureus strain MBSA2208, was used for this study. The bacteria isolate was obtained from the Department of microbiology, Nigerian Institute of Medical Research (NIMR), plated on salt agar (Mannitol) and then brooded (at 40 °C for 24 h) to obtain pure culture. Antibacterial activity of HU fruit sample was tested by method of broth micro-dilution. A sterilized well (96) microplate was prepared for the experiment. Each well was filled with 90 µL of nutrient broth. In the standard wells, 10 µL of 1 mg/ml vancomycin (a susceptible antibiotic) was added, while the control well, received 10 µL of sterile broth as a sterility control [44]. Minimal inhibitory concentration (MIC) was evaluated by preparation of 0.4 µL of a stock concentration HU extract (250 mg/ml) to arrive at a working solution of 500 µg/µL. This working solution was then serially diluted to obtain two-fold dilutions. The resulting concentrations in column 3 to 11 were 500, 250, 125, 62.5, 31.25, 15.625, 7.8125, and 3.90625 µg/µL. Each well, except for the blank well in column 12, was filled up to 200 µL with nutrient broth that had contained bacteria already inoculated at a standard density of 0.5 McFarland, equivalent to 1.5 × 10⁸ (CFU/mL). This setup allowed for the estimation of the bacterial activity of fruit extract by observing a noticeable growth or inhibition of the bacteria in each well of the microplate. After setting up the microplate with the appropriate concentrations of the extract, standard antibiotic and control. The incubation of the plate was done at 37 °C on a shaker in not more than 24 h. After incubation period, measurements of absorption values in each well with microplate reader at 600 nm absorbance were recorded. This measurement allowed for the determination of the growth difference between the wells before and after incubation, indicating the effectiveness of the extract in inhibiting bacterial growth.
To determine the point of inhibition for each extract, preparation of resazurin dye (0.8 mg/ml) was done. After the 24-h incubation period, A small volume of prepared resazurin solution (30 µL) was dropped in individual well of microplate. Resazurin is a dye that changes color from blue to pink in the presence of oxygen. The microplate was then incubated for an additional 3 h to allow the color change to occur. This color change visually indicated microbes’ growth inhibition due to smallest amount of HU fruit extract in each well.
RNA extraction and purification
For the extraction of single-stranded RNA from the aqueous extracts of H. umbellata, three concentrations were chosen: the highest (500 µg/µL), a moderate (250 µg/µL) and the lowest (125 µg/µL). The extraction was performed via the NIMR Biotech extraction kit according to manufacturer’s description.
The extraction process involved several steps. First, the cells in the extracts were lysed to disrupt cell membranes and make RNA available freely. Lysed samples were then incubated to facilitate the extraction process. After incubation, RNA precipitation was carried out to isolate the RNA from other cellular components. The cell debris and impurities were removed through a washing step to obtain a purified RNA sample. The elution step utilized a spin column-based method, where the purified RNA was eluted from the column, leaving behind any contaminants.
Finally, the extracted single-stranded RNA was stored at − 20 °C until further use. This freezing temperature helps maintain the stability and integrity of the RNA for future analysis or experiments.
Dual-step reverse transcriptase quantitative polymerase chain reaction (RT-qPCR)
A separate reverse transcription coupled with qPCR was carried out. First, extracted RNA was converted to complementary DNA (cDNA). Synthesis mix of FIREScript RT cDNA (Solis Biodyne, Estonia) was used, alongside random primers and Oligo (DT). Prepared reaction mixture consisted of 6.8 µl of double-distilled, molecular-grade water, 2 µl of mastermix, 0.1 µl each of forward and reverse primers in Table 1 as manufactured by the NIMR-MTN Oligo Synthesis Laboratory and 1 µl of the RNA template. These components were combined to create a 10 µl reaction mixture as followed by manufacturer’s manual. Transcription (reverse) process took place for a duration of 30 min at a temperature of 50 °C. After 5 min, transcriptase enzyme was deactivated at a lesser temperature of 85 °C using a BioRad thermal cycler.
Table 1 List of Nucleotide Primers designed for Virulence Genes in Real-Time PCR TechniqueThe second step was the quantitative Polymerase chain reaction (PCR). This reaction was executed to quantify amplifications of expressed genes. The number of amplifications of virulence genes (AGR I and II genes) and the house keeping gene (SA442) of S. aureus used in this study was determined using a real-time system (BioRad CFX96 Deepwell), in accordance with the manufacturer’s description. A 10 µl reaction mixture was prepared containing 5.8 µl double distilled, nuclease free water, 2 µl Solis Biodyne Eva green mastermix, 0.1 µl each of both forward and reverse primers and 2 µl template coding deoxyribonucleic acid (cDNA) for the two primers separately. The processes involved are; initial and final denaturation, annealing, initial and final extension. First denaturation (DNA unwinding) occurred at 95 °C for 2 min, final unwinding took place for just 30secs at the same temperature as the first melting of DNA, annealing was set for 30secs at 54 °C and repeated for 40cycles followed by extension step with temperature range of 55–80 °C with 0.5 °C increment for 5secs.
Ct values (cycle threshold) were generated at the completion of the reaction and used to calculate relative quantification 2−(∆∆ct).
Data analysis
The cycle threshold (ct value) generated from the melt curves plotted by the thermal cycler was used to calculate relative expression using Microsoft Excel (2016 version). Relative expression values were further subjected to IBM SPSS statistics version 22, to determine the increment or decrease in expression of the virulence genes (AGR I and II). All data entries were given as descriptive average alongside standard error means (mean ± SEM), mean difference was compared using a one-way ANOVA analysis and a post-hoc test of LSD (least significance difference). A confidence interval of 95% was used as the criterion for significance to show variations between compared sets.


留言 (0)