
記住我


Of the 46 pigs that underwent surgery, 33 completed the follow-up, distributed as follows: M1 (n = 8), M2 (n = 6), M3 (n = 10), and M0 (n = 9). The reasons for not completing the protocol were inability to generate PH in M1 (n = 2), RV pressure elevation < 25 mmHg in M3 (n = 5), extracardiac complications (n = 5, 4 M0 and 1 M1 pig), and sudden death (n = 1 M3 pig) (Supplementary Fig. 1). Correct surgical execution of the experimental models was confirmed by CT, as follows: significant pulmonary vein stenosis in M1, significant PA stenosis in M3, and patent aorto-pulmonary shunt in M2 (Supplementary Table 3). An interim hemodynamic and CMR characterization at 1-month follow-up is summarized in Supplementary Table 4. As expected, at the final hemodynamic assessment, RV systolic pressure was significantly higher in models M1, M2, and M3 (the most severe) than in the control group (M0), whereas PAP and PVR were significantly elevated in M1 and M2, but not in M3 (Table 1).
Table 1 Hemodynamic characterization of animal models at end of follow-upOn CMR evaluation at end of follow-up, all three RV pressure overload models generated RV hypertrophy compared with the control group, however, RV systolic dysfunction (indicated as increased RV systolic volume and reduced RV ejection fraction) was observed only in models M1 and M2, not in M3 (Table 2). In addition, M1 showed significant RV dilatation (increased indexed RV end-diastolic volume and RV-to-LV end-diastolic volume ratio) and M2 significant LV dilatation associated with increased LV mass. T1 mapping sequences revealed an increase in ECV at the interventricular septum in M1, M2, and M3; at the inferior insertion point in M1 and M2; at the anterior insertion point in M1; and at the LV lateral wall in M2.
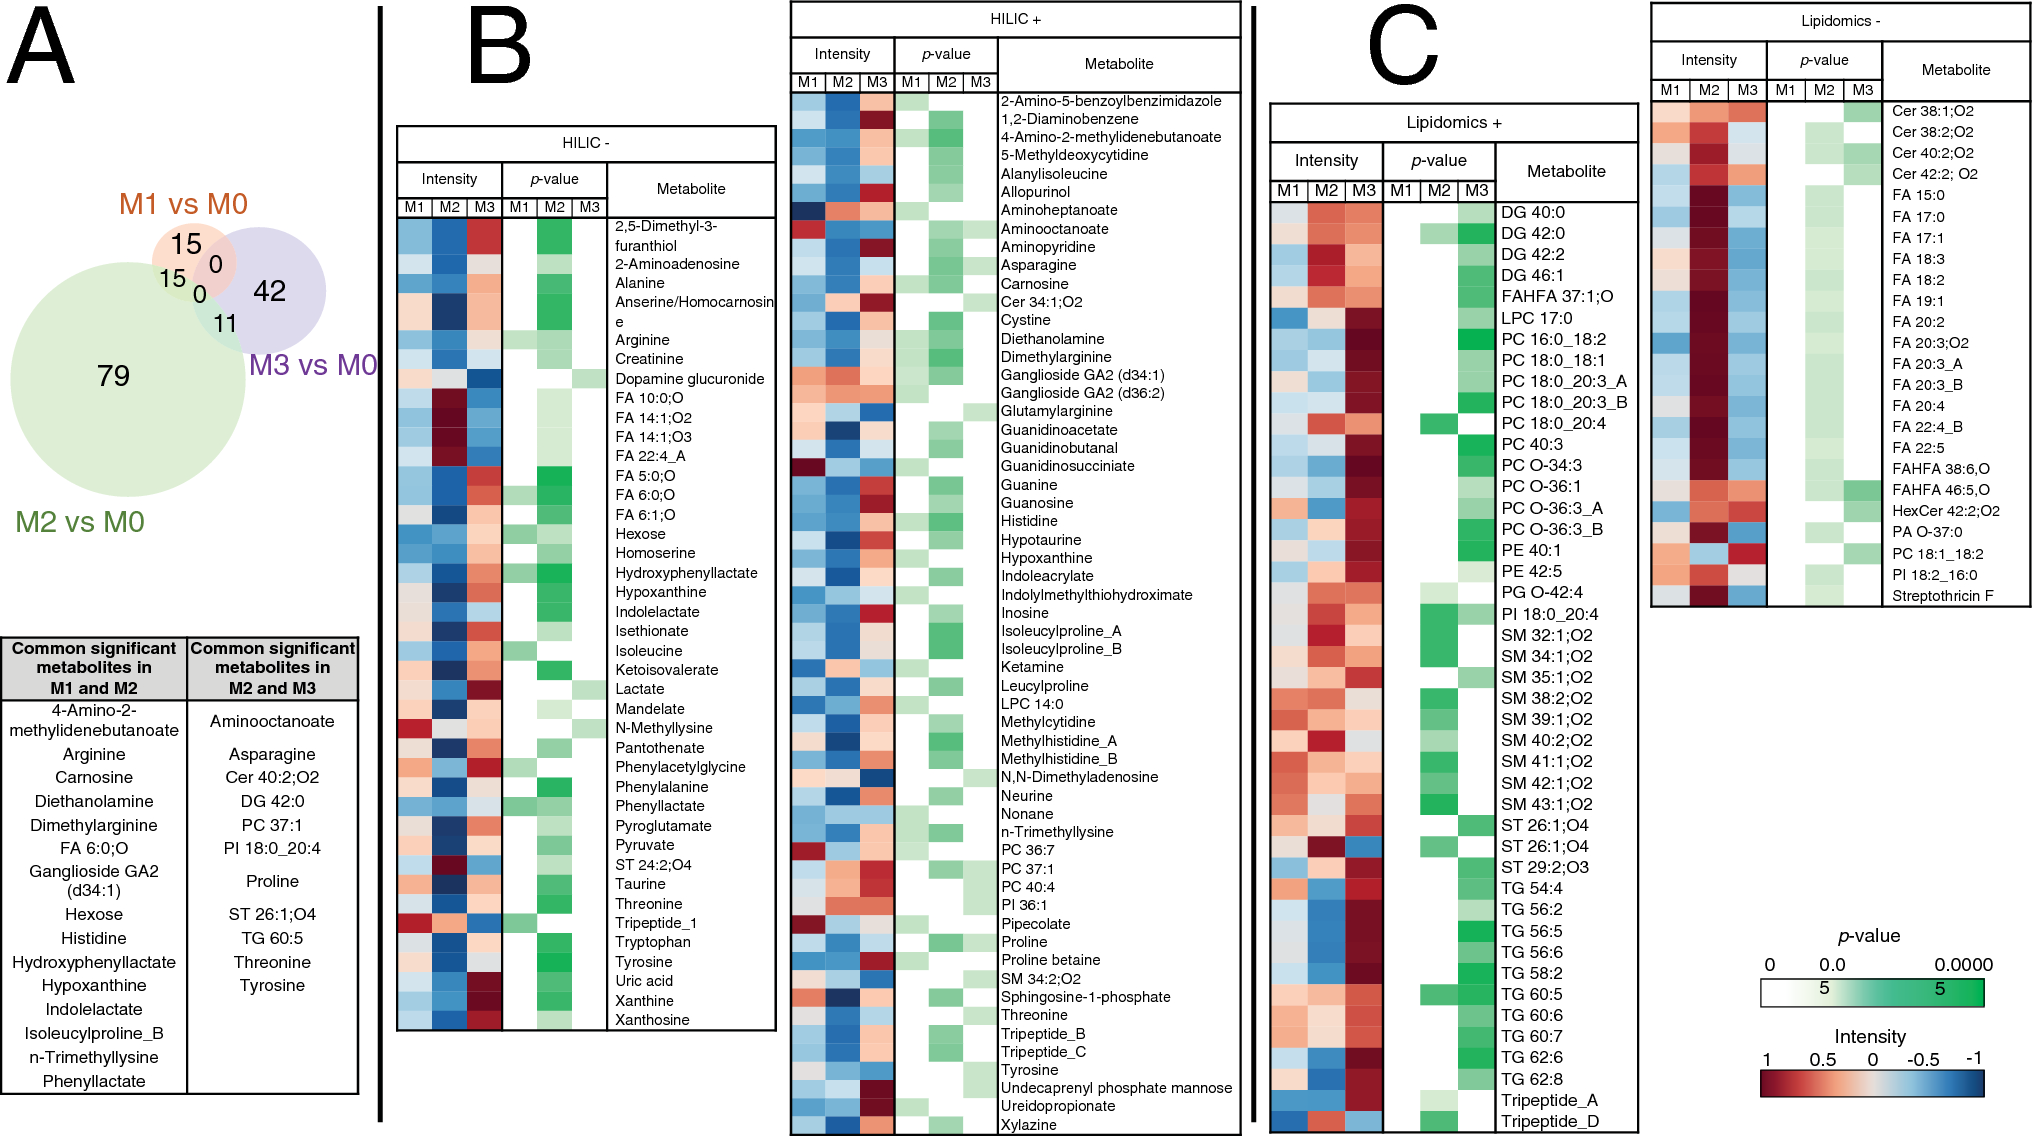
Table 2 CMR data on RV adaptation to RV pressure overload at the end of follow-upPH models show marked differences from the isolated RV pressure overload model in amino-acid and lipid metabolismMetabolomics analysis revealed that, compared with M0, M1 showed significant alteration in 73 features from which 30 metabolites were annotated, M2 in 265 features from which 105 metabolites were annotated, and M3 in 117 features from which 53 metabolites were annotated (Fig. 1A). From them, 15 altered metabolites were common to both PH models (M1 and M2) (including l-arginine, histidine, and carnosine); 11 common to M3 and M2; and none between M3 and M1.
Fig. 1
Plasma metabolite changes associated with PH and RV pressure overload. Plasma samples from pig models M1 (chronic postcapillary PH by pulmonary vein banding), M2 (chronic PH by aorto-pulmonary shunting), M3 (RV pressure overload by pulmonary artery banding), and M0 (sham procedure) were analyzed by LC–MS-based metabolomics (lipidomics and HILIC analysis in positive and negative ionization modes). Metabolites showing significant alterations in the three pathologic groups (M1, M2, and M3) versus M0 were annotated. A Venn-diagram showing the number of significantly altered metabolites in each pathologic group versus M0 (Mann–Whitey U test; p < 0.05). Metabolites commonly altered in more than one disease model are listed in the table. B Heatmap and p-value matrix of the significantly altered metabolites detected by HILIC in each disease model. Intensity columns indicate the abundance of each metabolite; p-value columns list the p-value for each metabolite (Mann–Whitey U test; p < 0.05). C Heatmap and p-value matrix of the significantly altered metabolites detected by lipidomics in each disease model. Intensity columns indicate the abundance of each metabolite; p-value columns show the p-value for each metabolite (Mann–Whitey U test; p < 0.05). Note: the figure includes only those annotated metabolites recognized by Metaboanalyst (REF). + , positive ionization mode; −, negative ionization mode; Cer ceramide; DG diglyceride; FA fatty acid; FAHFA fatty acid esters of hydroxy fatty acids; HexCer hexosylceramide; HILIC hydrophilic interaction liquid chromatography; LPC lysophosphatidylcholine; PA phosphatidic acid; PC phosphatidylcholine; PE phosphatidylethanolamines; PG phosphatidylgylcerol; PI phosphatidylinositol; SM sphingomyelin; ST sterol lipid; TG triglyceride
The 30 altered metabolites in M1 belonged to 15 subclasses (Supplementary Table 5) and included significant reductions in arginine and histidine (Figs. 1B, 2A). In contrast, glycosphingolipids (gangliosides) were increased (Fig. 1B). M2 showed the greatest metabolic alteration, with the 105 significantly altered compounds belonging to 38 subclasses (Supplementary Table 6). Metabolites of the arginine and histidine pathways were again significantly reduced, accompanied here by significant reductions in taurine and related compounds such as alanine, pyruvate, and isethionate, as well as purine degradation metabolites such as guanine, inosine, and xanthine (Figs. 1B, 2B). Conversely, there was an increase in circulating lipids, including free fatty acids (FA) and sphingomyelins (SM) (Fig. 1B, C). The analysis of free FA composition revealed higher levels of several omega-6 fatty acids, such as linoleic acid, gamma-linolenic acid, dihomo-gamma-linolenic acid, and arachidonic acid. The 53 metabolites significantly altered in M3 correspond to 16 subclasses (Supplementary Table 7), with most altered compounds being lipid metabolites such as triglycerides (TG), ceramides (Cer), and phosphatidylcholines (PCs), which tended to be increased. Animals in the M3 group showed no significant alterations in the arginine, histidine, taurine, or purine pathways (Fig. 2C).
Fig. 2
Selected altered metabolic pathways and their interrelations in the pathologic models. A M1 vs M0. B M2 vs M0. C M3 vs M0. Colored metabolites were detected by HILIC or lipidomics LC-QTOF-MS. The color of each metabolite reflects its percentage change vs M0. Note: the figure includes only those detected metabolites that could be linked to specific metabolic pathways
Proteomics analysis shows differential regulation of the complement and coagulation pathways in the three experimental modelsProteomics analysis of plasma samples revealed altered protein profiles at 1 and 8 months after surgery in all three experimental groups, with significant changes with respect to M0 in 35, 19, and 31 proteins in M1, M2, and M3, respectively (Fig. 3A and Supplementary Table 8). Significant protein abundance alterations specific to M1 included SERPINA1; SERPINA6; coagulation factors IX (F9), XI (F11), and XII (F12); complement components C3 and C7; apolipoprotein A-1 (APOA1); extracellular matrix protein 1 (ECM1); and glutathione peroxidase 3 (GPX3). M2 showed specific alterations in haptoglobin (HP); collagen alpha-1(I) chain (COL1A1); complement component C8A, von Willebrand factor (VWF); and apolipoprotein C-III (APOC3). M3 showed specific alterations in coagulation factor V (F5); beta-2-glycoprotein 1 (APOH); the complement components C4B, C4BPA, and C1QC; and apolipoprotein A-IV (APOA4) (Fig. 3B). A functional enrichment analysis revealed significant overrepresentation of biologic processes related to blood coagulation, complement activation, and lipid metabolism (Fig. 3C and Supplementary Table 9).
Fig. 3
Quantitative proteomics detection of alterations to plasma proteins related to hemostasis/coagulation, the Complement system, and lipid binding (apolipoproteins) in pig models of RV pressure overload. Plasma samples of 16 randomly selected animals (4 per experimental model) were analyzed by multiplexed isobaric labeling and LC–MS/MS, and the quantitative data were analyzed with the WSPP model to detect protein abundance changes in the three disease models (M1, M2, and M3) with respect to the control group (M0). A total of five blood samples were processed per animal: one baseline sample extracted before surgery and four samples extracted at 1 and 8 months after surgery (Supplementary Table 1). A Venn-diagram showing the number of significant protein abundance changes found in the three disease models versus the control group (Student t-test; p < 0.05). B Volcano-plots highlighting the significant protein abundance changes found in the three disease groups versus the control group at 1 and 8 months after surgery. Red and blue circles indicate increased and decreased protein abundance, respectively. The corresponding gene names for the specifically altered proteins in each group are indicated. The complete set of proteins quantitated in this comparative analysis is provided in Supplementary Table 8. C Functional enrichment analysis of the proteins found altered in the three disease models (M1, orange; M2, green; and M3, purple) versus the control group (M0). An FDR was calculated based on the p-value obtained using the Benjamini–Hochberg procedure. The figure shows only significantly enriched GO terms (−log10(FDR) > 1.3, which corresponds to FDR < 0.05). The complete set of enriched GO terms is shown in Supplemental Table 9. D Relative protein quantification in the Hemostasis/coagulation, Complement system, and Apolipoprotein functional categories for the three disease models. The heatmaps represent the standardized protein variable (Z-score, see color scale at the bottom) calculated with log2 fold change values. FDR false discovery rate; LC–MS/MS liquid chromatography coupled to tandem mass spectrometry; PH pulmonary hypertension; WSPP weighted spectrum, peptide and protein
To gain further insight into the functional alterations produced by PH, we analyzed the abundance changes of all proteins in these categories, using a curated protein classification based on a previous study [14]. Proteins involved in Hemostasis/coagulation were predominantly increased in M1 (Fig. 3D, Left). They included several serpin regulators and other regulator proteins such as alpha-2-macroglobulin (A2M), vitamin K-dependent protein C (PROC), carboxypeptidase B2 (CPB2), and beta-2-glycoprotein 1 (APOH), as well as coagulation factors implicated in the tissue factor pathway (extrinsic pathway), and prothrombin (F2) and coagulation factor XIIIa (F13A1), involved in the final common pathway. Also increased were 2 proteins of the contact activation pathway (intrinsic pathway), plasma kallikrein (KLKB1) and kininogen-1 (KNG1).
M1 and M2 showed a coordinated increase in the relative abundance of many Complement system proteins, mainly those involved in complement activation (C3, C5, C7, C6, C8A, and C8B) (Fig. 3D, Right). M1 and M2 also showed increases in complement factor H (CFH), a prominent modulator of complement activation, and complement factor B (CFB), a component of the alternative pathway.
The protein abundance analysis also revealed widespread (but uncoordinated) changes in the abundance of Apolipoproteins in the three models (Fig. 3D, Right). Notable changes included an increase in M1 of apolipoprotein A-I (APOA1), the main component of high-density lipoproteins, and a general reduction of low-density lipoproteins in all three models.
Multiplex immunoassay analysis confirmed significant abundance changes in coagulation and complement system components, particularly in M1 (Supplementary Fig. 2). CILP1 and NT-proBNP showed a moderate correlation (R = 0.52, p = 0.041) and significantly differed among groups (p = 0.021 and 0.026). In the post-hoc analysis, CILP1 was significantly higher in M1 whereas NT-proBNP was increased in M2, compared with M0 (Supplementary Fig. 3).
RV failure is inversely associated with arginine, histidine, taurine and purine metabolism and positively related to complement system activation and circulating FAAn integrative analysis revealed that, in the scenario of PH, the hemodynamic severity (assessed by PAP and PVR) was negatively associated with arginine, histidine, taurine, and purine metabolism and positively associated with complement system activation and circulating FAs; and RV maladaptive hypertrophy (assessed by RV end-systolic volume, RV ejection fraction, and ECV at the inferior RV insertion point) was inversely associated with plasma arginine, taurine, histidine, and purines and positively correlated with plasma coagulation factors, complement system components, and circulating lipids (FA, FAHFA, SM, PC, ceramides, and cholesterol derivatives) (Supplemental Table 10, Figs. 4). The association between the main identified metabolites and RV ejection fraction, as the most relevant parameter of RV performance, remained after adjusting by weight (Supplementary Table 11). NT-proBNP levels showed a modest correlation with RV ejection fraction (R = −0.409) but CILP1 did not (R = −0.319, p = 0.229). Figure 5 summarizes the main outcomes obtained for each disease model studied by RHC hemodynamics and CMR (RV adaptation), RV and lung molecular biology, and unbiased plasma proteomics and metabolomics.
Fig. 4
The maladaptive RV hypertrophy network. Significant (p < 0.05) relationships revealed by Pearson correlation analysis between quantitative data from omics (proteins, metabolites, and lipids), hemodynamics (indexed PVR and mean PAP), CMR imaging (indexed RV mass, indexed RV end-systolic volume, RV ejection fraction, and ECV at the inferior RV insertion point). Nodes representing protein, metabolite, and lipid components are color-coded based on functional attributes or chemical composition. Positively and negatively correlating nodes are denoted using orange and purple connecting lines, respectively, where line thickness is proportional to the absolute value of the Pearson correlation coefficient
Fig. 5
The pathophysiological mechanisms associated with right ventricular maladaptive hypertrophy in PH were investigated in three large-animal surgical models: postcapillary PH (M1), PH secondary to aorto-pulmonary shunting (M2), and RV pressure overload by PA banding (thus without PH). These models were compared with sham-operated animals (M0). The columns summarize the main outcomes obtained for each disease model studied by RHC hemodynamics and CMR (RV adaptation), RV and lung molecular biology, and unbiased plasma proteomics and metabolomics. These findings formed the basis of an integrative analysis combining omics with RV performance and hemodynamic data on PH severity. ECV extracellular volume; IIP inferior insertion point; PA pulmonary artery; PH pulmonary hypertension; PVR pulmonary vascular resistance; RHC right heart catheterization; RV right ventricle; RVSP right ventricular systolic pressure; TG triglycerides
Plasma omics findings match gene expression changes in myocardium and lung samplesGene expression analysis of RV myocardium samples revealed patterns suggestive of more severe myocardial damage in M1 and M2 than in M3 (higher involvement of the arginine-NO pathway, increased fibrosis, endothelial dysfunction, and reduced angiogenesis) (Supplementary Fig. 2). As evidence, both PH models showed significantly reduced gene expression of arginine N-methyltransferases compared with M0 (PRMT1 and PRMT2 in M1; PRMT1 in M2). M1 samples also showed significant reductions in tissue inhibitor of metalloproteinases (TIMP-2) and stromal cell-derived factor 1 (SDF-1), whereas M2 samples showed significant reductions in sphingosine-1-phosphate receptor (S1PR3), VEGF-2, APOE, and intercellular adhesion molecule 1 (ICAM1). In contrast, M3 samples showed no major differences in gene expression relative to M0 (TIMP-4 was slightly reduced and complement component 5a receptor 1 [C5AR1] slightly increased).
Reflecting the absence of PH in M3, the lung parenchyma of animals in this group showed no gene expression changes. In contrast, M1 samples showed overexpression of the pro-oxidant enzyme NOX5 and downregulation of the anti-fibrotic MMP2, APOE, and the kallikrein cascade components KLKB1 and KNG1. Similarly, M2 samples showed overexpression of the pro-fibrotic MMP9 and downregulation of TIMP4 and the peroxide-depleting enzyme CAT in lung parenchyma (Supplementary Fig. 4).
留言 (0)