
記住我


In the past few decades, the incidence of metabolic dysfunction-associated steatotic liver disease (MASLD) has increased worldwide, affecting approximately 25%–30% of the population (1,2) and is believed to have an inseparable 2-way relationship with the occurrence of metabolic syndrome (3). Owing to its high prevalence, MASLD is currently the fastest growing cause of liver-related mortality worldwide and becoming an important cause of end-stage liver disease, primary liver cancer, and liver transplantation, which have brought huge health and economic burdens (4). The accurate and rapid diagnosis of MASLD and the hierarchical management of patients with MASLD are important (5).
Liver biopsy is the gold standard for the identification of histological features of MASLD. But limitations such as invasiveness, poor acceptability, and sampling variability constrains its wide application. (6,7). Recently, an increasing number of studies have been conducted on noninvasive MASLD diagnoses. The introduction of noninvasive scores, such as FibroScan-AST score (8), MRI-AST score (9), and ADAPT (10), has filled the gap in the field of noninvasive diagnoses of liver fibrosis in patients with MASLD and improved diagnostic simplicity.
Although the appearance of fibrosis is a critical stage in the progression of MASLD, existing studies revealed that liver fat content in patients with MASLD is closely related to the development of the disease. Chen et al (11) found that an increase in liver fat content on magnetic resonance imaging–proton density fat fraction (MRI-PDFF) had a significant dose-dependent relationship with the presence of metabolic syndrome; at the same time, an increase in liver fat content may affect cardiovascular risk occurrence. Li et al (12) found that every 1% increase in liver fat content was associated with an increased risk of prediabetes and diabetes. Ajmera et al (13) found that higher liver fat content, as measured by MRI-PDFF, was associated with fibrosis progression. In addition, current clinical research guidelines recommend the use of MRI-PDFF changes in liver fat content as an exploratory end point in phase 2a clinical studies (14).
As a convenient and easily available noninvasive diagnostic method, controlled attenuation parameter (CAP) has been widely used to evaluate liver fat content (15). Although previous studies have shown a good correlation between CAP and the degree of liver steatosis (16), some studies have revealed that the diagnostic accuracy of CAP was not high enough in evaluating liver fat content in patients with MASLD (7,17–19), which may be related to body weight, waist circumference, liver inflammation, or cholestasis. The results of a meta-analysis conducted by Petroff et al showed that, among patients with histologically proved MASLD, the area under the curve (AUROC) of CAP for assessing histologically defined steatosis grade were 0.807 for S0 vs S1–S3, 0.736 (0.720–0.787) for S0–S1 vs S2–S3, and 0.711 for S0–S2 vs S3 (18). Our previous study also preliminarily confirmed this point of view (20). Using MRI-PDFF as the gold standard to estimate patients' liver fat content, the results showed that the AUROC for CAP at MRI-PDFF ≥5%, ≥10%, and ≥20% was 0.93, 0.86, and 0.73, respectively (20).
Based on the abovementioned background, we believe that it is urgent to improve the diagnostic efficacy of CAP for MASLD. Therefore, the aim of this study was to develop a score, based on CAP and conventional clinical parameters, to improve the diagnostic performance of CAP.
METHODS Study design and participantsA total of 373 participants from the following 2 independent Chinese cohorts were included in this study: Shuguang Hospital Affiliated to Shanghai University of Traditional Chinese Medicine (Shanghai cohort, n = 266) and First Affiliated Hospital of Wenzhou University (Wenzhou cohort, n = 107), which included 16 and 22 participants without MASLD, respectively. The Shanghai cohort was derived from 2 registered randomized controlled trials (ChiCTR2000038111 and ChiCTR-IOR-17013491). The participants in the Wenzhou cohort were all from a hospital outpatient department for liver disease, which represents a real-world cohort. The participants in the Shanghai cohort were randomly assigned to the derivation (n = 191) and internal validation (n = 75) cohorts at a ratio of approximately 7:3 (21), and the Wenzhou cohort was used as the external validation cohort (Figure 1). All participants underwent elastography, MRI, and fasting serum examinations, and their general condition was recorded.
 Figure 1.:
 Numbers of enrolled participants in the Shanghai and Wenzhou cohort. CAP, controlled attenuation parameter; MASLD, metabolic dysfunction-associated steatotic liver disease; MRI-PDFF, magnetic resonance imaging–proton density fat fraction.
This study was conducted in accordance with the ethical principles of the Declaration of Helsinki (2013), and the study protocol was approved by the ethics committees of the 2 hospitals (approvals 2017-548-31, 2019-759-114-01, and 2016-246). All participants signed informed consent before participation.
Inclusion and exclusion criteriaWe included participants who were willing to participate in the screening study, met the diagnostic criteria for MASLD (22), and were between 18 and 65 years of age. MASLD can be diagnosed by imaging. Imaging diagnoses included B-ultrasound using sound waves, MRI-PDFF ≥5%, and CAP ≥240 db/m (23).
Patients who had used enzyme-reducing drugs or experienced a weight loss of more than 10% in the prior 3 months or used glucagon-like peptide-1 receptor agonist, those with alcoholic fatty liver disease (alcohol intake greater than 20 g/d for men and 10 g/d for women), cirrhosis, hepatitis B, hepatitis C, other liver diseases, and autoimmune liver disease or those with drug consumption that may lead to a fatty liver, pregnant women, lactating women, patients with primary diseases of the cardiovascular, lung, kidney, and hematopoietic system, and those with other serious diseases such as malignant tumors were excluded.
Clinical and biochemical dataThe vital signs of the participants, including age, sex, height, weight, and body mass index (BMI), were collected by trained clinical researchers, and their medical and medication histories in the prior month were investigated in detail. Serological tests involved total bilirubin, direct bilirubin, indirect bilirubin, alanine aminotransferase (ALT), aspartate aminotransferase (AST), gamma-glutamyl transpeptidase, triglycerides, total cholesterol, high-density lipoprotein cholesterol, low-density lipoprotein cholesterol, fasting blood glucose, glycosylated hemoglobin, fasting insulin, platelet count, and uric acid. The insulin resistance index (homeostatic model assessment for insulin resistance) was calculated.
CAP measurementIn both the Shanghai and Wenzhou cohorts, the iLivTouch FT1000 (Hisky Medical, Beijing, China) was used by trained clinical investigators to measure CAP, respectively. A CAP value that was successfully measured 10 times was selected as the valid value, and the median deviation was less than 30%. M-probe was used to evaluate all participants.
MRI-PDFF measurementMRI-PDFF images for the Shanghai cohort were performed using a 3.0-Tesla MRI scanner (MAGNETOM Skyra; Siemens Healthcare, Erlangen, Germany). MRI-PDFF images for the Wenzhou cohort were obtained using a GE Discovery MR750 3.0T scanner (GE Healthcare, Waukesha, WI) equipped with an 8-channel abdominal array coil. The interval between MRI-PDFF and CAP examinations was within 14 days for all participants. Last, the image analysts were blinded to clinical and biochemical data.
Statistical analysisSPSS (version 26.0; IBM Corp, Armonk, NY) was used to analyze the data. Demographic, laboratory, and imaging data are expressed as median and interquartile range (IQR) or as mean ± SD. Kruskal–Wallis tests were performed for other continuous variables. t Tests were performed for normally distributed continuous variables. The Fisher exact test or χ2 test was used for categorical variables. Missing values were imputed using a single random regression imputation. Hepatic steatosis was defined as MRI-PDFF ≥5% (24). A logistic regression model was established by combining the difference parameters between MRI-PDFF ≥20% (defined as severe steatosis) and MRI-PDFF <20% in the discovery cohort. Parameters were combined into a multivariable logistic regression model with a backward stepwise selection procedure to select the optimal parameters and the optimal logistic model was obtained. Because of the collinearity between AST and ALT, we performed separate model developments with AST or ALT. Of these, the model with AST gave the best discriminative power and was therefore selected (25). The model's calibration was evaluated using the Hosmer-Lemeshow goodness-of-fit test. In the derivation cohort, the Youden index was used to obtain the optimal cutoff values of the optimal model for the diagnosis of ≥20%, ≥10%, and ≥5% liver fat content, based on MRI-PDFF. The predictive performance was evaluated using the positive predictive value (PPV), negative predictive value (NPV), sensitivity, specificity, and AUROC with corresponding 95% confidence intervals (CIs) in the internal and external validation cohorts. All authors had access to the study data and reviewed and approved the final manuscript.
RESULTS Baseline characteristicsA total of 439 participants were evaluated and screened. After excluding 66 participants who did not have CAP or MRI-PDFF data, 373 participants were included in the final analysis. The demographic, biochemical, and imaging data of the 3 cohorts are summarized in Table 1. The mean age was 38 ± 8.9 years in the derivation cohort, 37.7 ± 8.0 years in the internal validation cohort, and 41.4 ± 12.4 years in the external validation cohort. Women accounted for 14% (n = 26), 17% (n = 17), and 30% (n = 32) of patients, respectively. The MRI-PDFF median (IQR) in the 3 cohorts was 16.2 (12) %, 17.4 (11.9) %, and 9.7 (11.1) %, and the CAP median (IQR) was 309 (34) dB/m, 311 (40) dB/m, and 313 (27) dB/m, respectively.
Table 1. - Baseline characteristics of participants, stratified by both cohorts and derivation and validation sets Characteristics Shanghai cohort Wenzhou cohort Derivation cohort (n = 191) Internal validation cohort (n = 75) External validation cohort (n = 107) Demographics Age, yr, mean ± SD 38 ± 8.9 37.7 ± 8.0 41.4 ± 12.4 Female, n (%) 26 (14) 13 (17) 32 (30) SBP, mm Hg, median (IQR) 124 (17) 123 (15) 130 (18) DBP, mm Hg, median (IQR) 83 (13) 82 (12) 83 (13) BMI, kg/m2, median (IQR) 27.9 (5.2) 29.0 (4.7) 26.7 (4.6) Waist circumference, cm, median (IQR) 98 (15) 98 (14) 92.5 (12.3) Biological data Total bilirubin, μmol/L, median (IQR) 15.7 (7.2) 15.1 (7.6) 12 (8) Direct bilirubin, μmol/L, median (IQR) 2.8 (1.3) 2.9 (1.6) 4 (3) Indirect bilirubin, μmol/L, median (IQR) 12.9 (6.3) 12.2 (6.6) 8 (5) ALT, U/L, median (IQR) 68 (44) 72 (46) 58 (58) AST, U/L, median (IQR) 37 (20) 39 (20) 37 (31) AST/ALT 0.6 (0.2) 0.5 (0.2) 0.7 (0.4) GGT, U/L, median (IQR) 56 (46) 55 (40) 57 (51) Triglyceride, mmol/L, median (IQR) 1.8 (1.2) 1.9 (1.1) 2.0 (1.5) Total cholesterol, mmol/L, median (IQR) 5.2 (1.5) 5.5 (1.2) 5.3 (1.5) HDL-cholesterol, mmol/L, median (IQR) 1.1 (0.3) 1.1 (0.3) 1 (0.3) LDL-cholesterol, mmol/L, median (IQR) 3.1 (1.1) 3.4 (1.2) 3.1 (1.2) Glucose, mmol/L, median (IQR) 5.1 (0.8) 5.3 (1.1) 5.4 (1.3) Insulin, pmol/L, median (IQR) 117 (102.4) 107.5 (83.7) 103.1 (73.7) HOMA-IR, median (IQR) 26.0 (25) 26.0 (18.6) 24.7 (21.0) HbA1C, %, median (IQR) 5.4 (0.5) 5.5 (0.6) 5.9 (1.3) Uric acid, μmol/L, median (IQR) 430 (107) 449 (131) 378 (141) Platelet count, 109, median (IQR) 255 (78) 239 (74) 240 (71) Imaging data MRI-PDFF, %, median (IQR) 16.2 (12) 17.4 (11.9) 9.7 (11.1) CAP, dB/m, median (IQR) 309 (34) 311 (40) 313 (27) LSM, kPa, median (IQR) 7.4 (3.2) 7.8 (4.1) 10.2 (4.9)ALT, alanine aminotransferase; AST, aspartate aminotransferase; BMI, body mass index; CAP, controlled attenuation parameter; DBP, diastolic blood pressure; GGT, gamma-glutamyl transpeptidase; HbA1c, glycated hemoglobin; HDL, high-density lipoprotein; HOMA-IR, homeostasis model assessment of insulin resistance; IQR, interquartile range; LDL, low-density lipoprotein; LSM, liver stiffness measurement; MRI-PDFF, magnetic resonance imaging–proton density fat fraction; SBP, systolic blood pressure.
In the derivation cohort, the patients were divided into 2 groups according to the degree of liver fat content, MRI-PDFF <20% and MRI-PDFF ≥20%. The patients with high liver fat content had significantly higher BMI, waist circumferences, ALT, AST, fasting blood glucose, insulin, homeostatic model assessment for insulin resistance, glycosylated hemoglobin, CAP, and liver stiffness measurement than those with MRI-PDFF <20% (P < 0.05 or P < 0.01) (Table 2). Variables with significant differences between the 2 groups were considered suitable parameters for constructing the model. And the parameters were combined into a multivariable logistic regression model with a backward stepwise selection procedure to select the optimal parameters, and the optimal logistic model CAP-BMI-AST score (CBST), was obtained (see Supplementary Table 1, Supplementary Digital Content 1, https://links.lww.com/CTG/B70), with good calibration plot (Hosmer-Lemeshow goodness-of-fit test, P = 0.89) (see Supplementary Figure 1, Supplementary Digital Content 1, https://links.lww.com/CTG/B70).CBST=−14.27962+0.05431×CAP − 0.14266×BMI+0.01715×AST
Table 2. - Baseline characteristics of patients with MASLD from the derivation cohort, stratified by degree of liver fat content Characteristics Derivation cohort MRI-PDFF <20% (n = 130) MRI-PDFF ≥20% (n = 61) P valuea Demographics Age, yr, mean ± SD 38.3 ± 8.9 37.4 ± 8.9 0.691 Female, n (%) 14 (11) 12 (20) 0.095 SBP, mm Hg, median (IQR) 123 (17) 127 (17) 0.066 DBP, mm Hg, median (IQR) 82.8 (12.8) 85 (12) 0.112 BMI, kg/m2, median (IQR) 27.5 (5.2) 29.3 (5.3) 0.013 Waist circumference, cm, median (IQR) 96 (13.3) 102 (15) 0.001 Biological data Total bilirubin, μmol/L, median (IQR) 16.0 (7.6) 15.3 (7.2) 0.118 Direct bilirubin, μmol/L, median (IQR) 2.8 (1.3) 2.8 (1.3) 0.678 Indirect bilirubin, μmol/L, median (IQR) 13.2 (6.1) 12.6 (6.2) 0.106 ALT 63 (42) 77 (46.5) <0.001 AST 33.5 (21.3) 43 (24.5) <0.001 AST/ALT 0.6 (0.2) 0.5 (0.2) 0.054 GGT 53.5 (44.5) 60 (48) 0.146 Triglyceride, mmol/L, median (IQR) 1.7 (1.3) 1.9 (1.2) 0.145 Total cholesterol, mmol/L, median (IQR) 5.1 (1.4) 5.2 (1.6) 0.834 HDL-cholesterol, mmol/L, median (IQR) 1.1 (0.3) 1.1 (0.2) 0.406 LDL-cholesterol, mmol/L, median (IQR) 3.1 (1.0) 3.1 (1.3) 0.809 Glucose, mmol/L, median (IQR) 5 (0.7) 5.3 (1.2) 0.027 Insulin, pmol/L, median (IQR) 96.2 (82.9) 147.6 (100) <0.001 HOMA-IR, median (IQR) 21.8 (21.0) 35.0 (27.8) <0.001 HbA1C, %, median (IQR) 5.3 (0.5) 5.5 (0.6) 0.004 Uric acid, μmol/L, median (IQR) 419.5 (97.3) 451 (115) 0.052 Platelet count, 109, median (IQR) 259.0 (85.3) 252 (69.5) 0.503 Imaging data MRI-PDFF, %, median (IQR) 12.0 (8.6) 24.0 (7.3) <0.001 CAP, dB/m, median (IQR) 301.5 (38.3) 323 (24) <0.001 LSM, kPa, median (IQR) 6.9 (3) 8.2 (2.6) <0.001ALT, alanine aminotransferase; AST, aspartate aminotransferase; BMI, body mass index; CAP, controlled attenuation parameter; DBP, diastolic blood pressure; GGT, gamma-glutamyl transpeptidase; HbA1c, glycated hemoglobin; HDL, high-density lipoprotein; HOMA-IR, homeostasis model assessment of insulin resistance; IQR, interquartile range; LDL, low-density lipoprotein; LSM, liver stiffness measurement; MRI-PDFF, magnetic resonance imaging–proton density fat fraction; MASLD, metabolic dysfunction-associated steatotic liver disease; SBP, systolic blood pressure.
aP value determined by comparing characteristics of patients with MASLD MRI-PDFF <20% and MRI-PDFF ≥20%, using the t tests, Kruskal-Wallis test, analysis of variance, or χ2 or Fisher exact test, as appropriate. P < 0.05 is considered significant.
In the derivation cohort, when MRI-PDFF was ≥20%, the CBST score had better diagnostic performance than CAP, with an AUROC of 0.77 vs 0.74 (95% CI 0.70–0.83 vs 0.67–0.81). When MRI-PDFF was ≥10% and ≥5%, the CBST score also had better AUROC than CAP, that is, 0.89 vs 0.86 (95% CI 0.83–0.94 vs 0.79–0.93) and 0.93 vs 0.91 (95% CI 0.88–0.98 vs 0.84–0.98), respectively (Figure 2a–c, Table 3). The AUROC improvement rates of CBST compared with those of CAP alone were 4.1%, 3.4%, and 2.2%, respectively (Table 3). Based on these results, the CBST score was validated in 2 cohorts.
 Figure 2.:
 Performances of CBST in the derivation cohort compared with CAP: (a) MRI-PDFF ≥20%, (b) MRI-PDFF ≥10%, (c) MRI-PDFF ≥5%. CAP, controlled attenuation parameter; MRI-PDFF, magnetic resonance imaging–proton density fat fraction.
Table 3. - Performances of CBST and CAP for the detection of hepatic steatosis in all cohort Shanghai cohort Wenzhou cohort Derivation cohort Internal validation cohort External validation cohort AUROC 95% CI AUROC 95% CI AUROC 95% CI MRI-PDFF ≥20% CBST 0.77 0.70–0.83 0.80 0.70–0.90 0.66 0.53–0.80 CAP 0.74 0.67–0.81 0.72 0.60–0.84 0.62 0.50–0.75 Rate of improvement (%) 4.1 11.1 6.1 MRI-PDFF ≥10% CBST 0.89 0.83–0.94 0.95 0.91–1.00 0.69 0.59–0.79 CAP 0.86 0.79–0.93 0.94 0.89–1.0 0.58 0.47–0.69 Rate of improvement (%) 3.4 1.1 19.0 MRI-PDFF ≥5% CBST 0.93 0.88–0.98 0.98 0.94–1.00 0.78 0.68–0.89 CAP 0.91 0.84–0.98 0.98 0.94–1.00 0.68 0.56–0.80 Rate of improvement (%) 2.2 — 14.7AUROC, area under the receiver operating characteristic; CAP, controlled attenuation parameter; CI, confidence interval; MRI-PDFF, magnetic resonance imaging–proton density fat fraction.
In the internal validation cohort, we found that when MRI-PDFF was ≥20%, the AUROC for CBST and CAP was 0.80 vs 0.72 (95% CI 0.70–0.90 vs 0.60–0.84, P = 0.0093) (Figure 3a), with good calibration plot (see Supplementary Figure 1, Supplementary Digital Content 1, https://links.lww.com/CTG/B70). When MRI-PDFF was ≥10% and ≥5%, the AUROCs for CBST and CAP were 0.95 vs 0.94 (95% CI 0.91–1.00 vs 0.89–1.00, P > 0.05) and 0.98 vs 0.98 (95% CI 0.94–1.00 vs 0.94–1.00, P > 0.05), respectively (Figure 3b and c, Table 3). The AUROC improvement rates for CBST were 11.1% and 1.1%, respectively (Table 3).
 Figure 3.:
 Performances of CBST in the internal validation cohort and external validation cohort compared with CAP: (a) MRI-PDFF ≥20%, (b) MRI-PDFF ≥10%, (c) MRI-PDFF ≥5% in the internal validation cohort, (d) MRI-PDFF ≥20%, (e) MRI-PDFF ≥10%, (f) MRI-PDFF ≥5% in the external validation cohort. CAP, controlled attenuation parameter; MRI-PDFF, magnetic resonance imaging–proton density fat fraction.
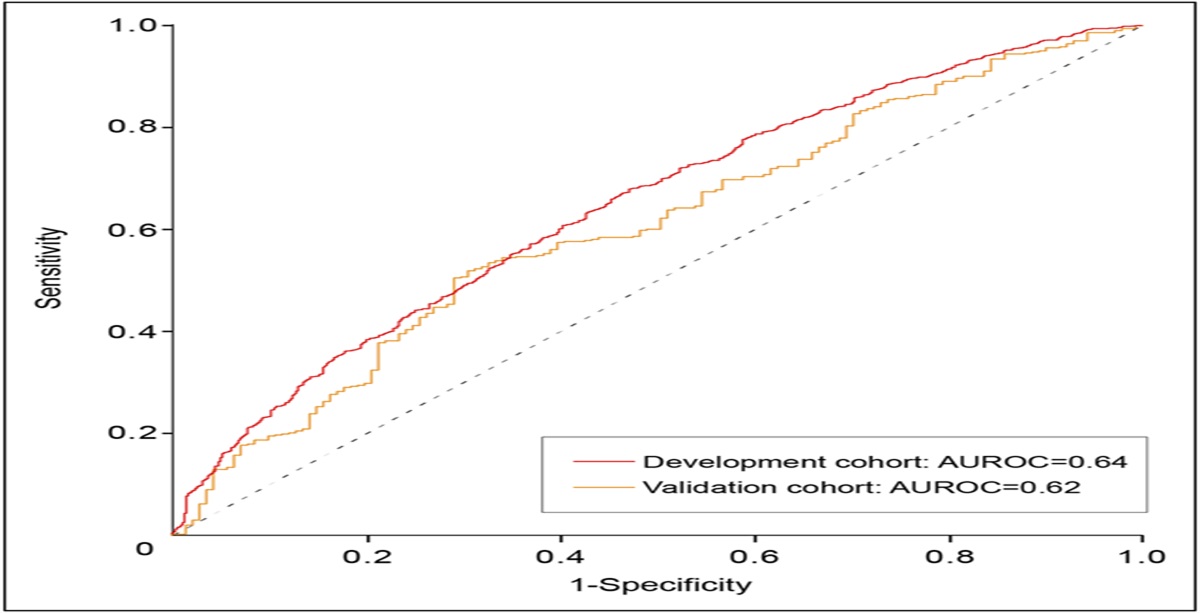
Consistent results were obtained in the external validation cohort. When MRI-PDFF was ≥20%, ≥10%, and ≥5%, the AUROCs for CBST and CAP were 0.66 vs 0.62 (95% CI 0.53–0.80 vs 0.50–0.75, P = 0.32), 0.69 vs 0.58 (95% CI 0.59–0.79 vs 0.47–0.69, P < 0.001), and 0.78 vs 0.68 (95% CI 0.68–0.89 vs 0.56–0.80, P = 0.0183), respectively (Figure 3d–f, Table 3). The AUROC improvement rates for CBST were 6.1%, 19.0%, and 14.7%, respectively (Table 3). Ultimately, the 2 validation cohorts confirmed the CBST score was more accurate than that of CAP alone.
Derivation and validation of cutoff valuesIn the derivation cohort, the optimal CBST cutoff values for the diagnosis of MRI-PDFF ≥20%, ≥10%, and ≥5%, calculated by the Youden index, were −0.5345 (sensitivity = 72.1%, specificity = 70.8%, PPV = 53.7%, and NPV = 84.4%), −1.7404 (sensitivity = 88.7%, specificity = 76.0%, PPV = 91.2%, and NPV = 70.4%), and −1.9959 (sensitivity = 86.4%, specificity = 92.9%, PPV = 99.4%, and NPV = 35.1%), respectively (Table 4). By applying these diagnostic thresholds, in the internal validation cohort, when MRI-PDFF was ≥20%, the sensitivity, specificity, PPV, and NPV of CBST were 69%, 73.9%, 62.5%, and 79.1%, respectively. When MRI-PDFF was ≥10%, they were 93.5%, 69.2%, 96.7%, and 60.0%, respectively. When MRI-PDFF was ≥5%, they were 86.3%, 100%, 100%, and 16.7%, respectively. In the external validation cohort, the NPV of CBST was 91.3% when MRI-PDFF was ≥20%. When MRI-PDFF was ≥10%, the sensitivity was 94.2%. When MRI-PDFF was ≥5%, the sensitivity was 98.8% (see Supplementary Table 2, Supplementary Digital Content 1, https://links.lww.com/CTG/B70).
Table 4. - Derivation of the best cutoff values of CBST in derivation cohort CBST Derivation cohort MRI-PDFF ≥20% MRI-PDFF ≥10% MRI-PDFF ≥5% Cutoff value −0.5345 −1.7404 −1.9959 Sensitivity (%) 72.1 88.7 86.4 Specificity (%) 70.8 76.0 92.9 PPV (%) 53.7 91.2 99.4 NPV (%) 84.4 70.4 35.1MRI-PDFF, magnetic resonance imaging–proton density fat fraction; NPV, negative predictive value; PPV, positive predictive value.
By applying those cutoff values, in the internal validation cohort, 69% (n = 20) MRI-PDFF ≥20% patients were correctly classified and 31% (n = 9) incorrectly classified. Approximately 94% (n = 58) MRI-PDFF ≥10% patients were correctly classified while 6% (n = 4) were incorrectly classified. And 86% (n = 63) MRI-PDFF ≥5% patients were correctly classified while 14% (n = 10) were incorrectly classified (see Supplementary Table 3, Supplementary Digital Content 1, https://links.lww.com/CTG/B70). In the external validation cohort, the relevant data were summarized on Supplementary Table 4 (see Supplementary Digital Content 1, https://links.lww.com/CTG/B70).
DISCUSSIONIn this study, we revealed the new CBST score, based on CAP and conventional clinical parameters, which can be used as an accurate tool to diagnose different degrees of liver fat content and fully verified in 2 validation cohorts. The AUROC of CBST was superior to that of CAP when MRI-PDFF ≥20%, ≥10%, and ≥5% in the derivation, internal validation, and external validation cohorts. Then, we identified the optimal cutoff values of CBST for diagnosis of different degrees of liver fat content. The CBST score has clinical application value in quantifying the hepatic fat content of patients with MASLD.
The liver fat content of patients with MASLD is closely related to disease development. MRI-PDFF, as an accurate examination method to evaluate liver fat content (7), is limited by price, equipment conditions, and other factors and cannot be widely used. Although previous studies have shown that CAP has a good correlation with liver biopsy in the evaluation of hepatic steatosis (16), the existing results suggested that the diagnostic accuracy of CAP was not high enough (7,17–19). For example, a meta-analysis of 10,537 patients from 61 studies conducted by Cao Yu-Tian et al (19) introduced that the AUROC of CAP were 0.924, 0.794, and 0.778 for steatosis grades ≥S1, ≥S2, and =S3, respectively. Meanwhile, many studies have used MRI-PDFF as the gold standard to evaluate the diagnostic properties of CAP for the diagnosis of liver fat content. Results showed that the diagnostic properties of CAP were insufficient (20,26,27), which was consistent with our results. In the derivation cohort of MRI-PDFF ≥5%, ≥10%, and ≥20%, the AUROCs of CAP were 0.91, 0.86, and 0.74 and 0.98, 0.94 and 0.72 in the internal validation cohort, respectively.
We compared the data with significant differences between MRI-PDFF ≥20% and MRI-PDFF <20% to construct the CBST score in the derivation cohort. We then explored the diagnostic performance of the CBST in assessing different levels of liver fat content and confirmed that the score could improve the overall diagnostic performance of CAP. Based on the abovementioned results, we verified the findings in the internal and external validation cohorts and obtained consistent results. Except for in the internal validation cohort when MRI-PDFF was ≥5%, the AUROCs of CBST and CAP were equal (AUROC = 0.98), which was already very high; the other AUROCs of the CBST score was higher than that of CAP alone. The CBST's AUROC is significantly better than CAP's when MRI-PDFF was ≥20% in the internal validation cohort and when MRI-PDFF was ≥10% and 5% in the external validation cohort.
In addition, we found that in the external validation cohort, the AUROC for CAP was low (Table 3). This may be because the patients in the Wenzhou cohort were recruited using real-world outpatient data, whereas the patients in the derivation cohort were from 2 randomized controlled trials with strict inclusion and exclusion criteria. We further unearthed that the MRI-PDFF in the external validation cohort was lower than that in the derivation cohort. However, the 2 cohorts were similar regarding CAP (Table 1). These results supported the importance of improving the diagnostic performance of CAP and explain the higher improvement rate of the CBST AUROC in the external validation cohort.
CBST, as a liver fat score obtained in this study, contains parameters that are consistent with those recently published or widely used scores, that is, AST is one of the constituent parameters of such scores, such as FibroScan-AST (FAST), MRI-AST score (MAST), Fibrosis-4 index (28), AST/platelet ratio index (APRI) (29), and AST to creatinine ratio index (acNASH) (30). Within noninvasive scores, AST may be superior to ALT in judging the degree of disease, whether liver fat content or liver fibrosis is being evaluated. BMI is also used as another parameter in CBST, which is consistent with real clinical situations and is easy to obtain. In constructing the CBST score, we divided patients into 2 groups at a ratio of approximately 7:3 (21,31), which resulted in only a few participants without MASLD in the internal validation cohort; however, the study also included an external validation cohort that enabled the full validation of the CBST score's performance.
In clinical practice, due to the invasion of liver biopsy, the high cost, and poor accessibility of MRI-PDFF, both their clinical application is limited. Conventional B-ultrasonography is widely used in screening and check-ups owing to easy and cheap, but it is not quantitative. CAP is more convenient and economical for applications, especially in grassroots hospital, but the diagnostic accuracy is not high. The CBST is based on CAP, BMI, and AST, which are all easily obtainable and could be used in clinic conveniently. Considering the global epidemiology of MASLD at present, with approximately 1 billion people potentially affected, we believe that the potential beneficiaries of improved diagnostic performance with CBST are substantial and has its clinical value.
Currently, nonalcoholic fatty liver disease (NALFD) is being renamed as MASLD due to the limitations of the terms NAFLD and nonalcoholic steatohepatitis (NASH) (32). We considered whether the CTSB score could aid in diagnosing MASLD. It has been reported that 99% of patients with NAFLD meet MASLD criteria, indicating an identical natural history (33). The differences between MASLD and NAFLD are minimal, suggesting that the results from previous NAFLD studies are still valid under the new definition of MASLD (34). MASLD's diagnosis requires a minimum of ≥5% hepatic steatosis and the presence of 1 cardiovascular metabolic criterio
留言 (0)