
記住我


Forty-two adult male Wistar rats (8–10 weeks in age and 180–200 g weight) were purchased from and housed in the Animal House of the Faculty of Medicine, Cairo University. Animals were left for seven days to acclimate to ordinary environmental living conditions regarding humidity, temperature, and dark/light cycles. Rats had free access to food and water to ensure normal growth and behavior; they were kept in wire mesh cages (three rats in each) before starting the experimental procedures. All animal procedures were done in accordance with the highest International Criteria for Animal Experimentation of Helsinki. The Faculty of Medicine, Cairo University Ethical Approval No is; CU/III/F/38/22.
Drugs and chemicalsSTZ was purchased from Sigma‐Aldrich, MO, USA, and was given at doses of (30, 40 &50 mg/kg). STZ was dissolved in freshly prepared 0.1 M citrate buffer (pH 4.5; Talpate, Bhosale, Zambare, &Somani). Captopril purchased from Sigma-Aldrich, MO, USA, as a powder, was dissolved in sterile distilled water and was given at 50 mg/kg orally. All other chemicals and reagents were of high analytical grade.
Investigation protocolsRats were randomly divided into seven groups (six rats each), Group I; control normal rats (fed a normal rat chow (12% fat, 60% carbohydrate, and 28% protein), and the other six main experimental groups were maintained on a HFD; 41% fat, 41% carbohydrate, and 18% protein) for 2 weeks. Then, the overnight‐fasted rats in the experimental groups were injected with STZ. The rats were allocated to: Group II (STZ-30); the rats in this group received STZ at a dose of 30 mg/kg (I.P.) [19], Group III (STZ-30-Cap); the rats were subjected to the intake of captopril (50 mg/kg orally) [20, 21] one hour just before injecting STZ at a dose of 30 mg/kg, group IV (STZ-40); the rats in this group were subjected to STZ injection at a dose of 40 mg/kg I.P.), group V (STZ-40-Cap): the rats were subjected to oral administration of captopril at the same of group III one hour just before injecting 40 mg/kg of STZ, group VI (STZ-50); the rats were subjected to STZ injection at a dose of 50 mg/kg (I.P.), and group VII (STZ-50-Cap); the rats were subjected to oral administration of captopril (at the same of group III, and V one hour just before injecting 50 mg/kg of STZ.
At the end of the study, after 28 days (one week allowed for acclimatization of the experimental rats, followed by a two-week span during which the rats were maintained on a HFD). The final week was dedicated to the implementation of the treatment protocol and served as the end-point of the study, the blood pressure of each rat was measured using the tail-cuff method. The animals were fasted overnight for about 12 h, and then the blood samples were obtained from the femoral vein under ketamine/xylazine (60/7.5 mg/kg, i.p) [22] anesthesia using non-heparinized capillary tubes for separation of sera. Samples were kept immediately in ice-chilled, siliconized disposable glass tubes. The serum samples were obtained by centrifuging blood samples at 4,000 g for 15 min at 4 °C and kept at − 80 °C until further analysis. After that, the rats were sacrificed by cervical dislocation under anesthesia, and the pancreatic tissues were excised and fixed in a 10% buffered formalin solution for histopathologic analysis. More treatment protocol clarification is shown in Fig. 1.
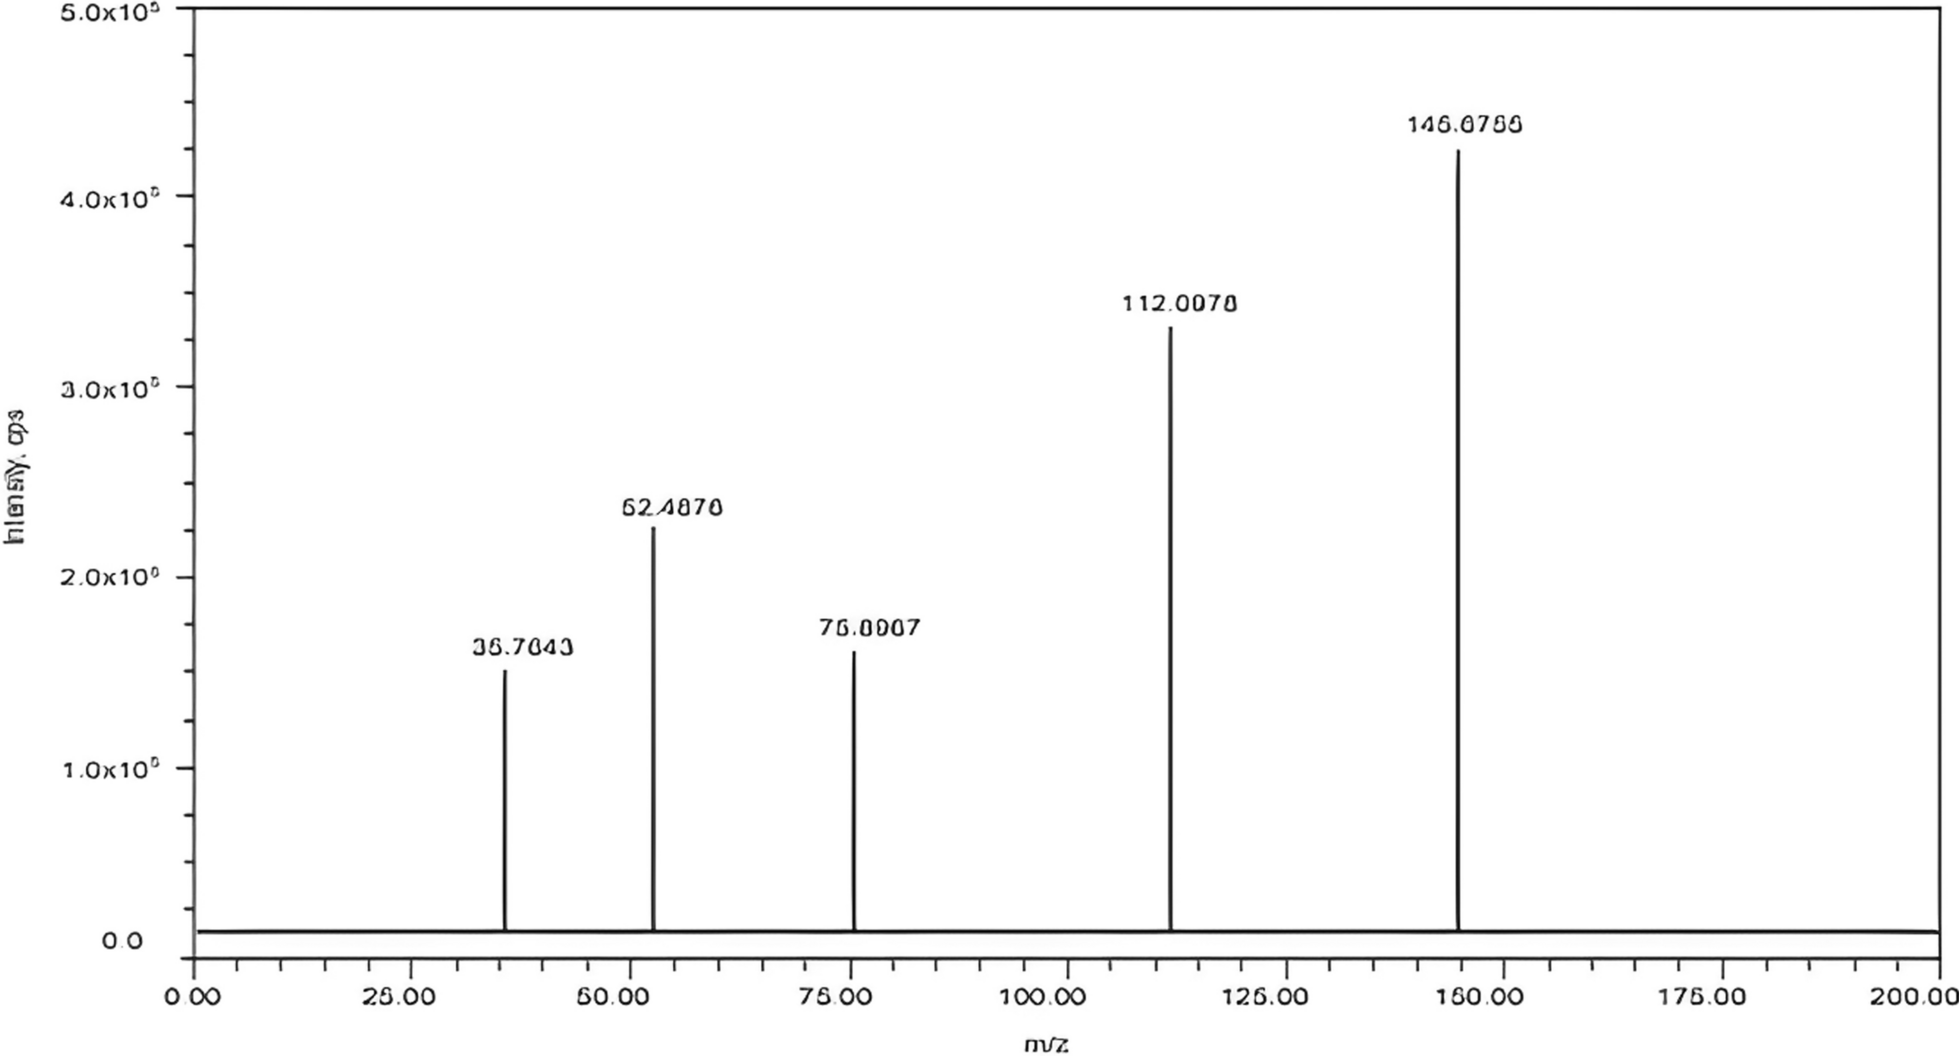
Fig. 1
Schematic illustration of the timeline of scheduled interventions for all examined groups. STZ Streptozotocin, Cap Captopril
Noninvasive blood pressure measurementThe noninvasive rat tail systolic arterial blood pressure was recorded at the end of the study using a noninvasive blood pressure meter (LE 5002, Harvard Apparatus). The rat is placed in a restrainer and warmed. A pneumatic pulse sensor is attached to its tail. A cuff is placed around the tail, and slowly inflated above the systolic pressure until it causes pulsations to cease, measured by the piezo-electric pulse sensor. The cuff pressure at which pulsations cease is taken to be the SBP in the tail.
Verification of diabetesIntraperitoneal glucose tolerance test (IPGTT)All rats were subjected to IPGTT [23, 24]. Male rats were fasted overnight and injected with glucose at a dose of 2 g/kg (I.P.). Blood glucose levels were measured at times of fasting (time zero), 30, 60, and 120 min with a glucometer (GlucoDrTM, All Medicus Co. Ltd, Gyeonggi, Korea) [25].
Biochemical measurementTNF-α in pancreatic tissue by ELISATNF-α in pancreatic tissue protein was assessed by ELISA technique according to kit instructions; Rat TNF-α ELISA Kit, Catalog No: MBS2507393. MyBioSource, Inc. San Diego, CA 92195–3308, USA.
IL-1β in pancreatic tissue by ELISAIL-1β in pancreatic tissue protein was assessed by ELISA technique according to kit instructions; Rat IL-1β ELISA Kit. Catalog No: MBS824956.MyBioSource, Inc. San Diego, CA 92195–3308.
NO level in pancreatic tissueNO level in pancreatic tissue was assessed according to kit instruction; Nitric Oxide Assay Kit (Colorimetric). Catalog No: ab65328, Abcam, Waltham, USA.
GLTU2 gene expression in pancreatic tissue by RT-PCRThe pancreatic tissues from all studied groups were homogenized and total RNA was isolated with Gene JET Kit (Thermo Fisher Scientific Inc., Germany, #K0732). A one-step qRT-PCR reaction was done; for reverse transcription; about 5 µl from the total RNA from each sample (once for the GLUT2 gene and once for ß actin gene) was used with subsequent amplification with Bioline, A median Life Science company, UK (SensiFASTTM SYBR R Hi-ROX) One-step Kit (catalog number PI-50217 V) in a 48-well plate using the Step-one instrument (Applied Biosystems, USA). Thermal profile was as follows: 45 °C for 15 min in one cycle (for cDNA synthesis), 10 min at 95 °C for reverse transcriptase enzyme inactivation, followed by 40 cycles of PCR amplification. 10 s at 95 °C, 30 s at 60 °C, and 30 s at 72 °C were adjusted for each cycle.
RNA quantitation assessment was carried out using a spectrophotometer the Nano Drop® (ND)-1000 (Nano Drop Technologies, Inc.) by measuring the absorbance at 260 nm.
RNA purity was assessed by comparing the absorbance ratio using a spectrophotometer the Nano Drop® (ND)-1000 (Nano Drop Technologies, Inc.) as we measured the absorbance at 280 to exclude contamination with protein and reagent that absorbed near 280, the 260/280 ratio was 2, also the absorbance at 230 was measured to exclude contamination with another compound as carbohydrate and phenol that absorb near 230, the 260/230 ratio was 2.1
From the expression of the studied genes, genes were normalized relative to the mean critical threshold (CT) values of ß actin as the housekeeping gene by the Ct method. Primers’ sequences for studied genes are listed in Table 1.
Table 1 Primer sequence for a studied genePancreatic tissues histological studyThe Pancreas was dissected, fixed in 10% formaldehyde solution, and processed into paraffin blocks. Five-micron sections were cut and mounted on glass slides for hematoxylin and eosin (H&E) staining to examine structural changes in islets of Langerhans in the pancreas.
Immunohistochemical staining of the pancreatic tissuesPancreatic sections were de-paraffinized, hydrated with descending grades of alcohol, and treated with citrate buffer pH 6 in the microwave for antigen retrieval, then incubated overnight with: 1-anti-insulin antibody (ab63820; rabbit polyclonal antibody, dilution (1:100), Abcam, Cambridge, UK). 2-anti-TNF-α receptor (ab220210; mouse monoclonal antibody, dilution (1:100), Abcam, Cambridge, UK). Two drops of biotinylated secondary antibody were applied for 20 min and then two drops of streptavidin peroxidase for 10 min. The reaction was visualized with diaminobenzidine (DAB) as a chromogen and Mayer’s hematoxylin as a counter-stain. The primary antibodies were replaced in negative control serial sections with PBS.
Morphometric assessmentThe “Leica Qwin 500 C” image analyzer computer system Ltd. (Cambridge, UK) was used to collect the data. The image analyzer was made up of an Olympus color video camera, a colored monitor, and an IBM hard drive that was attached to a light microscope and ran “Leica Qwin 500 C” software. To automatically translate the measurement units (pixels) generated by the image analyzer program into actual micrometer units, the image analyzer was first calibrated.
The mean diameter of the islet of Langerhans, area % of anti-insulin immunoreactivity, and optical density of TNF-α immunoreactivity were assessed in 10 non-overlapping randomly selected high-power fields (× 400).
Statistical analysisThe results were obtained as mean ± standard deviation (SD). Statistical analysis for parametric measures was done via one-way analysis of variance (ANOVA) version 25, followed by the Tukey–Kramer multiple comparisons test as a post hoc test. A comparison of glucose levels in each group with time was done using repeated measure ANOVA. Statistical significance was considered when P < 0.05. Statistical analysis will be carried out using IBM SPSS Statistics for Windows, version 25 (IBM Corp., Armonk, N.Y., USA).
留言 (0)