Study samples
Study subject recruitment was conducted at the Department of Gastroenterology, Lithuanian University of Health Sciences (Kaunas, Lithuania) during the period of 2020–2022. The study was approved by the Kaunas Regional Biomedical Research Ethics Committee (Protocol No. BE-2-31) and all subjects signed written informed consent to participate in the study. All procedures were performed in accordance with relevant guidelines and regulations. Colonic biopsies were obtained from patients with a previously established diagnosis of UC (based on clinical, endoscopic, and histological examinations). Individuals without inflammatory, oncological, or other gastrointestinal diseases were enrolled in the study as controls. UC patients underwent colonoscopy procedures either because of a disease flare or for screening purposes, while control individuals underwent colonoscopy procedure through colorectal cancer screening program. The study included two cohorts of samples (Table 1). UC patients were subgrouped based on endoscopic Mayo score (score of 0–1 was considered mild disease (healed mucosa), 2 reflected moderate severity of UC, and 3 was considered as an indicator for severe UC (with spontaneous bleeding and ulcerations in the colon) [6]. Individuals with an endoscopic Mayo score > 1 were classified as active UC patients, while those with endoscopic Mayo score ≤ 1 were considered as a quiescent UC (in remission) group. The age and sex of individuals did not differ significantly between patient groups of each cohort (cohort 1 and 2).
Table 1 Demographic and clinical characteristics of the study subjectsNucleic acid extraction
For gut microbiota analysis, nucleic acids were extracted from fecal samples using the AllPrep PowerFecal DNA/RNA kit (Qiagen) following the manufacturer’s protocol. In brief, up to 200 mg of fresh-frozen fecal samples were lysed using chemical and mechanical homogenization and DNA was eluted into 30 µl of elution buffer. For colonic epithelial cell gene expression analysis, intestinal monolayer cultures were processed using AllPrep DNA/RNA Micro Kit (Qiagen). Cells were lysed and homogenized chemically, using denaturing guanidine isothiocyanate-containing buffer. Purified RNA was eluted into 14 µl of RNAse and DNAse-free water. Purity and concentration of extracted nucleic acids were evaluated using Qubit 4 (Invitrogen) fluorometer and respective assay kits.
16S rRNA-gene library preparation and sequencing
The isolated DNA underwent amplification with the specific primer pair set 27F 5’-AGAGTTTGATCCTGGCTCAG-3’ and 338R 5’-TGCTGCCTCCCGTAGGAGT-3’, using dual-indexing during the PCR process. Cycling conditions: 1 × 98 °C 30 s.; 34 × 98 °C 9 s., 50 °C 1 min., 72 °C 20 s.; 1 × 72 °C 10 min; 1 × 10 °C ∞. Purification and normalization of the PCR products were carried out using the Invitrogen SequalPrep Normalization Plate Kit (Thermo Fisher Scientific). After the preparation, 16S rRNA gene sequencing was conducted on the Illumina MiSeq platform in accordance with the manufacturer’s instructions, utilizing MiSeq Reagent Kit v3 (2 × 300 bp) (Illumina).
16S rRNA-gene sequencing data analysis
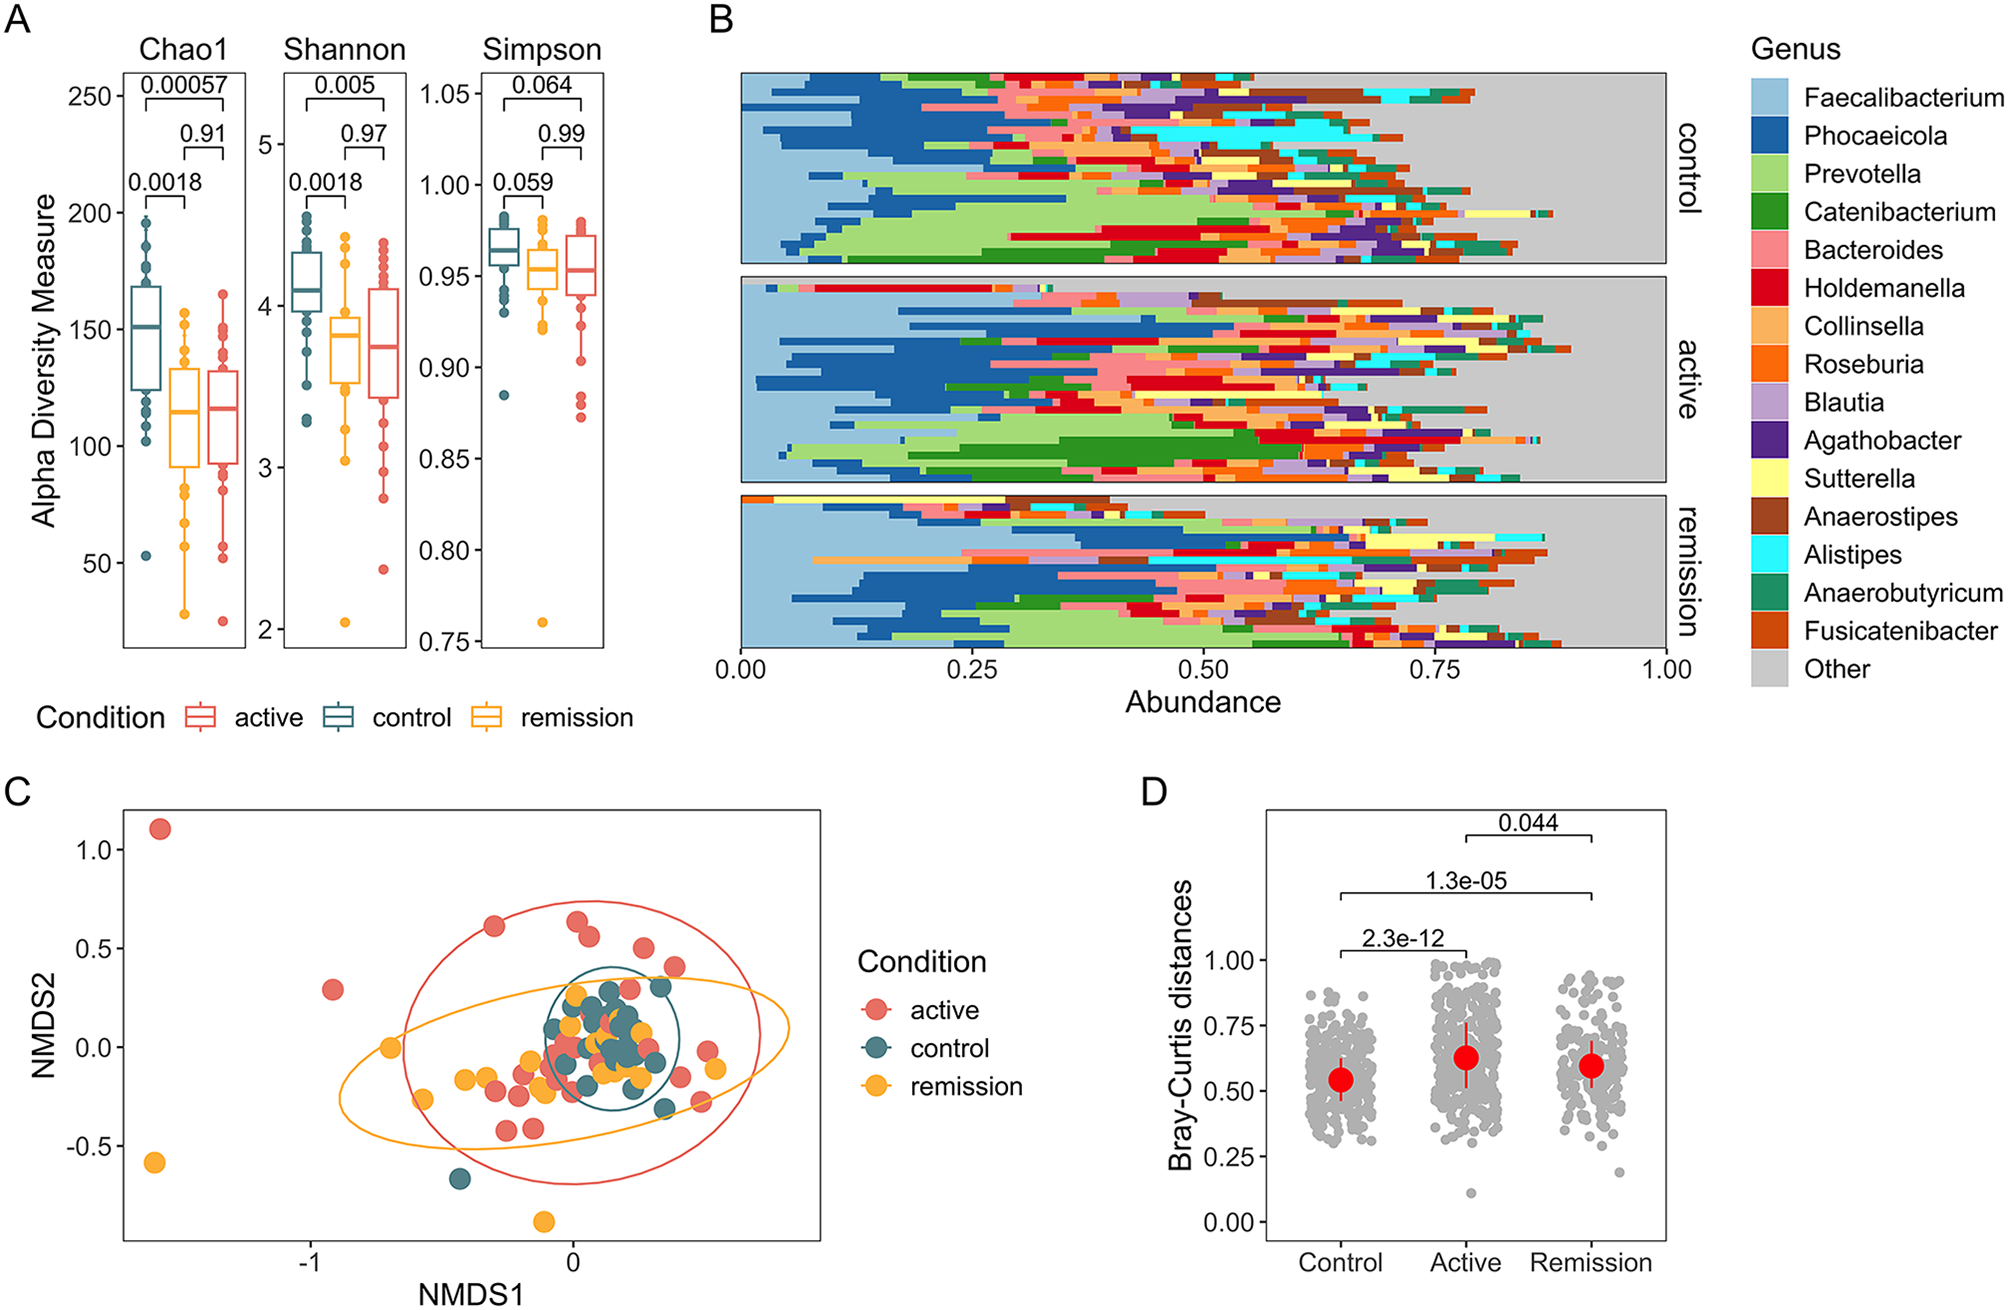
The obtained sequencing data were processed into amplicon sequencing variants and taxonomically annotated against the RDP v18 database [7] using the ‘DADA2’ (V.1.10) [8] software package in R, following the DADA2 workflow. Specifically, reads were truncated to 200 base pairs for forward and 150 base pairs for reverse using the truncLen parameter, while the maximum number of expected errors (maxEE parameter) was set to 3 for both directions. Additionally, trimming of the first 5 bases from both forward and reverse reads (trimLeft parameter) was performed to enhance overall quality, with primer sequences already removed from the fastQ files. The maxN parameter was set to 0, indicating the exclusion of reads containing ambiguous base calls (N’s). Reads were truncated at the first instance of a quality score equal to or lower than 5 using the truncQ parameter. These parameter configurations were chosen to ensure the retention of high-quality reads while effectively filtering out artifacts and low-quality regions. Rarefaction was used as a measure of normalization, with all samples rarefied to 22,032 reads per sample. Rare taxa, defined as ASVs with fewer than 10 counts and present in less than 10% of total samples were filtered before performing α-diversity, β-diversity and compositional analyses. Alpha diversity was assessed using the Chao1, Simpson and Shannon index, while Bray Curtis dissimilarity on taxa relative abundances was used as a measure of β-diversity. Permutational analysis of variance (PERMANOVA) within the vegan package was employed to identify significant changes in Bray-Curtis dissimilarity. For core microbiome analysis, a minimum relative abundance of 0.1% in at least 50% of samples was applied. Differential abundance analysis was conducted on the taxa count matrix utilizing the Wilcoxon rank-sum test. This analysis focused only on taxa that had a minimum count of 10 and appeared in more than 20% of the samples. The P values obtained from the Wilcoxon rank-sum test underwent Benjamini-Hochberg (BH) correction to control the false discovery rate. A corrected P value (BH adjusted PWilcoxon) threshold of 0.05 was set to determine statistical significance in the differential abundance analysis. Compositional plots were generated using microViz package [9].
Establishment and expansion of 3D colonic epithelial organoids
3D undifferentiated colonic epithelial organoids from adult intestinal stem cells were established and cultured according to the protocol of IntestiCult Organoid Growth Medium (Human) (OGMH) (StemCell Technologies) with slight adjustments. Briefly, colon biopsies were minced and digested using Gentle Cell Dissociation reagent (StemCell Technologies). To further isolate colonic crypts from tissue homogenate, samples were vigorously pipetted in cold DMEM/F-12 (supplemented with 1% BSA and 15 mM HEPES) medium, passed through a 70 μm pore filter and centrifuged. Isolated colonic crypts were mixed with extracellular matrix (Matrigel Matrix Phenol Red-free, LDEV-Free (Corning)). The volume of 50 µl of crypt-Matrigel mixture was used to form domes in a 24-well cell culture plate. Colon organoids were cultured in OGMH medium supplemented with penicillin/streptomycin (100 µg/ml) (Gibco). Medium also contained RHO/ROCK signaling pathway inhibitor Y-27,632 (10 µM) (Stemcell Technologies) for the first two days of culturing. Colonic epithelial organoids were incubated at 37 °C with 5% CO2. Undifferentiated 3D organoids were microscopically evaluated using ZEISS Axio Observer 7 and ZEISS ZEN 3.1 (blue edition) software (ZEISS). The primary splitting of colonic epithelial organoids was performed after 1–2 weeks from culture establishment. Subsequent passaging of cultures was performed every 7–10 days depending on the maturity of organoids (usually, 7–10 days post-passage).
Establishment of colonic epithelial cell monolayers
Human colonic epithelial cell monolayers were established from expanded 3D colonic epithelial organoids in 24-well cell culture plates (Falcon). Briefly, each well of the cell culture plate was coated with Collagen I, Rat tail (Gibco) (≈ 5 µg/cm2) for 2 hours at 37ºC, then washed with PBS. Simultaneously, undifferentiated 3D colonic epithelial organoids were reduced into single cell suspensions. Organoids were disrupted by adding TrypLE Express (Gibco) supplemented with Y-27632 (StemCell Technologies) and incubating suspensions at 37ºC for 10 min. The suspension was pipetted every 5 min to ensure the appropriate cell separation. TrypLE Express was blocked by addition of equal volume of DMEM/F-12 (StemCell Technologies) and suspension was centrifuged at 400 xg for 5 min. Pellet was resuspended in DMEM/F-12, passed through a 40 μm cell strainer and centrifuged again. Colonic epithelial cells were resuspended in IntestiCult OGMH (StemCell Technologies) supplemented with penicillin/streptomycin (100 µg/ml) (Gibco) and Y-27632 (10 µM) (Stemcell Technologies) and plated on the Collagen I-coated wells. The number of 5 × 10⁵ cells was used per well for seeding monolayers. Monolayers were incubated at 37 °C with 5% CO2. The growth of 3D organoid-derived colonic epithelial cell monolayers was monitored under the microscope every day. Cell culture medium (IntestiCult OGMH supplemented with penicillin/streptomycin and Y-27632) was changed every 2–3 days until monolayer reached 100% confluency. Then, culturing medium was changed into cell differentiation medium (IntestiCult Organoid Differentiation Medium (Human) (ODMH) (StemCell Technologies)) supplemented with DAPT (5 µM), penicillin/streptomycin (100 µg/ml) (Gibco) and Y-27632 (10 µM) for 5 days to induce stem cell transition into specialized colonic epithelial cell types. Medium change was performed every 2 days. Monolayers were microscopically evaluated using ZEISS Axio Observer 7 and ZEISS ZEN 3.1 (blue edition) software (ZEISS).
Immunofluorescence microscopy
The cellular and structural composition of the established patient organoid-derived differentiated colonic epithelial cell monolayers was evaluated by immunofluorescence microscopy. First, monolayers were formed on 8-well format Collagen I-coated Nunc Lab-Tek II Chamber Glass slides (Thermo Scientific) and grown until full confluency and then differentiated as described above. Further, monolayers were fixed by incubating them in 4% paraformaldehyde (Sigma-Aldrich) solution for 30 min at RT. Further, colonic epithelial cell monolayers were permeabilized by using 0.5% Triton-X (Sigma-Aldrich) solution and blocked with 2% BSA blocking solution. Finally, conjugated monoclonal antibodies were diluted in antibody dilution solution (dilution ratio 1:50 − 1:500), applied to the processed monolayers and incubated for 60 min at RT. Conjugated antibodies for (i) tight-junction marker (Anti-ZO-1-Alexa Fluor 555 (MA3-39100-A555, Invitrogen)), (ii) proliferating cell marker (Anti-ki67-Alexa Fluor 488 (ab206633, Abcam)), differentiated/specialized cell markers (for Goblet cells, colonocytes, enteroendocrine cells) (Anti-Mucin2-Alexa Fluor 555 (bs-1993R-A555, Biocompare), anti-Cytokeratin 20-Alexa Fluor 488 (ab275988, Abcam), anti-Chromogranin A-Alexa Fluor 488 (ab199192, Abcam), respectively) were used. Hoechst 33342 (Invitrogen) was used as a counterstain for cell nuclei. All images were acquired with ZEISS Axio Observer 7 inverted fluorescence microscope using 5x and 10x objectives and analyzed by ZEISS ZEN 3.1 (blue edition) software (ZEISS).
Bacteria cultivation and preparation for co-culturing
Reference strains used for the tests were Escherichia coli ATCC 25,922 (Thermo Scientific) and Phocaeicola vulgatus ATCC 8482 (ATCC). Before assembling the co-culture system, bacteria were kept at -80ºC in Brain Heart Infusion Broth with glycerol (30%). At first, bacteria were inoculated on agar. Specifically, Trypton Soy Agar (TSA) (Sigma-Aldrich) was used for Escherichia coli, while Trypton Soy Agar supplemented with Defibrinated Sheep blood (5%) (Liofilchem) was used for Phocaeicola vulgatus. Both strains were cultivated for 24 h at 37ºC; Escherichia coli were cultured under aerobic conditions, while anaerobic conditions were used for Phocaeicola vulgatus. Bacterial suspensions were prepared using phosphate-buffered saline solution (Invitrogen).
Colonic epithelial cell and bacteria co-culturing
Differentiated patient-derived colonic epithelial cell monolayers and two bacterial strains - Escherichia coli and Phocaeicola vulgatus - were used to establish a co-culture systems. Monolayers cultured without bacteria were used as control samples. First, to assemble co-cultures, cell differentiation medium was removed, and epithelial cell monolayers were washed twice with 500 µl of pre-warmed D-PBS (StemCell Technologies). Bacterial suspensions were centrifuged, and pellet was resuspended in a differentiation medium without antibiotics (IntestiCult ODMH supplemented with DAPT (5 µM) and Y-27632 (10 µM)). 2 × 10⁶ of bacteria (Escherichia coli or Phocaeicola vulgatus) were added into respective wells with epithelial cell monolayers and co-cultures were incubated for 2 h at 37ºC with 5% CO2. After incubation, cell culture medium containing bacteria was discarded, epithelial cell monolayers were washed twice with 500 µl of D-PBS. Then, 500 ul of pre-warmed IntestiCult ODMH (StemCell Technologies)) supplemented with DAPT (5 µM), penicillin/streptomycin (100 µg/ml) (Gibco) and Y-27632 (10 µM) was added into each well and monolayers were cultured for additional 24 h at 37ºC with 5% CO2. After incubation, monolayers were washed with 500 µl of D-PBS and lysed using 350 µl of RLT Plus buffer (supplemented with 1% of β-mercaptoethanol) (Qiagen). Lysates were stored at -80ºC until further use for nucleic acid extraction.
Targeted gene expression analysis using RT-qPCR
To evaluate the expression of TLR4, ZO1, HSPA1A and HSPB1 genes in patient organoid-derived colonic epithelial cell monolayers, total RNA from these samples was reverse transcribed using High-Capacity cDNA Reverse Transcription Kit (Applied Biosystems). Up to 500 ng of total RNA was used per reaction to synthesize first strand cDNA. Further, the measurement of gene expression was based on SYBR Green chemistry by using SYBR Green PCR Master Mix (Applied Biosystems) and pairs of gene-specific primers (final concentration of each primer − 300 nM). Primers used for amplification and amplicon size are listed in Table 2. Cycling conditions: 1 × 95 °C 10 min.; 40 × 95 °C 15 s., 60 °C 1 min. Analysis was performed on the 7500 Fast Real-Time PCR System (Applied Biosystems). The amount of 4 ng of template DNA was used for each reaction. The cycle threshold (CT) values of genes-of-interest were normalized to the value of ACTB reference gene. All the procedures were performed in accordance with the manufacturer’s protocol and recommendations.
Table 2 Primers used for targeted gene expression analysisStatistical analysis
Statistical gene expression analysis was performed using R Studio software (version 4.3.2). Data distribution was determined using the Shapiro-Wilk test, gene expression differences were analyzed using the Wilcoxon rank-sum test. The difference between the values was considered significant when P < 0.05.


留言 (0)