
記住我


The present analyses are based on data from the UK Biobank, a prospective cohort of about 500,000 individuals aged 40 to 69 years at recruitment; participants were approximately 54% women and 46% men, predominantly of white ethnicity, and generally from higher socioeconomic backgrounds. Participants were invited to attend one of the 21 assessment centres in the UK between 2006 and 2010 to provide baseline information, physical measures, and biological samples according to standardised procedures [12]. Participants were followed up through linkage to healthcare records, including primary care, inpatient registries and death records, as of 1 February 2022. The register-based information was complemented with data obtained through online questionnaires at baseline and follow-up examinations [13].
We included unrelated individuals of European ancestry with data available from the enrolment examination on height and weight and on self-reported ‘comparative body size at age 10’. European ancestry was defined using the criteria provided by the Pan-UK Biobank team (https://pan.ukbb.broadinstitute.org; 2020). Related individuals were excluded using the Kinship-based INference for Genome-wide association studies (KING) algorithm [14]. Individuals with prevalent type 1 diabetes (N=1982), prior type 2 diabetes (N=6866) or cardiovascular disease (N=10,826) or both (N=4703) at baseline, and pregnant women (N=79) at baseline, were excluded (electronic supplementary material [ESM] Fig. 1).
The UK Biobank received ethical approval from the North West–Haydock Research Ethics Committee (11/NW/0382). The current study was conducted under the UK Biobank application 32683, and all participants provided informed consent at enrolment.
Child-to-adult body size categoriesBody weight and height in adulthood were measured by trained staff using standardised procedures at the enrolment assessment visit [15]. Measurements were taken without shoes and heavy clothing. Weight was measured using a Tanita BC-418MA scale (Amsterdam, Netherlands), and standing height was measured barefoot, using a Seca 202 device (Birmingham, UK). BMI was calculated by dividing body weight in kilograms by the square of height in metres.
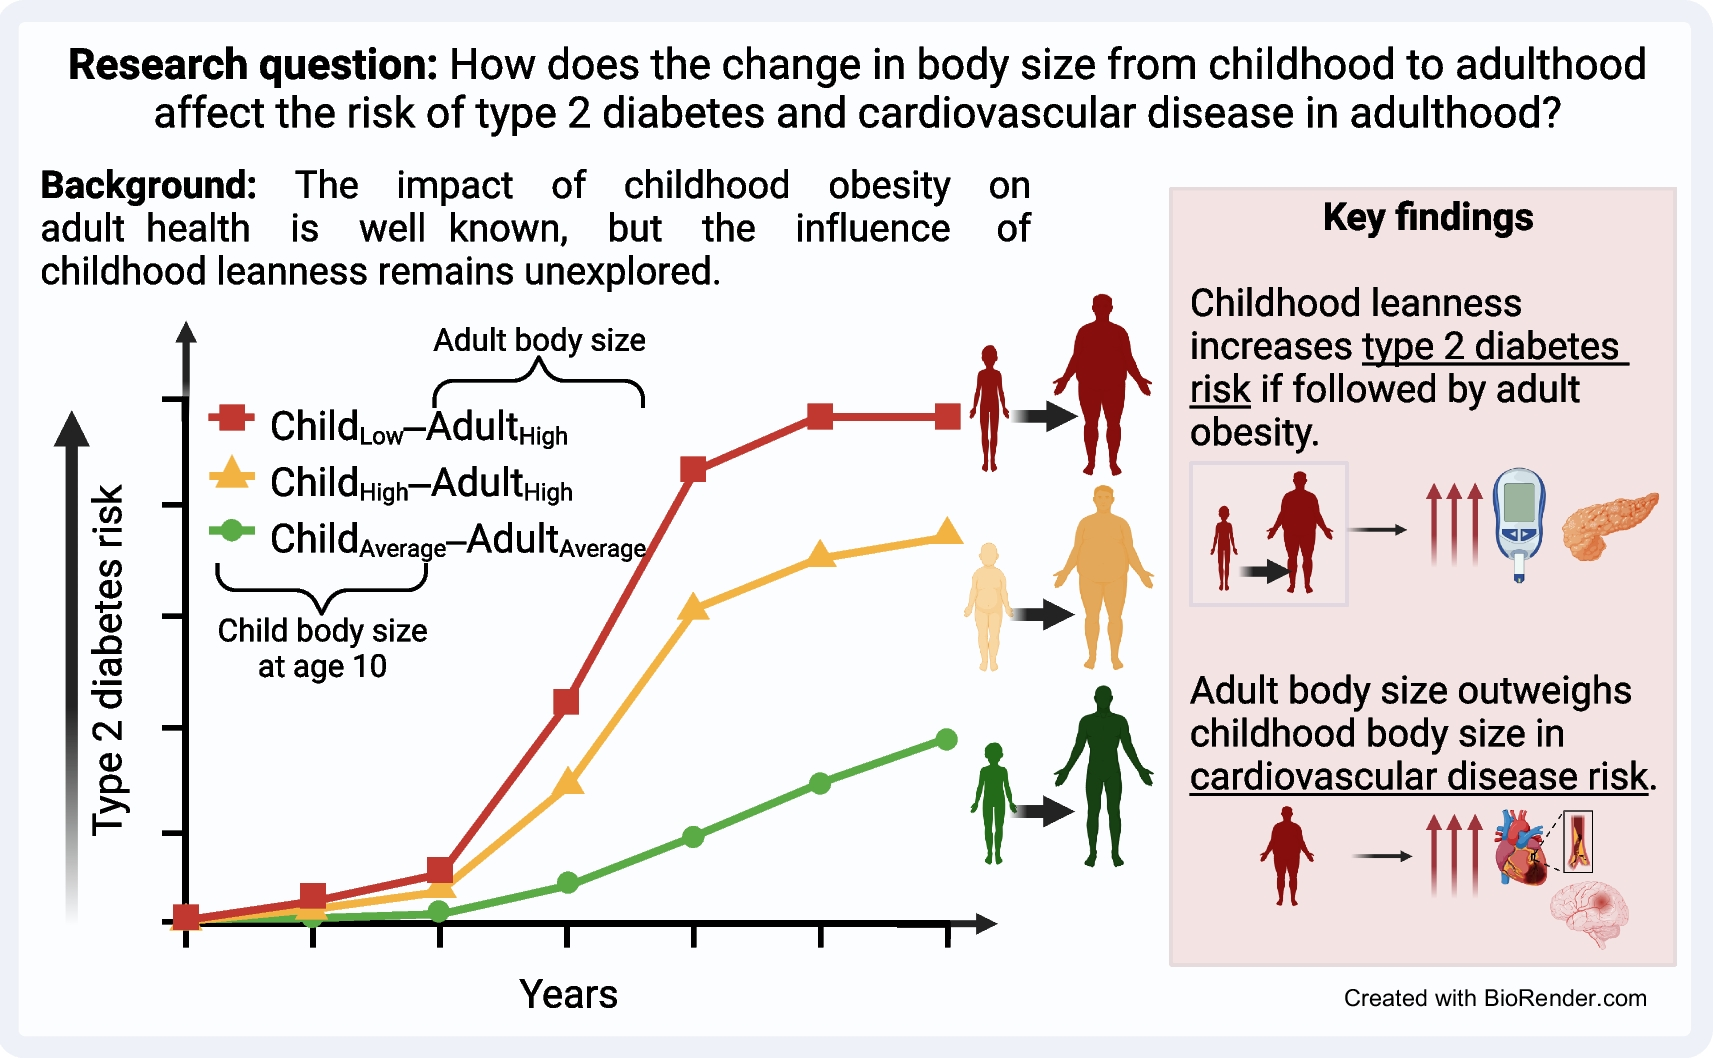
Childhood body size was defined using data from the touchscreen questionnaire. Participants were asked the question: ‘When you were 10 years old, compared to average, would you describe yourself as: thinner, about average, or plumper?’. The answers were used to define three groups of childhood body size: ‘thinner’ (ChildLow), ‘about average’ (ChildAverage) and ‘plumper’ (ChildHigh), representing 32.7%, 51.5% and 15.8% of the study population, respectively. Of the included participants, 1.6% answered that they ‘Do not know’ (N=5869) or ‘Prefer not to answer’ (N=76) to that specific question and thus were excluded. The validity of this measure has been supported by previous studies investigating polygenic scores against measured BMI from British and Norwegian birth cohorts [16, 17].
We also tested the standard cut-offs for defining overweight and obesity according to the World Health Organization [18]. However, we could not find a corresponding adult low body size group large enough, including participants BMI≤18.5 (N=1892), which is 0.5% of the population. Further, most individuals fell into the overweight group (~66%, BMI≥25), equating to adult high body size. Thus, when categorising child-to-adult body size with these criteria, extreme groups were small and unbalanced in sample size and disease incidence. For this reason, we made adult body size as comparable as possible in sample size to child body size to allow properly balanced groups, and as previously done in earlier research [16].
Adult body size was estimated using BMI residuals from a model that included age, age squared, and self-reported sex as predictors (BMI ̴ age + age2 by sex). We created three adult body size groups of the same size as the corresponding childhood groups: AdultLow (32.7%), AdultAverage (51.5%), and AdultHigh (15.8%), with the corresponding adult BMI mean, minimum, and maximum values, as shown in Fig. 1, and with sex-stratified figures in ESM Fig. 2. Next, we created nine child–adult body size categories by combining the three child and three adult body size groups; proportions of these nine categories are reported in Fig. 1. Each category represents an individual's trajectory from a body size group in childhood to a body size group in adulthood (Fig. 1, ESM Fig. 2).
Fig. 1
Definition and proportions for body size change from childhood to adulthood
Incident cardiovascular disease and type 2 diabetesFatal and non-fatal myocardial infarction or stroke were defined based on algorithmic combinations of linked data from hospital inpatient records (>94% of cases), death register records (~4–5%), and baseline questionnaire data on self-reported medical conditions, operations and medications (<0.5%). High-accuracy algorithms were developed by the UK Biobank outcome adjudication group [19, 20]. A cardiovascular composite endpoint was then created, using the first occurrence for either myocardial infarction or stroke to define the time-to-event for the cardiovascular endpoints.
The first occurrence of type 2 diabetes was ascertained from medical records including hospital inpatient records (87.8%), primary care records (9.8%) and death register records (0.3%), using ICD-9 codes (250) and ICD-10 codes (E11). This information was supplemented with baseline questionnaire data on self-reported medical conditions (2.1%) [13].
Time-to-event was defined from the date of the centre assessment in the UK Biobank to the date of the first occurrence of incident type 2 diabetes or cardiovascular diagnosis, date of death, being lost to follow-up, or end of follow-up. Follow-up time ended on 1 February 2022, as this was the latest date available for endpoint occurrence from the medical records. Time-to-event was also calculated separately for myocardial infarction and stroke.
Covariates and potential confoundersHere, we selected age (years), sex (women/men), socioeconomic indicators (education; Townsend deprivation index) and assessment centre as potential confounders. Education was defined by the highest qualification achieved, converted into the International Standard Classification for Education (ISCED) (ESM Table 1). The Townsend deprivation index was calculated based on preceding national census output areas, with higher scores representing more socioeconomic deprivation [21].
We report baseline anthropometric measures and cardiometabolic risk markers across the nine body size categories. Anthropometric measures were assessed using BMI, WHR (calculated by dividing waist circumference [cm] by hip circumference [cm]) and body fat percentage (estimated by bioimpedance). Cardiometabolic risk markers, measured in serum samples at baseline, included glucose (mmol/l), HbA1c (mmol/mol), total cholesterol (mmol/l), LDL-cholesterol (mmol/l), HDL-cholesterol (mmol/l), and triglycerides (mmol/l), all measured using Beckman Coulter AU5800 (UK) analyser, except for HbA1c, measured using Bio-Rad Variant II Turbo (Hertfordshire, UK) analyser. Systolic blood pressure (mmHg) was measured twice, a few moments apart, using an automated device (Omron, Hoofddorp, the Netherlands).
Statistical analysisBasic descriptive information over the nine child–adult body size categories was reported using means and standard deviations for continuous variables and n (%) for categorical variables. Differences in continuous variables were tested using one-way ANOVA, and in categorical variables using χ2 tests.
The Kaplan–Meier estimator was used to assess the association between the childhood or adulthood groups separately, and the nine child–adult body size categories and incidence of type 2 diabetes or cardiovascular disease. To quantify this association, time-to-event data was analysed using Cox proportional hazards regression, adjusted for potential confounders listed earlier to obtain HR and 95% CI. The reference category used was the ChildAverage–AdultAverage group. Sensitivity analyses were conducted to verify whether the risk of cardiovascular disease differed when considering the first occurrence of myocardial infarction or stroke separately. Furthermore, we included prevalent cases of cardiovascular disease and type 2 diabetes and recreated the nine child–adult body size categories to assess whether the results differ from incident disease analysis. Additionally, we performed a sensitivity analysis that included information on birthweight reported at baseline to see whether the main results were attenuated when adding birthweight as a covariate in the models. Furthermore, we made additional adjustments for various lifestyle factors (smoking status, dietary score, physical activity, sleep and sedentary time), family history of diabetes, and prevalent diseases (see ESM Methods) to assess whether any of these might be mediating or confounding our findings. Finally, we stratified by sex and defined age tertiles to assess the potential impact of body size changes from childhood to middle-aged or older adulthood. All analyses were stratified by sex and the results were compared.
In a post hoc analysis, we examined the impact of genetic factors on the observed associations between child-to-adult body size change and disease risk. Specifically, we considered genetic risk scores related to adult obesity to investigate whether differing genetic risks could explain the particularly high incidence of type 2 diabetes in individuals who were low-sized as children and high-sized as adults, compared with those who were high-sized during both childhood and adulthood (ESM Methods).
All statistical analyses were conducted using Stata 15.0 (StataCorp, College Station, TX, USA; www.stata.com).
留言 (0)