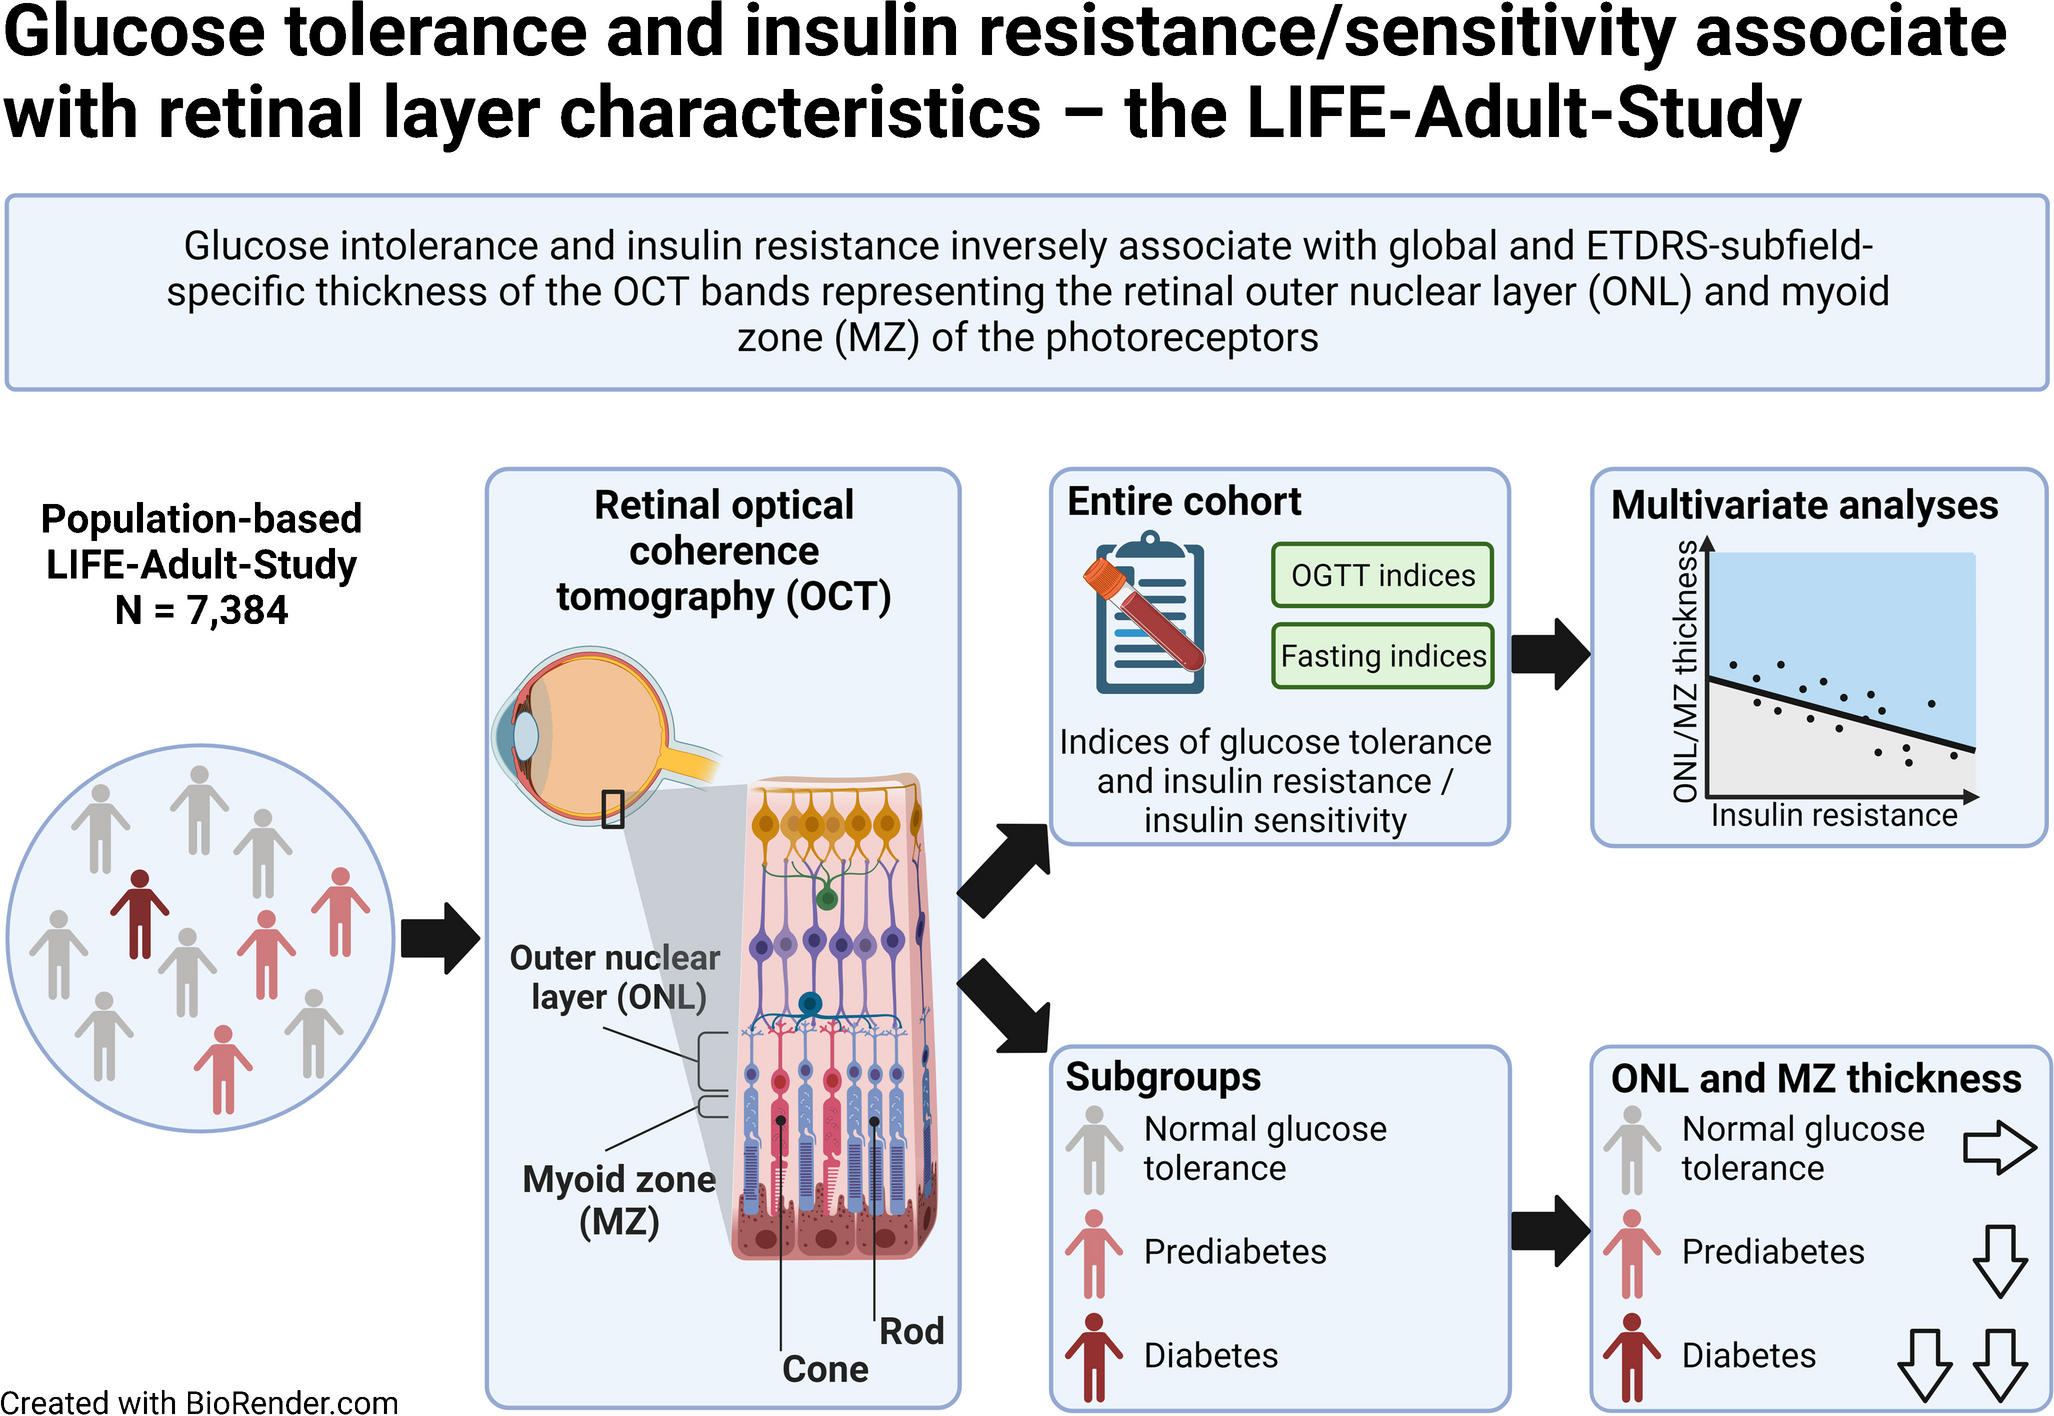
In our large dataset comprising 7384 deeply phenotyped participants, we demonstrate that individuals with diabetes showed thinner global retinal layer thickness in most bands compared with non-diabetic individuals in both sexes. After multivariable adjustment, glucose tolerance, insulin resistance and insulin sensitivity are significantly and independently associated with global thickness of two distinct retinal bands, i.e. ONL and MZ. Thus, markers of insulin sensitivity (e.g. eGDR) are positively related to ONL and MZ thickness, whereas an impaired glucose tolerance (e.g. HbA1c) and insulin resistance (e.g. HOMA2-IR) are inversely related to ONL and MZ thickness. Moreover, we provide sex-stratified normative data for macular band thicknesses specifically for individuals with diabetes, prediabetes and NGT.
High-resolution SD-OCT is a well-established tool to link retinal changes with intraocular (e.g. glaucoma [25, 26]) and extraocular (e.g. CKD [13] and dyslipidaemia [13]) diseases. SD-OCT can be used for the investigation of diabetes-induced eye diseases [27, 28]. However, the effects of a diabetes diagnosis, as well as glucose homeostasis and insulin resistance/sensitivity, on the characteristics of a large number of retinal bands at distinct retinal locations over a large macular area have not, to date, been investigated. Our data indicate that systemic insulin resistance and impaired glucose homeostasis are linked to thinner global and sector-specific ONL and MZ thickness, independent of a diabetes diagnosis. Furthermore, insulin resistance and sensitivity are early markers of metabolic retinal alterations even prior to clinically evident eye diseases and show stronger associations with ONL and MZ thickness compared with hyperglycaemia.
It is interesting to note in this context that hyperglycaemia has been demonstrated as a major pathogenetic component in early diabetic retinopathy [2]. However, we aimed to investigate whether other markers of glucose homeostasis in addition to hyperglycaemia (i.e. insulin resistance and insulin sensitivity) are associated with early metabolic retinal alterations prior to the development of diabetic retinopathy. Based on our results, functional studies are needed to further identify the pathomechanisms by which insulin resistance/sensitivity impairs ONL and MZ layer physiology contributing to associated visual complications, for instance loss of chromatic sensitivity [29]. Both optical bands (i.e. ONL and MZ) represent parts of the photoreceptor cells: the somatic area with the nucleus (ONL) and the myoid part with important metabolic components, such as the smooth and rough endoplasmatic reticulum, Golgi apparatus, and various filaments.
Mechanistically, if insulin resistance/sensitivity associates with differential retinal layer characteristics, a functional insulin signalling cascade would be required. It is interesting to note in this context that the insulin receptor is expressed in several inner and outer retinal layers, including ONL and MZ [30, 31]. Importantly, ONL and MZ comprise different cell types, e.g. photoreceptor cells, responsible for photon signal transmission [32], as well as Müller cells forming junctional complexes with photoreceptors (i.e. the ELM) [33]. Photoreceptor cells are the most metabolically active cell types throughout the retina crucially depending on glucose metabolism [34]. Furthermore, glucose metabolism-relevant receptors (e.g. insulin receptor), the post-insulin receptor signalling cascade (e.g. insulin receptor substrate-1) and glucose transporters have been shown to be expressed on Müller cells and photoreceptor cells [30, 34]. To incorporate principles of retinal neuroanatomy, vascular biology and OCT signal generation in our analysis, we have grouped retinal band thicknesses representing relevant retinal cell types of ganglion cells, the intrinsic retinal vasculature, as well as photoreceptor cells. Importantly, for all of these cell/tissue types, we show reduced thickness in patients with diabetes compared to NGT individuals, strongly supporting our findings in retinal band-specific analyses.
Taking our data, and previous data, into consideration, these retinal layers, i.e. ONL and MZ, might be susceptible to changes in insulin resistance/sensitivity and glucose homeostasis due to their functional insulin signalling cascade. We cannot exclude that the retinal band thinning observed in our study might be a physiological response to protect from diabetes-induced oedema, hinted at by the very low diabetic macular oedema prevalence in the Joslin 50-Year Medalist Study [35]. Clearly, the reasons for the observed decreased thicknesses of ONL and MZ in insulin resistance need to be investigated in future pathophysiological experiments on an ultrastructural level and it needs to be elucidated whether hyperglycaemia and insulin resistance show differential effects on retinal layer characteristics. Interestingly, some but not all studies have demonstrated that structural changes in the retina, including a reduction in ONL thickness, occur in several rodent models of diabetes [36]. It is, therefore, tempting to speculate that insulin resistance can either directly or indirectly (for instance through increased oxidative stress and/or inflammation) impair photoreceptor cell shape and/or cell death [36]. Notably, physical activity as an important lifestyle contributor that impacts insulin sensitivity does not appear to be a major factor confounding our analyses, as retinal band thickness pattern remains similar when individuals with low, medium or high physical activity were analysed separately (ESM Table 3).
It should be pointed out that we have carefully excluded any individual with pre-existing eye diseases and clinically relevant ophthalmological abnormalities prior to analyses. Furthermore, we have adjusted our models for relevant ophthalmological confounders further suggesting an independent link between glucose homeostasis and retinal layer characteristics in an approximately >50-fold larger cohort compared with previous publications. Thus, some, but not all, previous studies have found reduced global layer thicknesses in participants with type 2 diabetes for distinct bands in several small cohorts with or without manifest diabetic retinopathy compared to non-diabetic individuals [5, 9, 10, 37, 38]. Collectively, these data further support our results indicating glucose homeostasis is linked to lower retinal layer thicknesses.
A further strength of our study is the ETDRS-based analysis presenting location-specific pattern of the investigated markers. Here, ONL and MZ showed similar global and ETDRS subfield-specific associations, further validating these two layers as key metabolic areas of the retina.
It is interesting to note that in contrast to other retinal layers, IZ showed positive (with HOMA2-IR) and negative (with eGDR) associations with markers of insulin resistance/sensitivity in the ETDRS subfield-specific analysis. The IZ is the interacting area of photoreceptor outer segment tips and the apical microvilli border of the RPE cells, where phagocytosis of segment debris occurs [34] and where the RPE passes retinoids and other nutrients to the photoreceptors [39, 40]. Therefore, an increased IZ thickness could be representative of disturbed phagocytosis processes in disturbed glucose metabolism. Moreover, individuals with diabetes show stronger associations with retinal band thicknesses in the peri- and parafoveal subfields compared with the central foveal subfield A1, suggesting an eccentricity-dependence of glucose homeostasis on inner retinal effects [41].
This study has several limitations. Our study population predominantly consisted of European individuals, and, therefore, the findings may not be generalisable to populations of different ethnicities. Furthermore, owing to the cross-sectional design of this study at one baseline timepoint, no causal conclusions can be made. Moreover, our SD-OCT analyses do not include choroid, for which there is clear evidence of involvement in diabetic macular oedema and retinopathy [42, 43]. In contrast, to the best of our knowledge, this is the first study analysing static and dynamic continuous measures of glucose homeostasis, insulin resistance and sensitivity in a large number of deeply phenotyped individuals at a very high level of standardisation, as well as a thorough statistical approach accounting for several important covariates. Furthermore, we have incorporated principles of retinal neuroanatomy, vascular biology and OCT signal generation into our analyses to provide more mechanistical insights.
In conclusion, we demonstrate that glucose tolerance, insulin resistance and insulin sensitivity are associated with retinal layer thicknesses. The ONL and MZ show strongest associations with markers of glucose homeostasis, and changes in ONL and MZ thicknesses might predict early metabolic retinal alterations.


留言 (0)