
記住我

Data redundancy was reduced employing PCA (principle component analysis). The eigen values were sorted in descending order. PC1 describes greatest data variance, while PC2 described data variance in an orthogonal direction to PC1. Principal component analysis (PCA) for the descriptors VE3_Dzp, nHBint6, and DCW was demonstrated by loading and scoring plots. Figure 1A displays the scoring plot for dataset compounds. Likewise, Fig. 1B displays the loading plot for M-1 descriptors. PCA score plot describes the type of co-relation between dataset components. The loading plot on the other hand describes the influential power of descriptors on dataset components. As evident from the score plot (Fig. 1A), very few dataset compounds were observed as outliers. The descriptor having maximum influence was observed to be nHBint6 followed by VE3_Dzp and DCW (Fig. 1B).
Fig. 1
PCA for QSAR model M-1; A Score plot for the M-1 descriptors; B Loading plot for the M-1 descriptors
QSAR modeling and validationAmazingly, a significant improvement (Fig. 2) in the values of R2 and Q2 for the training set was observed by including DCW. On that note, different 2D-QSAR models were built by including the single optimal descriptor. Models with best R2 values for validation set were preferred for activity prediction. The QSAR equations of one-, two-, and three-descriptor models for best one-, two-, and three-descriptor models are reported in Table 1. The validated internal and external parameters for the best three models are represented in Tables 2 and 3, respectively. Table 4 represents statistical parameters for models M-1, M-2, and M-3.
Fig. 2
Impact of inclusion of DCW on R2 and Q2 for M-1 training set
Table 1 Best 2D-QSAR models for PPARϒ receptor inhibitorsTable 2 Parameters for internal validation of best three modelsTable 3 Parameters of external validation for the best three modelsTable 4 Training set statistical parameters for best three modelsAll the models have higher R2m values (˃ 0.5) and lower R2m delta values (< 0.2) indicating stability and robustness. The values of the LOF and Friedman lack of fit (0.0001) [46] and s (0.007 to 0.0087) are very low which ensures that no over fitting is there in the models. Lower values for delta K and Kxx for model M-1 show good co-relation between descriptors and predicted responses with limited errors in computation [47, 48]. High R2 adj values suggest convenient addition of a new descriptor to the model.
Model ID-1 with highest R2 (coefficient of determination) has been evaluated as the best model satisfying the goodness-of-fit criteria and internal validation parameters. The scatter plot (Fig. 3A, B) clearly indicates a linearity in relationship among experimental and predicted values. The correlation between descriptors (x) and activity (y) were plotted with Kxy versus Q2 LMO of the final model (model 1) (Fig. 4) displaying LMO parameter values are close enough to model parameters. It clearly states that the model is robust and stable. Y-scrambling tested the external validation parameters (Fig. 5). As the values of R2Yscr and Q2Yscr are very small, the models are believed to be good models and not the outcome of casual correlations.
Fig. 3
Scatter plot of experimental pIC50 values versus predicted activity; A correlation between values predicted by model equation B correlation between the values calculated by LOO
Fig. 4
Plot of Kxy versus Q2 LMO depicting correlation between computed variables (x) and predicted activity (y)
Fig. 5
Y-scramble plot depicting internal validation parameters
Figure 6A, B shows the William’s plots deciphering applicability domain of generated model (M-1).
Fig. 6
William’s plot for model (M-1) A HAT values vs standard residuals calculated from QSAR model equation; B HAT values versus standard residuals predicted by LOO
Lower leverage values than threshold (h* of 0.135) indicated that the training and test set molecules remained in the applicability domain of selected model as evident from the William’s plot with 6 outliers only. Noticeably graph of insurbia (Fig. 7) resembled William’s plot with same six outliers. This suggested that the selected model was best in terms of predicting experimental response. Additional file 1: Table S3 gives a comparative display of experimental and predicted IC50 values for the dataset compounds.
Fig. 7
It clearly indicates that the descriptors (VE3_Dzp, nHBint6, and DCW) used to generate the best predictive model equation are not overfitting with the lowest LOF (0.0001) and high predictivity (Q2LOO = 0.9894). It was also observed that the performance of model 3 build using a single optimal descriptor DCW was also impressive when compared with model 1. The performance of the models was evaluated by plotting the values of Q2LOO and LOF (Fig. 8).
Fig. 8
Plot of Q2 LOO versus LOF
Predicted IC50 of topiramate–phenolic acid conjugates (TPAC)The leverage values of all the designed molecules were observed to be below threshold leverage value (h* = 0.138) suggesting the good applicability domain of the developed QSAR models. The predicted IC50 values of the designed compounds are displayed in Table 5. The highest inhibitory activity against PPARϒ was obtained for T3. The inhibitory activity reduced with the addition of (–OCH3) groups as evident from the pIC50 values of T4 and T10.
Table 5 Predicted pIC50 values of designed conjugates Mechanistic Interpretation
The designed 2D-QSAR model 1 was used for predicting the biological activity of the designed TPAC. According to the equation, the PPARϒ inhibitory activities are explained by three descriptors of the model equation which positively or negatively contribute to pIC50 values with respect to their regression coefficient values. The first descriptor VE3_Dzp is the logarithmic Randic-like eigenvector-based index from the Barysz matrix/weighted by polarizabilities and represents heteroatoms and multiple bonds in the molecules. The descriptor positively contributed toward the PPARϒ inhibitory potency [49]. In the designed conjugates, the presence of different electronegative atoms increases the polarization of carbon atoms that might increase the inhibition potency.
The next descriptor is nHBint6 which is an E-state descriptor and associated with electro-topological state of hydrogens establishing hydrogen bonds within a path length of six. The descriptor may also define intermolecular interactions having impact on biological and physic-chemical properties. The descriptor has a positive correlation with the pIC50 values [50]. We decipher that the presence of hydroxyl groups in the designed conjugates contributes positively toward the inhibition potencies. Interestingly, the inclusion of DCW (single optimal descriptor) generated best fitting models.
Molecular Docking AnalysisThe open conformation of helix-12 is a prime requirement for co-repressor recruitment. The binding of an agonist to LBD within orthosteric pocket leads to a closed conformation, therefore recruiting co-activators and inducing transcription of PPARγ genes. The important amino acid residues present within the orthosteric pocket are CYS285, SER289, HIS323, TYR327, LYS367, HIS449, and TYR 473, which play a major role in helix-12 folding [51]. Conclusively, it can be suggested that molecules interfering with proper folding of helix 12 around PPARγ-LBD can be defined as PPARγ antagonists [52]. Further, ligands binding to the allosteric site within the PPARγ-LBD do not display any competition with classical agonistic ligands for binding at orthosteric site The amino acid residues present within allosteric acid are GLU259, LYS265, HIS266, ARG288, SER289, GLU295, SER342, GLU343, and LYS367 which significantly interfere with helix-12 folding [21]. Therefore, PPARγ antagonists can be designed according to the helix12-folding inhibition hypothesis.
The binding interactions of the designed conjugates (T1–T10) along with CF, TPM, and GW9662 with crystal structure of PPARƴ (PDB ID: 3VSO) are displayed in Table 6. Among the 10 designed conjugates, T3 shows stable and strong interactions with the receptor. The designed ligand binds to an alternate site/allosteric site within the ligand binding domain of the crystal structure of PPARγ. The intramolecular hydrogen bonding interactions between the allosteric pocket residues (ARG288, CYS285, MET364, and PHE360) and T3 might destabilize the helix-12.
Table 6 Binding affinities and interactions of TPAC with amino acid residuesIt is evident that there are no interactions of T3 with residues that are involved in proper folding of helix-12 (SER289, HIS323, TYR327, LYS367, HIS449, and TYR473) within the orthosteric pocket of PPARγ ligand binding domain. Also, hydrophobic interactions (MET329, ILE326, LEU330, LEU333, TYR327, and CYS285) might displace the helix-12 from position thereby disfavoring transcriptional process (Fig. 10). Moreover, it was interesting to see that the designed conjugate T3 showed stronger interactions with the allosteric pocket residues than the parent pharmacophores (Fig. 9), CF (binding affinity, − 6.1 kcal/mol) and TPM (binding affinity, − 6.9 kcal/mol) respectively. Similarly, T3 formed stronger interactions with the allosteric pocket residues when compared to the irreversible PPARγ antagonist, GW9662 (binding affinity, − 9.0 kcal/mol) (Fig. 9).
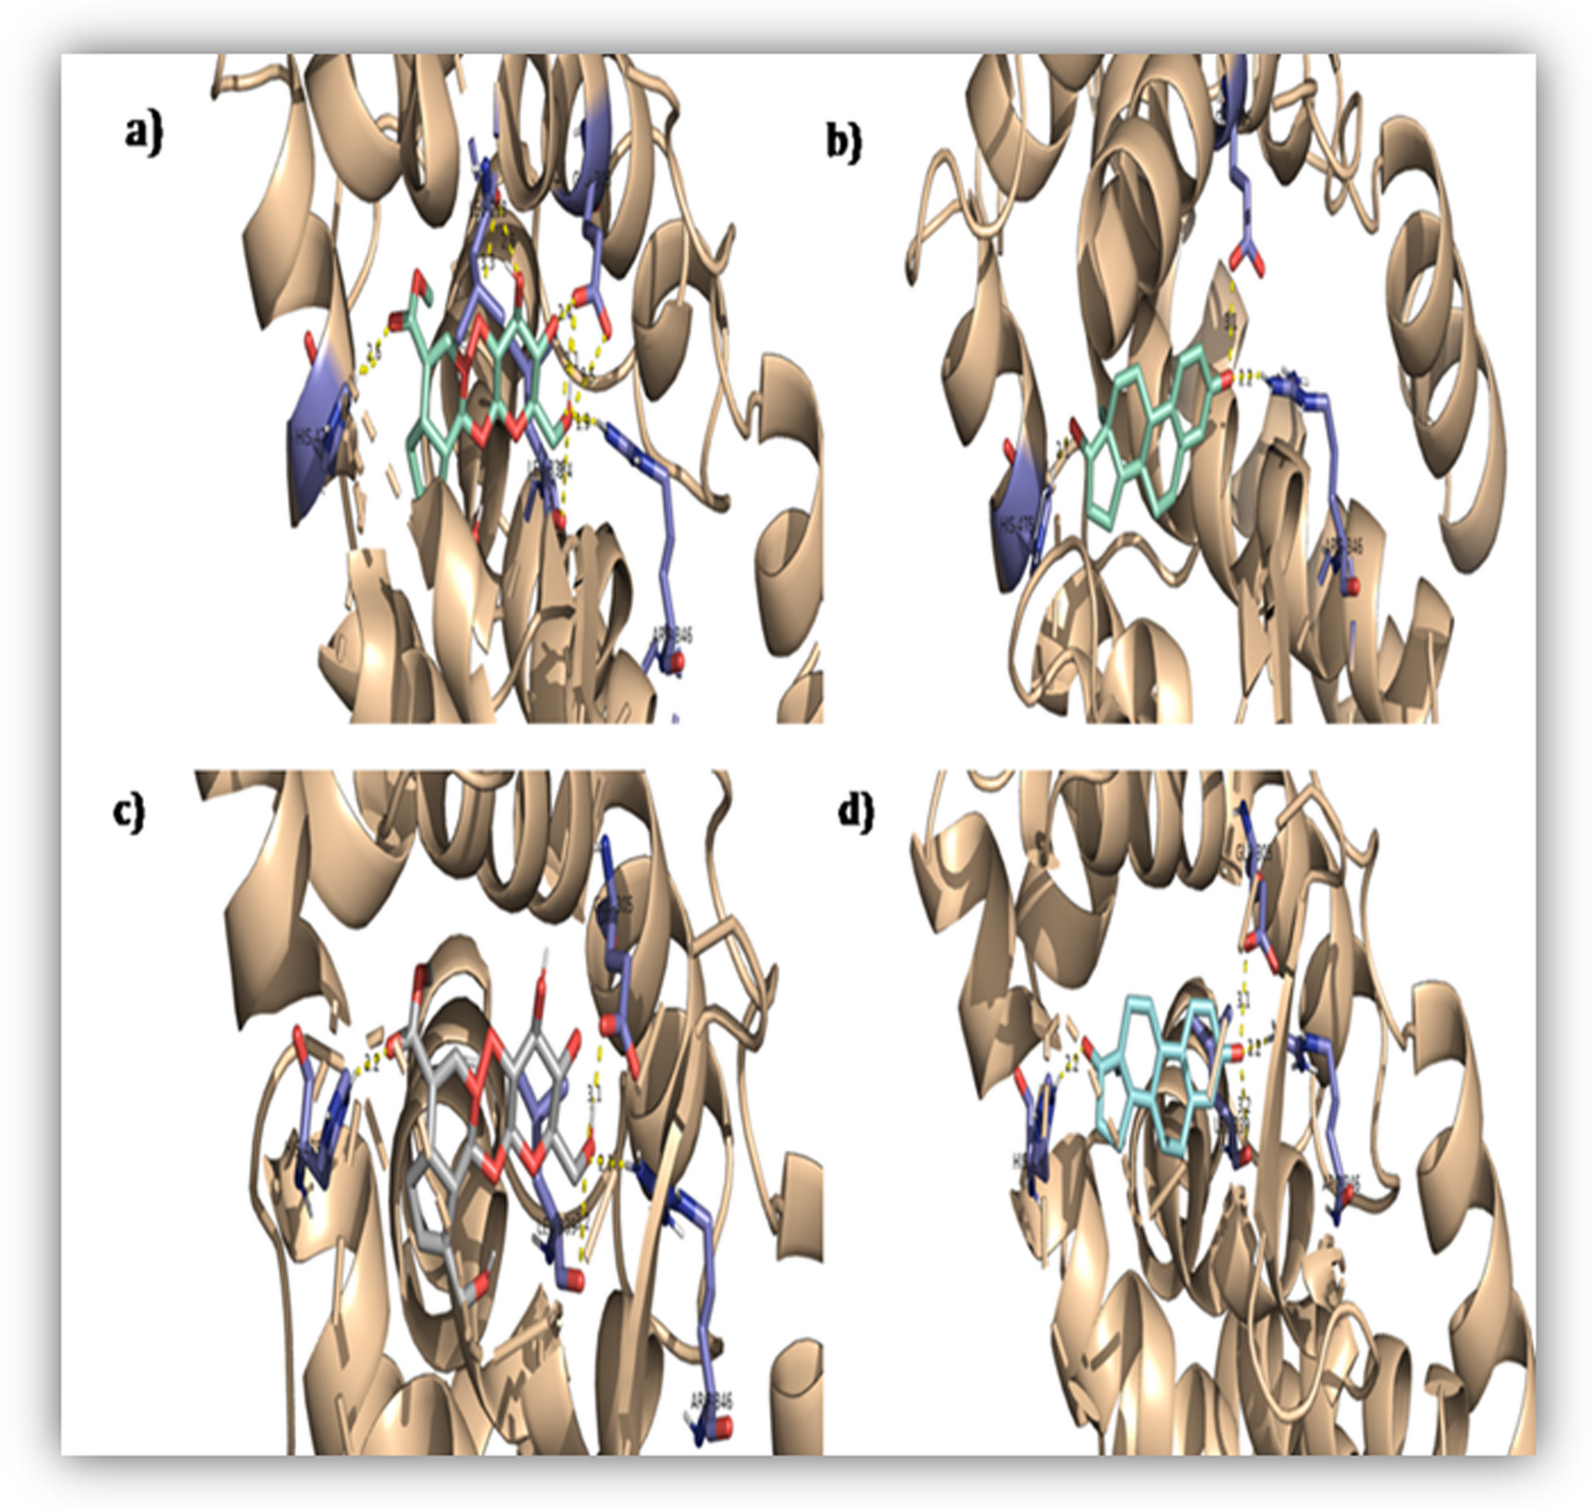
Fig. 9
Binding interactions at allosteric site of PPARγ LBD (PDB ID: 3VSO) with A T3 B CF C TPM D GW9662 (irreversible PPARγ antagonist)
For designing potential PPARγ antagonists, it might be imperative to sustain H-bond interactions with ARG288, SER342, LYS367 and HIS449 within allosteric pocket in the LBD [53]. Moreover, hydrophobic interactions with allosteric site residues PHE282, ILE281, LEU356, TYR327, ILE326, LEU330 and MET348 that can destabilize the H12 contribute to inhibition potency of ligands [44, 54, 55].
Molecular dynamic simulationThe molecular dynamics-based studies revealed the deep understanding of protein ligand interactions over a period of time. The interaction energies of PPARγ-CF complex, PPARγ-TPM complex and PPARγ-T3 complex in a neutralized system are given in Table 7.
Table 7 Dynamic properties of PPARγ-caffeic acid complex, PPARγ-topiramate complex, and PPARγ-T3 complexFrom the above data (Table 7), it was clear that all the protein–ligand complexes were quite stable within the solvent medium. Of all the three PPARγ-ligand complexes, PPARγ-T3 complex exhibited lowest potential energy (Fig. 10). Lower the potential energy, higher are the attractive force between the protein and ligand molecule. It was therefore confirmed that PPARγ-T3 complex was most stable with strong intermolecular attractions (also refer Additional file 1: supplementary data Figs. 1S, 2S, and 3S).
Fig. 10
Decrease in potential energy with respect to time; A PPARγ-CF complex B PPARγ-TPM complex C PPARγ-T3 complex
The complex revealed high fluctuation rate during the MD simulation study as total 0 to 100 ns RMSD (Fig. 11A). Initially at 0 ns the starting point the protein ligand deflected to ~ 4 Å. From 5 nanoseconds onward, the ligand was observed to be high in fluctuation reaching upto a ~ 9 Å with respect to the protein movement. The protein structure was almost a constant at around ~ 3 Å. From 35 nanoseconds to 60 ns and from 61 to nearly 85 nanoseconds, the ligand fluctuation trend was almost similar in a span of 25 nanoseconds where the ligand aroused from ~ 1 Å and going upto ~ 9 Å. Finally, from 85th nanosecond onward the ligand bounded within the protein fluctuation within the range of ~ 0.7 Å to ~ 2.5 Å (Fig. 11A). The PPARγ-TPM complex revealed an acceptable fluctuation rate during the MD simulation study as total 0 to 100 ns RMSD (Refer Additional file 1: Fig. S5 ). Initially, at 0 ns the starting point the protein ligand deflected to ~ 0.35 Å. From 5 nanoseconds onward, the ligand was observed to be high in fluctuation reaching upto a ~ 9 Å with respect to the protein movement. The protein structure was almost a constant at around ~ 0.3 Å. From 0 to 15 ns, it went to ascending order upto ~ 0.3 Å, and 15 ns onward it is constant upto 100 nanoseconds with ~ 0.3 Å. The ligand initially aroused ~ 0. ~ 45 Å by 20 nanoseconds and later constant fluctuation is observed in a range of ~ 0.3 to 0.325 Å till 100 nanoseconds. At the 100 nanosecond, the binding affinity of TPM and PPAR-γ was found out to be − 4.98299e + 05 kJ/mol (Fig. 11B).
Fig. 11
RMSD analysis of PPARγ-ligand complex; A PPARγ-CF complex B PPARγ-TPM complex C PPARγ-T3 complex
Similarly, the PPARγ-T3 complex revealed an acceptable fluctuation rate during the MD simulation study as total 0 to 100 ns RMSD. Initially, at 0 ns the starting point the protein deflected from 0.18 Å to max ~ 0.28 Å and finally settled at ~ 0.25 Å to 100 nanoseconds, whereas the ligand from 0 nanosecond deflected to ~ 0.32 Å and reached upto ~ 0.57 Å at 100 nanoseconds (Fig. 11C).
The root mean square fluctuation (RMSF) calculates mean fluctuations atoms or amino acid residues during the entire MD simulation period. For PPARγ-CF complex, the calculated RMSF for the protein region is a maximum 0.5 Å and the ligand (CF) reached up to 0.15 Å (Fig. 12A). For PPARγ-TPM complex, the calculated RMSF for the protein region is a maximum 0.75 Å and the ligand (TPM) reached up to 0.17 Å (Fig. 12B). Also the calculated RMSF for the protein region (PPARγ-T3 complex) is a maximum 0.75 Å and the ligand (T3) reached up to Å 0.18 (Fig. 12C). The calculated RMSF values below 1 Å reveal no higher fluctuations within the atoms of the complexes, suggesting that all the PPARγ-ligand complexes were stable.
Fig. 12
RMSF analysis of PPARγ-ligand complex; A PPARγ-CF complex B PPARγ-TPM complex C PPARγ-T3 complex
Rg (radius of gyration) analysis explains the extent of unfolding and folding of the protein–ligand complex during entire MD simulation. The compactness of protein and bound ligand can be defined by Rg. High Rg values indicate lower compactness of proteins and ligand thereby suggesting poorly bound complex and vice versa. Here in PPARγ-CF complex, the protein PPAR-γ exhibited a maximum of 2 nm and ligand CF exhibited at very low nearly 0.3 nm of fluctuation in Rg (Fig. 13A). In case of PPARγ-TPM complex, the protein PPAR-γ exhibited a maximum 2 nm and TPM exhibited at very low nearly 0.47 nm of fluctuation in Rg (Fig. 13B), while in case of the PPARγ-T3 complex, protein PPAR-γ exhibits a maximum 2 nm and ligand (T3) exhibited at very low as started with 0.5 nm and reduced to 0.2 nm of fluctuation in Rg revealing a highest stability in contrast to the complex (Fig. 13C).
Fig. 13
Radius of gyration data for PPARγ-ligand complex; A PPARγ-CF complex B PPARγ-TPM complex C PPARγ-T3 complex
In the process of drug design, h-bonds play a vital role in absorption, metabolism, and transportation too. The PPAR-γ and CF complex revealed significant change in the bonding parameter, where initially the ligand was interacting within the binding site region 3 and maximum 4 h-bonds. Finally, from the 90 ns to 100 ns the number of h-bonds is only 1 with an energy of − 4.98780e + 05 kJ/mol (Fig. 14 A). TPM was observed to interact within the binding site region with maximum 7 h-bonds at nearly ~ 30 and ~ 70 ns. Finally, from the 80 ns to 100 ns the number of h-bonds is acquainted to 2 and 3 (Fig. 14B). T3 was observed to interact within the with maximum 8 h-bonds at between ~ 20 and ~ 30 ns at 50 ns, and between 75 to 80 ns. At nearly 100 ns, the number of h-bonds is acquainted to 5 and 6 with an energy of − 4.99215e + 05 kJ/mol (Fig. 14 C).
Fig. 14
Hydrogen bond interactions in PPARγ-ligand complex; A PPARγ-CF complex B PPARγ-TPM complex C PPARγ-T3 complex
SASA (solvent of accessible surface area) detects changes in conformations in the protein–ligand complex that can be assessed by water or solvent during entire MD simulation. In our study, the black line/graph indicates the protein in solvent system and red lines graph indicates the protein and ligand complex for the entire length of time period of MD simulation. The overlapping exhibits that there are no or very minor fluctuations and the entire system is stable. However, lower deviation (by 155 nm2) was observed for PPARγ-T3 complex in comparison to PPARγ-CF and PPARγ-TPM complexes with a deviation by 160 nm2 and 165 nm2, respectively (Fig. 16), indicating higher stability of PPARγ-T3 complex (Fig. 15).
Fig. 15
SASA analysis for PPARγ-ligand complexes A Black line—SASA (PPAR-γ) and Redline—SASA for Protein and Ligand (PPARγ-CF); B Black line—SASA (PPAR-γ) and Redline—SASA for Protein and Ligand (PPARγ-TPM); C Black line—SASA (PPAR-γ) and Redline—SASA for Protein and Ligand (PPARγ-T3)
The molecular docking and MD simulations clearly suggested that in contrast to individual pharmacophores the conjugate T3 would strongly bind to allosteric site within the LBD of PPARγ, thereby acting as an antagonist.
ChemistrySynthesis of T3 [3-(3,4-Dihydroxy-phenyl)-acryloyl]-sulfamic acid 2,2,7,7-tetramethyl-tetrahydro-bis[1,3]dioxolo[4,5-b;4′,5′-d]pyran-3a-ylmethyl esterBuff yellowish crystalline solid; Yield (53%); mp (175 °C); IR (KBr, cm−1): 3700 (NH, amide) 3400 (–OH, phenolic) 1353, 1252 (–CH3) 1645–1630 (C=O, amide), 1600–1445 (C–C), 1070 (C–O),1379, 1342 (S=O), 978 (trans alkene); 1H NMR (400 MHz, DMSO-d 6): δ 1.29–1.47 (12H, 1.29(s), 1.34 (s), 1.37 (s), 1.47 (s)), 3.63 (1H, d, J = 7.6 Hz), 3.74 (1H, d, J = 7.6, Hz), 3.98 (2H, d, J = 2.6 Hz)), 4.03 (1H, dd, J = 12.9, 2.6 Hz), 4.25 (1H, dd, J = 12.9, 3.0 Hz), 4.77–4.87 (2H, 4.60 (s), 4.62 (s)), 6.186 (1H, d, J = 15.7 Hz), 6.78 (1H, d, J = 8.4 Hz)), 6.95 (1H, d, J = 1.9 Hz), 7.08 (2H, (dd, J = 8.4, 1.9 Hz), 7.43 (IH, d, J = 15.7 Hz), 7.61 (1H, s). 13 C NMR (100 MHz, DMSO-d 6): δ 26.3–26.4 (4C, 26.3 (s), 26.1 (s), 25.1 (s), 24.2 (s)), 65.4 (1C, s), 60.7 (1C, s), 69.17 (1C, s), 69.9 (1C, s), 70.1 (1C, s), 70.41 (1C, s ), 100.9 (1C, s ), 108.0 (1C, s ), 115.05 (1C, s ), 115.8 (1C, s ), 116.0 (1C, s ), 121.4 (1C, s ), 125.7 (1C, s ), 145.7 (1C, s ), 146.8 (1C, s ), 148.5 (1C, s ), 168.47 (1C, s ).
As depicted in Scheme 1, T3 was synthesized by coupling of topiramate to caffeic acid using DCC and catalytic amount of DMAP. Initially caffeic acid (1 equivalent) and DCC (1.1 equivalent) were dissolved in sufficient of ice cold DMF and stirred for one hour on a magnetic stirrer. The reaction proceeds with formation of acylimminium ion intermediate. DMAP acts as a acyl transfer reagent. After one hour of stirring, topiramate (2 equivalent) dissolved in excess DMF was added to the above reaction mixture and stirred continuously for 48 h. Structure of the synthesized conjugate was characterized using IR, NMR (1H and 13C). In IR spectra characteristic peaks 3700 (NH amide), 3400 (–OH, phenolic) 1353, 1252 (–CH3) 1645–1630 (C=O, amide carbonyl), 1600–1445 (C–C), 1379, 1342 (S=O), and 978 (trans alkene) were confirmed. Further, in 13C NMR spectra carbons of amide carbonyl functionality were confirmed at 167–170 ppm (please refer Additional file 1: Figs. S4 and S5) [56].
Pharmacological studiesEnzyme inhibition assayFor evaluating T3 as a PPARγ inhibitor, TR‐FRET co-activator assay was conducted. Binding of an agonist like rosiglitazone to PPARγ, causes a conformational change around helix 12 in LBD that increases the affinity of co-activator peptide. Upon excitation at 337 nM, energy is transferred to the fluorescein label on co-activator peptide from the europium label, therefore detected as emission. In agonistic mode, the T3 did not display any significant increase in fluorescence emission even at 10 μmol/L. On the other hand, in the antagonist mode, T3 antagonized agonist (rosiglitazone) induced fluorescence responses. From Fig. 16 it is quite evident that both GW9662 (IC50 = 4.49 µM) and T3 (IC50 = 7.45 µM) exhibited dose-dependent inhibition of PPARγ.
Fig. 16
i Dose-dependent inhibitions of PPARγ by GW9662 and T3 ii % PPARγ inhibition T3 relative to GW9662 [data given in terms of mean ± standard deviation (*p < 0.05) at n = 3 experiments]
Effect of T3 on 3T3-L1 preadipocytes viabilityFor examining the cell level toxicity, the 3T3-L1 preadipocytes were treated with range of T3 concentrations (0.001, 0.01, 0.1, 1 and 10 µM) for 72 h and cell viability was assessed by MTT assay. Up to 0.1 µM of T3, no significant reduction in viability with respect to control (untreated) of 3T3-L1 preadipocytes were observed. A reduction in cell viability of about 10% and 20% was observed (Fig. 17) for 1 and 10 µM of T3 (p < 0.05, ANOVA with t-test). Based on the above observations, concentrations below 10 µM (1, 3, 5. 7 and 10) of T3 were selected to evaluate the percentage lipid accumulation. The values for percentage viability of 3T3-L1 preadipocytes are provided (mean ± standard deviation) corresponding to triplicate experiments.
Fig. 17
Effect of T3 on 3T3-L1 preadipocytes [Values presented as mean ± standard deviation (*p < 0.05) at n = 3 experimental repeats]
Effect of T3 on 3T3-L1 lipid accumulation and adipocyte differentiationOil Red O staining method explored the percentage of intracellular lipid accumulation in adipocyte stem cells. A dose-dependent inhibition of 3T3-L1 cells by T3 was observed. From the microscopic examinations it was pretty evident that there is reduction in size and number of 3T3-L1 cells containing larger lipid droplets (indicated in yellow colored arrows) with respect to control group (Fig. 18i). The percentage of fat accumulation was considerably reduced in T3 5–7 µM and highest at 10 µM concentrations (Fig. 18ii), with IC50 calculated as 7.98 µM.
Fig. 18
Effect of T3 on lipid accumulation on 3T3-L1 preadipocytes i (A) control; (B) T3 (5 µM); (B) T3 (10 µM). ii Percentage fat accumulation. All the values are expressed as mean ± SD, at n = 3 biological repeats
Effect of T3 on 3T3-L1 on PPARγ expressionIt was very evident that reduction in lipid accumulation was very significant in the cell groups treated with 10 µM. For evaluating T3 as downregulator of PPARγ expression (master regulator of adipogenesis and differentiation), western blot was performed. T3 (10 µM) significantly decreased PPARγ expression in 3T3-L1 cells in comparison normal control (untreated) and GW9662 (10 µM) as positive control. These results were specific because β-actin levels were not affected (Fig. 19).
留言 (0)