
記住我

Endovascular thrombectomy (EVT) is the gold standard intervention to restore blood flow and reduce morbidity and mortality following large vessel occlusion acute ischemic stroke (AIS).1 To perform EVT safely, conscious sedation (CS) or general anesthesia (GA) is often required. When anesthesiologists are not routinely involved with EVT, CS is usually provided by sedation-trained nurses (STNs) under the supervision of neurointerventionalists, with anesthesiology involvement on an as-required basis.2,3
Before October 2020, sedation management during EVT at Penn State Hershey Medical Center was provided by STNs under the supervision of advanced cardiac life support and moderate sedation certified neurointerventionalists with anesthesia involvement requested only if airway compromise was present or suspected. In October 2020, our institution introduced routine involvement of anesthesia services during EVT.
We conducted a retrospective case note review to compare workflow, intraprocedural hemodynamic management, complications, and outcomes when care during EVT was delivered by STNs with the involvement of anesthesiologists on an as-needed basis with routine involvement of anesthesiologists for all EVT procedures. We hypothesized that routine involvement of an anesthesia team would minimize delays in revascularization, result in fewer peri-procedural complications, and improve EVT outcomes.
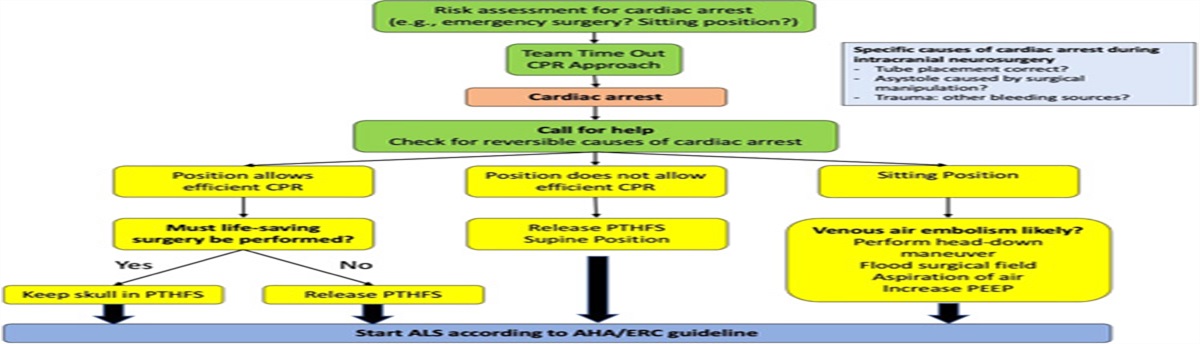
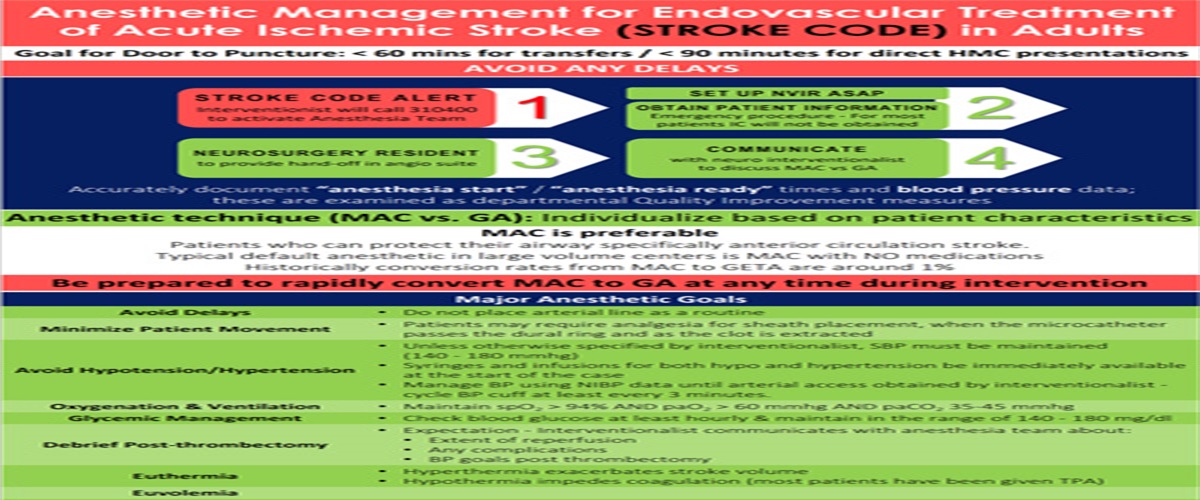
METHODSThis retrospective study was conducted following approval by the Pennsylvania State University institutional review board (#17907; 08/06/2021) with a waiver of informed consent. Penn State Hershey Medical Center is a comprehensive stroke center providing 24/7 access to EVT. In efforts to improve the care for AIS patients, the hospital stroke committee recommended a shift from the ‘as-needed’ involvement of anesthesiologists during EVT to routine utilization of anesthesia services for all EVT cases. Before the implementation of this new policy in October 2020, the project plan was presented to all stakeholders. Suggestions were reviewed, and adjustments were made to the project proposal as appropriate. Multiple presentations and a cognitive aid (Fig. 1) were provided to educate anesthesia personnel on the Society for Neuroscience in Anesthesia and Critical Care guidelines for EVT management.4 These educational efforts focused on the importance of optimizing hemodynamic management and minimizing care delay during EVT.
 FIGURE 1:
 Cognitive aid used to guide for anesthesiologists managing acute ischemic stroke patients during endovascular thrombectomy. BP indicates blood pressure; GA, general anesthesia; GETA, general endotracheal anesthesia; MAC, managed anesthesia care; NIBP, noninvasive blood pressure; paO2 , arterial partial pressure of oxygen; spO2, oxygen saturation.
Patients undergoing EVT between January 1, 2018 and March 31, 2022 were included in this study. Patients having EVT before October 2020, with care provided by STNs with anesthesia involvement as needed, were assigned to the pre-intervention (pre-I) group and those having EVT with routine anesthesia involvement after October 2020 were assigned to the post-intervention (post-I) group. Baseline demographics, workflow variables, intraprocedural hemodynamic data, complications, and outcomes were collected before and after routine anesthesia involvement using procedure logs, sedation, and anesthesia records, and compared between the pre-I and post-I groups. In addition, subgroup analysis was performed to investigate any differences between patients in the pre-I group managed only by STNs (STN group) or with anesthesia input (pre-IA group) and in the post-I group.
Data were presented as the median and interquartile range (IQR) or number (percentage) as appropriate. Unadjusted analyses for comparing groups were conducted as follows: continuous variables and time-to-event variables were analyzed using the Wilcoxon rank sum tests, categorical data were analyzed using Fisher exact test, and ordinal data were analyzed using the Jonckheere-Terpstra trend test. Adjusted analyses for comparing groups were conducted as follows: continuous variables and count variables were analyzed using analysis of covariance, time-to-event variables were analyzed using proportional hazards regression models, and logistic regression models were used for categorical variables. Statistical analysis was performed using SAS Version 9.4 statistical software.
RESULTSTwo hundred thirty-three EVTs were performed between January 2018 and September 2020 and included in the pre-I group, of which 188 patients were managed by STNs under the supervision of neurointerventionalists (STN subgroup) and 45 (19%) were managed by an anesthesia team (pre-IA subgroup). Between October 2020 and March 2022, 149 patients underwent EVT with the routine involvement of anesthesiologists and were included in the post-I group. Baseline demographics and stroke characteristics were comparable between the pre-I and post-I groups, with the exception of a higher rate of direct transfer to angiography suite admissions in the post-I group (30.2% vs. 9.8%; P<0.0001) (Table 1). This workflow paradigm in which suspected large vessel occlusion AIS patients were directly admitted to the angiography suite, bypassing the emergency department and conventional imaging, was recently introduced at Penn State Hershey Medical Center to minimize delays in EVT.
TABLE 1 - Baseline Demographics, Comorbidities, Stroke Characteristics and Stroke Management Pre-intervention (Pre-I group) (n=233)* Post-intervention (Post-I group) (n=149)† P Demographics Age (y) 69 (61, 78) 68 (58, 79) 0.603 Female (%) 111 (47.6) 62 (41.6) 0.292 Body mass index (kg/m2) 28.9 (25.2, 33.3) (n=232) 30.2 (25, 35.1) (n=143) 0.195 Comorbidites (%) Atrial fibrillation 69 (29.6) 44 (29.5) 0.999 Hypertension 158 (67.8) 100 (67.1) 0.911 Hyperlipidemia 105 (45.0) 72 (48.3) 0.599 Diabetes Mellitus 64 (27.4) 50 (33.5) 0.210 HbA1c (%) 5.9 (5.5, 6.5) (n=228) 5.8 (5.5, 6.2) (n=145) 0.716 Hyperglycemia at admission 40 (17.1) 25 (16.7) 0.999 Tobacco 47 (20.1) 34 (22.8) 0.608 Chronic kidney disease 21 (9.0) 8 (5.37) 0.236 Coronary artery disease 59 (25.3) 28 (18.7) 0.169 Prior cerebrovascular accident 37 (15.8) 23 (15.4) 0.999 Pre-EVT beta blocker 99 (42.4) 57 (38.2) 0.455 Pre-EVT statin 82 (35.1) 46 (30.8) 0.437 Stroke characteristics (%) Anterior circulation LVO 217 (93.1) 139 (93.2) 0.999 Posterior circulation LVO 16 (6.8) 10 (6.7) 0.999 Admission NIHSS 16 (11, 20) 16 (10, 21) 0.428 Stroke management (%) IV-TPA 96 (41.9) (n=229) 72 (49.3) (n=146) 0.168 DTAS 23 (9.8) 45 (30.2) <0.0001 GA 36 (15.4) 24 (16.1) 0.886Data presented as median (interquartile range) or number (percentage).
*n=233 in pre-I group unless otherwise indicated.
†n=149 in post-I group unless otherwise indicated.
DTAS indicates direct transfer to angiography suite admission; GA, general anesthesia; Hb, hemoglobin; IV-TPA, intravenous tissue plasminogen activator; LVO, large vessel occlusion; NIHSS, National Institute of Health Stroke Scale score.
A similar proportion of patients received GA in the pre-I and post-I groups overall (15.4% vs. 16.1%, respectively; P=0.886) (Table 1); however, subgroup analysis showed a significantly greater use of GA in the pre-IA (60%) compared with the STN (4.7%; P <0.0001) and post-I (16.7%; P<0.0001) groups (Supplemental Digital Content (SDC) 1: Table showing subgroup analyses, Supplemental Digital Content 1, https://links.lww.com/JNA/A624). Patients in the pre-I group were more likely to receive midazolam for CS compared with those in the post-I group (45.1% vs. 18.4%, respectively; P<0.0001), whereas dexmedetomidine was used more frequently in the post-I group (12.8% vs. 1.02%, respectively; P<0.0001) (SDC 2: Table showing medication use during CS, Supplemental Digital Content 2, https://links.lww.com/JNA/A625).
Systolic blood pressure (SBP)<140 mm Hg (measured noninvasively) for 2 consecutive readings 2.5 minutes apart, lowest SBP, and the number of hypotensive episodes (defined as any SBP<140 mm Hg) were similar in the pre-I and post-I groups (Table 2). However, the subgroup analysis showed that SBP<140 mm Hg for 2 consecutive readings and the number of hypotensive episodes were more common, and the lowest SBP was lower in the pre-IA compared with the other groups (SDC 1: Table showing subgroup analyses, Supplemental Digital Content 1, https://links.lww.com/JNA/A624). There was also no difference in the rates of oxygen desaturation (SpO2<94% requiring non-rebreathing mask or high flow nasal cannula) between the pre-I and post-I groups overall, though subgroup analysis found higher rates of desaturation in the STN subgroup compared with the post-I group (9.4% vs. 3.36%, respectively; P=0.045) (SDC 1: Table showing subgroup analyses, Supplemental Digital Content 1, https://links.lww.com/JNA/A624). Four (1.7%) patients required conversion to GA in the pre-I group compared with none in the post-I group, but this difference was not statistically significant (SDC 2: Table showing medication use during CS, Supplemental Digital Content 2, https://links.lww.com/JNA/A625).
TABLE 2 - Treatment Metrics, Hemodynamic Management, Intraoperative and Postoperative Complications and Outcomes Pre-intervention (Pre-I group) (n=233)* Post-intervention (Post-I group) (n=149)† P Workflow metrics Door-to-arterial puncture time (min) 81 (53, 104) 68 (15.5, 94.5)(n=148) 0.001 In-room to arterial puncture time (min) 15 (9, 21) (n=183) 11 (8, 14) (n=143) <0.0001 Procedure time (min) 60 (40, 88.5) (n=168) 51 (40, 64) (n=129) 0.007 Complications (%) SBP<140 mm Hg for 2 consecutive readings 131 (56.2) 83 (55.7) 0.999 Number of hypotensive episodes 5 (1, 10) 5 (1, 10) 0.889 Lowest SBP (mmHg) 123 (107, 136) 120 (108, 137) 0.617 Procedural complication n (%) 9 (3.8) 8 (5.3) 0.638 Radiographic hemorrhagic conversion 123 (52.8) 61 (40.9) 0.027 Symptomatic hemorrhagic conversion 31 (13.5) 9 (6.0) 0.025 Hemicraniectomy 20 (8.6) 13 (8.7) 1.00 Aspiration pneumonia 15 (6.4) 6 (4.0) 0.365 Outcomes (%) TICI 2b/3 190 (81.5) 124 (83.2) 0.784 mRS ≤2 at 90 d 67 (36.0) (n=186) 45 (37.8) (n=120) 0.808 Mortality during admission 22 (9.4) 12 (8.1) 0.715 Discharge NIHSS 8 (2, 16) 7 (3, 17) 0.926 Hosptial LOS (d) 7 (4, 11) 8 (5, 13) (n=148) 0.043Data presented as median (interquartile range) or number (percentage).
*n=233 in pre-I group unless otherwise indicated.
†n=149 in post-I group unless otherwise indicated.
LOS, length of stay; mRS, modified Rankin score; NIHSS, National Institute of Health Stroke Scale score; SBP, systolic blood pressure; TICI, thrombolysis in cerebral infarction score.
EVT workflow performance metrics are shown in Table 2. Routine involvement of anesthesiologists decreased median door-to-arterial puncture time (68 min; IQR, 15.5–94.5 min vs. 81 min; IQR, 53–104 min; P=0.001), in-room to arterial puncture time (11 min; IQR, 8–14 min vs. 15 min; IQR, 9–21 min; P<0.0001), and procedure time (51 min; IQR, 40–64 min vs. 60 min; IQR, 40–88.5 min; P=0.007). These benefits were maintained in the subgroup analysis as well (SDC 1: Table showing subgroup analyses, Supplemental Digital Content 1, https://links.lww.com/JNA/A624).
Thrombolysis in cerebral infarction scores of 2b/3 and procedural complication rates (extravasation of contrast or perforation of the vessel) were comparable between the two groups (Table 2). There were also no differences in rates of aspiration pneumonia, discharge National Institute of Health Stroke Scale score, in-hospital mortality, or 90-day modified Rankin Score (mRS) ≤2. There were more cases of symptomatic hemorrhagic conversion in the pre-I group than in the post-I group (13.3% vs. 6.04%, respectively; P = 0.025), with similar rates of hemicraniectomy 8.6% vs. 8.7%; P=1.0) (Table 2). Subgroup analysis showed significantly more cases of symptomatic hemorrhagic conversion in the STN group compared with the post-I group (14.3% vs. 6.04%, respectively; P= 0.020) but no difference in the rates of hemicraniectomy (SDC 1: Table showing subgroup analysis, Supplemental Digital Content 1, https://links.lww.com/JNA/A624). In contrast, the median hospital length of stay was significantly longer in the post-I group compared with the pre-I group (8 d; IQR, 5–13 d vs. 7 d; IQR, 4–11 d; P=0.043) (Table 2), but this significance was lost in subgroup analysis (SDC 1: Table showing subgroup analysis, Supplemental Digital Content 1, https://links.lww.com/JNA/A624).
As there were more direct transfers to angiography suite admissions in the post-I group than in the pre-I group, the adjusted statistical analyses included direct angiography suite admissions as the sole regressor for between-group comparison. The adjusted analysis did not change the significance or nonsignificance of the outcome variables shown in Table 2, except for door-to-arterial puncture time, which was not significantly different between groups after adjustment.
DISCUSSIONEvidence to demonstrate the value of routine involvement of anesthesiologists during EVT is limited. A survey of members of the Association for Radiologic and Imaging Nursing found that 20% of respondents preferred having an anesthesia team for sedation management during EVT, 8.6% of respondents were somewhat uncomfortable providing sedation during EVT, and 1.9% were uncomfortable providing sedation; in addition, 8.4% reported that they were not qualified to administer vasoactive infusions.5 A recent editorial advocated for the involvement of anesthesiologists during all EVT procedures.6
In this study, we found improved workflow efficiency in AIS patients having EVT with routine involvement of an anesthesia team compared with sedation provided by STNs with occasional anesthesia involvement; however, there were no differences in 90-day functional outcomes between provider types. A previous study by Slawski et al7 also found no difference in clinical outcomes when CS was provided by STNs or anesthesia personnel during EVT in both a primary stroke center and a comprehensive stroke center. In contrast, our study was conducted in a comprehensive stroke center and included a larger sample.
Even though the treatment window for EVT after AIS has been extended to 24 hours,8 it still calls for no delays in treatment; all cases of acute stroke should be approached emergently. We found that when care was provided by STNs with sporadic involvement of anesthesiologists, treatment times were slower, as indicated by longer door-to-arterial puncture times, in-room-to-arterial puncture times, and procedure times. The new care model where the anesthesia team was requested as soon as the emergency department became aware of the potential arrival of an AIS patient improved these workflow performance measures.
Blood pressure management has been shown to have a significant effect on long-term functional outcomes in AIS patients, including when EVT is performed with CS.9–11 In our study, blood pressure during EVT was similar in the pre-I and post-I groups overall, though the degree of hypotension was greatest in the pre-IA group on subgroup analysis. While this finding might be related to greater use of GA in the pre-IA cohort,12 it could also suggest that routine involvement of anesthesiologists after October 2020 allowed for continuous education, practice, and familiarity with AIS procedures and guidelines, which led to improved hemodynamic management during EVT. This is reflected in a recent observational study where outcomes were improved when care was managed by experienced anesthesia providers, a finding likely related to experienced providers being more aggressive with intraoperative hemodynamic management.13
The frequency of procedural complications in our study was similar to that reported in previous EVT studies;14,15 we found no differences in complication rates across groups. Conversion to GA was infrequent in our study, which is also consistent with the literature.16 When conversion to GA is required, the routine presence of anesthesiologists in the neuro-interventional suite is likely to reduce the time to intubation. In the aforementioned study by Slawski et al,7 4 patients in the STN group required intubation, and the median time from anesthesia notification to intubation was 10 minutes, whereas the procedural delay in the 1 patient requiring intubation in the anesthesia-provider group was 5 minutes. In our study, there were more episodes of desaturation requiring escalation of therapy in patients managed by STNs than in those managed by anesthesiologists. As there were no differences in baseline demographics or stroke characteristics between the 2 groups, this finding was likely related to the choice and dose of sedative medications and suggested that anesthesiologists may be better at managing oxygenation and avoiding hypoxia even during CS.
We found a significantly higher rate of symptomatic hemorrhagic conversion in the pre-I group (inconsistent with previous studies),17 which is likely related to more extensive ischemic damage due to longer door-to-puncture times as a consequence of lower direct transfer to angiography suite admissions in the pre-I group.18 The improved workflow efficiency, better oxygenation, and lower rates of symptomatic hemorrhagic conversion observed after routine involvement of anesthesiologists did not translate into improved 90-day functional outcomes. The rates of 90-day mRS ≤2 in our study are consistent with those previously reported.19,20 However, we found an unexpected increase in hospital length of stay after routine involvement of anesthesiologists overall, but this difference was not evident in subgroup analysis. Further analysis of this finding is beyond the scope of this study.
The major limitation of this study is its retrospective design which makes it prone to missing data from inconsistent reporting, patients lost to follow-up, and inaccuracies arising from the use of paper charts by the STNs. The outcomes are also prone to confounding by improvements in overall stroke care over time. In addition, we did not exclude the initial period following the introduction of routine involvement of anesthesiologists during EVT (when clinical teams were becoming acquainted with the new procedures) from the data analysis, and this could have affected outcomes. Finally, the number of patients in the pre-IA group is small, limiting the detection of differences in the subgroup analysis.
This study provides encouraging preliminary data to advocate the routine involvement of anesthesiologists during EVT across stroke centers. The challenges to implementation of this model are shortage of anesthesia providers, the unpredictability of the demand for this service due to the emergent nature of the procedure, and the absence of centralized nonoperating room anesthesia sites; together, these may all prevent maximizing the capacity of current teams leading to a decrease in overall efficiency. Therefore, successful implementation of routine involvement of anesthesiologists during EVT may require changes in operational management and careful planning by multidisciplinary teams of anesthesiologists, proceduralists, and by clinical and financial managers and hospital administrators.
In conclusion, this study found that routine involvement of anesthesiologists during EVT delivered improved speed and efficiency with greater adherence to guidelines-based physiological parameters. The expertise of anesthesiologists is imperative for the management of these complex patients, particularly as the neurointerventionalist is fully focused on the time-sensitive EVT procedure. An anesthesiologist summoned to an EVT on an ad hoc basis is often far away due to the remoteness of neuro-interventional suite, decreasing the chances of a rapid response. Having anesthesia personnel available from the beginning of and throughout an EVT provides the patient and neurointerventionalist with an optimal scenario; the anesthesiologist is not only capable of providing different levels of sedation but also emergently converting to GA, if necessary, without significantly delaying revascularization.
REFERENCES 1. Powers WJ, Rabinstein AA, Ackerson T, et al. Guidelines for the early management of patients with acute ischemic stroke: a guideline for healthcare professionals from the American Heart Association/American Stroke Association. Stroke. 2018;49:e46–e110. doi:10.1161/STR.0000000000000211 2018. 2. Rasmussen M, Simonsen CZ, Sorensen LH, et al. Anaesthesia practices for endovascular therapy of acute ischaemic stroke: a Nordic survey. Acta Anaesthesiol Scand. 2017;61:885–894. doi: 10.1111/aas.12934 3. Romero Krauchi O, Valencia L, Iturri F, et al. National survey on perioperative anaesthetic management in the endovascular treatment of acute ischaemic stroke. Rev Esp Anestesiol Reanim (Engl Ed). 2018;65:13–23. doi: 10.1016/j.redar.2017.07.005 4. Talke PO, Sharma D, Heyer EJ, et al. Society for Neuroscience in Anesthesiology and Critical Care Expert consensus statement: anesthetic management of endovascular treatment for acute ischemic stroke*: endorsed by the Society of NeuroInterventional Surgery and the Neurocritical Care Society. J Neurosurg Anesthesiol. 2014;26:95–108. doi:10.1097/ANA.0000000000000042. 5. Korzewski M, Raingruber B, Van Leuven K. Procedural sedation/anesthesia protocol among acute ischemic stroke patients undergoing endovascular revascularization procedures: the nursing perspective on what is being practiced nationwide. J Radiol Nurs. 2016;35:12–18. doi: 10.1016/j.jradnu.2016.01.002 6. Milburn JM, Fiorella D, Hirsch JA. Betwixt and between: an idiomatic understanding of anesthesia in stroke intervention. J Neurointerv Surg. 2023;15:411–412. doi: 10.1136/jnis-2023-020364 7. Slawski DE, Salahuddin H, Saju L, et al. Monitored anesthesia care by sedation-trained providers in acute stroke thrombectomy. Front Neurol. 2019;10:296. doi: 10.3389/fneur.2019.00296. 8. Nogueira RG, Jadhav AP, Haussen DC, et al. Thrombectomy 6 to 24 hours after stroke with a mismatch between deficit and infarct. N Engl J Med. 2018;378:11–21. doi: 10.1056/NEJMoa1706442. 9. Petersen NH, Ortega-Gutierrez S, Wang A, et al. Decreases in blood pressure during thrombectomy are associated with larger infarct volumes and worse functional outcome. Stroke. 2019;50:1797–1804. doi: 10.1161/STROKEAHA.118.024286 10. Sharma D. Periprocedure management of blood pressure after acute ischemic stroke. J Neurosurg Anesthesiol. 2023;35:4–9. doi: 10.1097/ANA.0000000000000891 11. Whalin MK, Halenda KM, Haussen DC, et al. Even small decreases in blood pressure during conscious sedation affect clinical outcome after stroke thrombectomy: an analysis of hemodynamic thresholds. AJNR Am J Neuroradiol. 2017;38:294–298. doi: 10.3174/ajnr.A4992. 12. Collette SL, Uyttenboogaart M, Samuels N, et al. Hypotension during endovascular treatment under general anesthesia for acute ischemic stroke. PLoS One. 2021;16:e0249093. doi: 10.1371/journal.pone.0249093 13. Saager L, Ruetzler K, Turan A, et al. Do it often, do it better: association between pairs of experienced subspecialty anesthesia caregivers and postoperative outcomes. a retrospective observational study. Anesth Analg. 2021;132:866–877. doi: 10.1213/ANE.0000000000005318 14. Schonenberger S, Uhlmann L, Hacke W, et al. Effect of conscious sedation vs general anesthesia on early neurological improvement among patients with ischemic stroke undergoing endovascular thrombectomy: a randomized clinical trial. JAMA. 2016;316:1986–1996. doi: 10.1001/jama.2016.16623 15. Lowhagen Henden P, Rentzos A, Karlsson JE, et al. General anesthesia versus conscious sedation for endovascular treatment of acute ischemic stroke: The AnStroke Trial (Anesthesia During Stroke). Stroke. 2017;48:1601–1607. doi: 10.1161/STROKEAHA.117.016554 16. Brinjikji W, Pasternak J, Murad MH, et al. Anesthesia-related outcomes for endovascular stroke revascularization: a systematic review and meta-analysis. Stroke. 2017;48:2784–2791. doi: 10.1161/STROKEAHA.117.017786 17. Tian B, Tian X, Shi Z, et al. Clinical and imaging indicators of hemorrhagic transformation in acute ischemic stroke after endovascular thrombectomy. Stroke. 2022;53:1674–1681. doi: 10.1161/STROKEAHA.121.035425 18. Kaesmacher J, Kaesmacher M, Maegerlein C, et al. Hemorrhagic transformations after thrombectomy: risk factors and clinical relevance. Cerebrovasc Dis. 2017;43:294–304. doi: 10.1159/000460265 19. Wollenweber FA, Tiedt S, Alegiani A, et al. Functional outcome following stroke thrombectomy in clinical practice. Stroke. 2019;50:2500–2506. doi: 10.1161/STROKEAHA.119.026005 20. Jia B, Ren Z, Mokin M, et al. Current status of endovascular treatment for acute large vessel occlusion in China: A Real-World Nationwide Registry. Stroke. 2021;52:1203–1212. doi: 10.1161/STROKEAHA.120.031869
留言 (0)