
記住我


General anesthesia is required for pediatric patients receiving radiotherapy for the treatment of malignancies. In this infrequent scenario, the developing brain is exposed to daily administration of general anesthetics for up to 5 weeks. It is unclear whether repeated exposure to anesthetic drugs induces tolerance which is defined as a decrease in the effect of a drug over time or the need to increase the drug dose to achieve the same effect.1 Tolerance to hypnotic drugs in the pediatric population may have several implications, including considerations for dose adjustment, depth of anesthesia monitoring, risks associated with an increased dose, and potential adverse effects. No previous data have shown the development of tolerance after repeated sevoflurane exposure. There is controversial evidence suggesting the development of tolerance to propofol. Animal models show the development of acute tolerance to the hypnotic effect of propofol2 but in pediatric patients, the findings have been mixed.3–6
Gamma-aminobutyric acid (GABA)A receptor-dependent general anesthetic acts in the central nervous system (CNS) and leads to dose-dependent stereotypical changes in neural oscillations7,8 that can be recorded noninvasively with an electroencephalogram (EEG). Analysis of the EEG in the frequency domain (ie, spectral analysis) is an increasingly popular method to understand the mechanism and effect of anesthetics on the brain.9–11 Pharmacological tolerance, in particular, can be analyzed using EEG as a proxy to measure a drug’s effect on the brain. We expect that by maintaining the hypnotic dose stable across a number of anesthesia sessions, changes observed in the oscillatory activity of the brain can be linked to repeated exposure to the anesthetic. A study that used the bispectral index12 to quantify the effect of propofol on the EEG signal in children receiving repeated propofol administration found evidence for the development of tolerance to propofol.4
The purpose of this study was to determine whether children receiving repeated exposure to sevoflurane across radiotherapy sessions developed a tolerance to sevoflurane. We evaluated the development of tolerance by analyzing spectral features of the EEG signals under anesthesia and by using induction time as a clinical sign surrogate. We hypothesized that if tolerance to sevoflurane develops over time (ie, over consecutive exposures with the same anesthetic dose), the EEG theta power will decrease as a function of radiotherapy sessions, and the induction time will be prolonged.
METHODSWe conducted an observational prospective study between December 16, 2019 and August 26, 2021, at the Instituto Nacional del Cancer, Santiago, Chile. The protocol was registered at ClinicalTrials.gov (NCT04188782, December 6, 2019) and approved by our Institution’s ethics committee on September 3, 2019. As the study was noninterventional and only used data collected from routinely used monitoring devices, the requirement for informed consent was waived by the ethics committee. Pediatric patients older than 1 year and younger than 6 years of age with a cancer diagnosis requiring radiotherapy with general anesthesia were included in the study. Older children were not included as they seldom require general anesthesia for radiotherapy. Exclusion criteria were previous treatment with radiotherapy, the need for propofol during anesthesia induction, and a history of malignant hyperthermia. We report the results following the STROBE guidelines.13
Anesthesia ProtocolChildren received general anesthesia daily until their radiotherapy sessions were completed (from 9 to 35 sessions in total). For clinical reasons, anesthesia management was standardized before the start of this study to sevoflurane as the sole agent for the entire procedure. No subject received premedication. Anesthesia was induced with sevoflurane (8% in oxygen at 4 L/min fresh gas flow) and the airway was secured with a laryngeal mask airway. Anesthesia was maintained with sevoflurane 2.5% and oxygen at 1.5 L/min until the end of the procedure and spontaneous ventilation was maintained throughout. No other medications were administered unless required (eg, ondansetron). Physiological data were obtained from the anesthesia monitors and collected into a database for subsequent analysis. In some cases, a bolus of propofol was required, especially during induction, and children who required propofol were excluded from the analysis.
Electroencephalogram Recording and AnalysisEEG recordings were obtained using a SedLine monitor (Masimo Corporation), with pediatric sensors. EEG data were collected every third session after the first session with children in a supine position. Due to anxiety being common among pediatric patients before the induction of anesthesia, the EEG sensors were affixed after the loss of consciousness. The EEG SedLine monitor display setting was kept stable throughout the entire study (EEG feed 30 mm/s and signal amplitude at 3 μV/mm), thereby avoiding spurious changes in the EEG raw traces exported from the monitor as previously described.14 EEG SedLine data are referenced against the CT electrode, located in the midline of the forehead.
Custom scripts were written using MATLAB (version R2017a, MathWorks) to preprocess and analyze the EEG data. We first selected 120-second epochs in which subjects were clinically unconscious but also with a stable end-tidal sevoflurane concentration of around 2.5%. We visually inspected the EEG spectrogram and raw data to ensure that the analysis windows were free of artifacts, lack of burst suppression or discontinuity events,15 and that EEG dynamics were stable. Among all the possible windows available for the analysis, we selected the last one (closest to emergence but before the discontinuation of sevoflurane administration). The epoch selection process is shown in Supplemental Digital Content 1 (https://links.lww.com/JNA/A651; Schematic representation of the epoch selection process). All analyses were performed using F7 electrode data.
Power spectra and spectrograms were computed for each patient and each session using the multitaper method implemented in the Chronux toolbox.16 The parameters were defined to obtain a frequency resolution of 1 Hz in the 4-second window as described.17 Before the spectral analysis, the signal was band-pass filtered to 0.5 to 40 Hz. From each session spectrum, the relative power at each frequency band18 was calculated as the ratio between the band power and the total power of the signal. Total power was calculated between 1 and 40 Hz. EEG frequency bands were defined as delta (1 to 4 Hz), theta (4 to 8 Hz), alpha (8 to 12 Hz), and beta (12 to 30 Hz) power. The spectral edge frequency 95 (SEF95) of the spectrum between 1 to 40 Hz was also calculated.
For the phase-amplitude modulation analysis, we applied a novel approach that uses state space models of oscillatory time series to estimate the component oscillations of the signal.19 Then, we used a parametric representation of phase-amplitude modulation based on a simple amplitude modulation model that expresses alpha oscillation amplitude as a function of slow oscillation (~0.1 to 1 Hz) phase:
αt=Kmodcos(Φtslow−Φmod).
Where, αt is the instantaneous alpha amplitude,Φtslow is the instantaneous slow oscillation phase, Kmod represents the strength of the modulation, and Φmod represents the preferred slow oscillation phase at which the alpha amplitude is maximal.
OutcomesAs a proxy to estimate the clinical effect of repeated sevoflurane exposure, we defined and measured the induction time for every session. Induction time was defined as the time (in seconds) between the institution of sevoflurane administration and the time to successful placement of the laryngeal mask airway and monitored by independent technicians to prevent bias from anesthetists. For the EEG outcomes, we defined the theta relative power as the primary endpoint given previous evidence suggesting the association of theta power with inhalational anesthetic dose.7 Lastly, we estimated delta, alpha, and beta relative power at each session as secondary outcomes. Nonetheless, the secondary analysis presented is exploratory and we did not correct for multiple comparisons.
Statistical AnalysesData were reported as mean and SD or median and interquartile range (IQR) for continuous variables and as frequencies and percentages for categorical variables. The Shapiro-Wilk test we used to determine whether data were normally distributed. A t test or Mann-Whitney was used for group comparisons depending on the variable distribution. A P value <0.05 was considered statistically significant.
At the individual level (ie, for each subject), the association between the outcome and anesthesia sessions was estimated using simple linear regression. The least squares method was used to fit the models and the F-statistic to reject the null hypothesis. At a group level, a linear mixed-effect model was built with the general form (Eq. 1):
(1)Outcome~1+Session+(1+Session|Subject)+(1|CNS)
The notations in equations 1 to 3 follow the classic representation for mixed-effect models, in which “1” represents the intercept, and each variable within the parenthesis and after the | symbol corresponds to a random-effect variable. The variables that are written before the | symbol correspond to those that are modified by the random-effect variable, either the intercept (notated as “1”) or the slope of the association between the outcome and sessions (in this case notated as “session”).
Sessions of anesthesia were considered a fixed effect, whereas subjects were considered a random effect. Since we were evaluating the effect of anesthetic on the brain, the presence of a brain tumor was considered as another random effect (denoted in the equation as central nervous system [CNS]). In this way, we intended to account for changes in the brain (such as edema or inflammation) that could arise because of the brain tumor or previous brain surgery. For induction time outcomes, the anesthesiologist provider was added as another random-effect variable. We also built a second model for the EEG outcomes that considers the end-tidal sevoflurane (etSevo) concentration associated with the EEG epoch analyzed as a covariate (Eq. 2):
(2)Outcome~1+Session+etSevo+(1+Session|Subject)+(1|CNS)
Next, we aimed to identify the presence of subpopulations in our data set using a Gaussian mixture model based on the slopes of each individual linear regression model. To estimate the latent variable in our model, we used the expectation-maximization algorithm.20 The analysis was performed with the native functions in MATLAB. Then, for the EEG outcomes, we built a third model in which we added a cluster (subpopulation) level as a random-effect variable, which derived from our Gaussian mixture model results (Eq. 3):
(3)Outcome~1+Session+(1+Session|Subject)+(1|CNS)+(Session|Cluster)
Sample Size and Power CalculationBecause patients rarely require general anesthesia during radiotherapy treatment, we intended to include all those who met our inclusion criteria during an 18-month period. Based on our historical volume of patients, we expected to enroll 20 patients over this time period which is similar to the sample sizes reported in previous studies.3,4 If 20 patients are exposed on average to 20 anesthesia sessions, there will be about 400 anesthesia sessions in total. Based on the method proposed by Guan et al,21 this sample size (n~400) would provide a 90% power to demonstrate a linear association between either induction time or EEG theta power and the number of sessions. This power estimation is based on the following assumptions: a level of significance of 0.01, an effect size of 0.2 (corresponding to the determination coefficient in the linear regression model), and an alternative hypothesis, H1, stating that the regression coefficient will be different from zero.
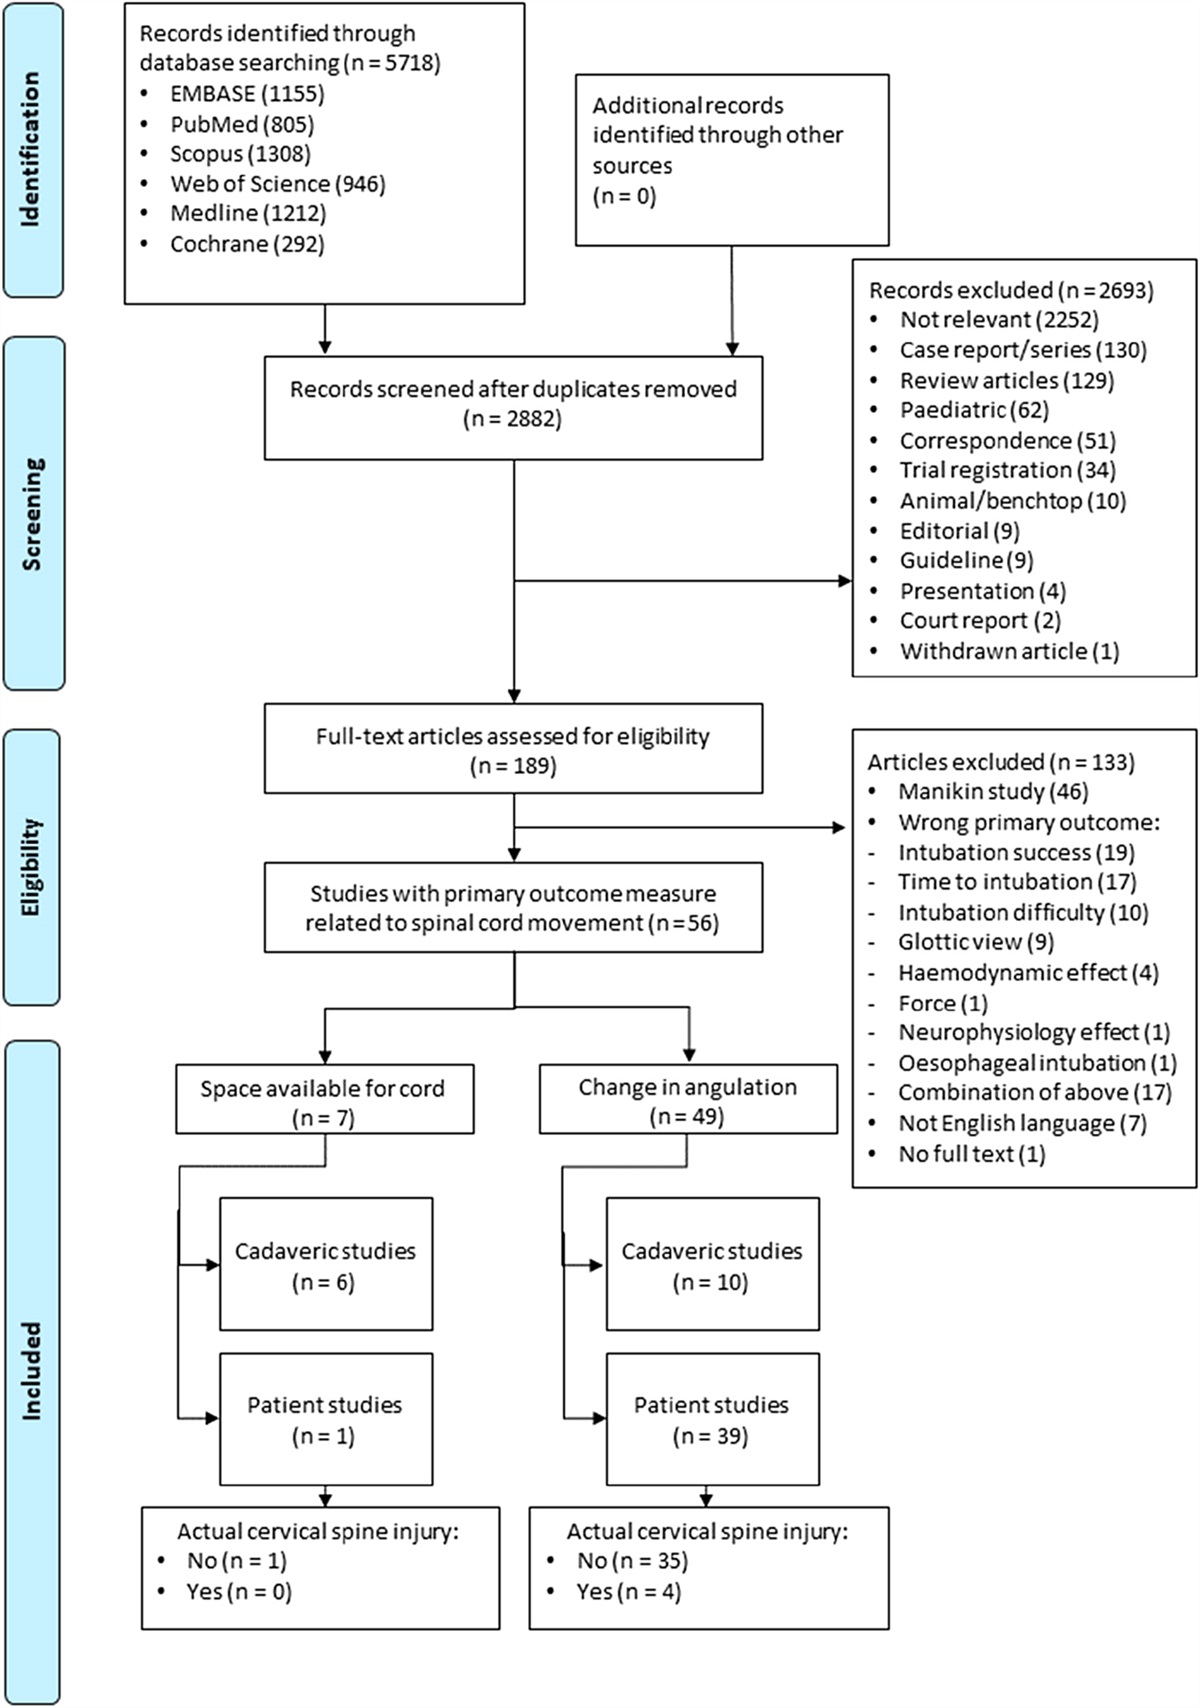
RESULTSAll 22 pediatric patients scheduled for radiotherapy treatment with general anesthesia during the study period and who met our inclusion criteria were initially recruited into the study. Three of these 22 patients were excluded because of a requirement for supplemental propofol during induction of anesthesia and 1 patient subsequently withdrew from treatment for medical reasons. Therefore, 18 children (numbered from 1 to 18) were included in this analysis. The study cohort included 15 females and 3 males aged from 1 to 6 years (median: 3.4; IQR: 2.7 to 4.8 y). Patients' demographics and baseline characteristics are summarized in Table 1. The median number of radiotherapy sessions in our sample was 28 (IQR: 10 to 33), with a total of 402 exposures. The average anesthesia session duration was 19.1 ± 6.2 minutes. Ten patients (55.6%) were treated for brain tumors, and the rest were treated for various non-central nervous system tumors.
TABLE 1 - Patient Demographics and Baseline Characteristics Subject Age (y) Sex Weight (kg) Diagnosis Chemotherapy* No. sessions Duration† (min) 1 5.9 M 22 Leukemia Yes 12 15.7 (4.8) 2 1.9 F 12 Wilms Tumor (lung) Yes 9 19.4 (6.4) 3 3.1 F 21 Wilms Tumor (abdominal) Yes 8 28.6 (6.6) 4 6.0 F 24 Wilms Tumor (abdominal) Yes 10 19.5 (6.7) 5 2.0 F 10 Ependymoma No 25 21.4 (6.4) 6 5.9 M 21 Glioblastoma No 29 19.2 (5.0) 7 3.0 F 14 Ependymoma No 29 17.4 (4.4) 8 2.7 F 18 Ependymoma Yes 32 17.6 (4.2) 9 1.1 F 10 Ependymoma No 30 19.8 (5.7) 10 2.5 F 16 Leukemia Yes 17 19.1 (4.6) 11 3.7 F 19 Leukemia Yes 8 16.6 (6.0) 12 2.8 M 16 Ependymoma No 33 19.8 (5.8) 13 4.8 F 15 Wilms Tumor (kidney) No 8 21.7 (6.6) 14 5.1 F 22 Leukemia Yes 8 18.9 (5.0) 15 3.1 F 15 Ependymoma Yes 32 18.0 (2.9) 16 5.2 F 16 Ewing’s sarcoma Yes 30 18.6 (4.1) 17 4.6 F 17 Medulloblastoma No 31 26.3 (8.6) 18 4.8 F 27 Osteochondroma (skull) No 31 18.6 (4.1)*Administrated concurrently with the radiotherapy.
†Average (SD) session duration.
The anesthesia sessions are the exposure (fixed) variable in our models. First, we evaluated the association between induction time and anesthesia sessions throughout radiotherapy treatments. The mixed-effect model showed no correlation between induction time and session of anesthesia (Table 2, clinical outcome model). This was corroborated both at the individual level (P = 0.08 to 0.96) and also at the group level (coefficient estimate, −0.6633; R2, 0.32; P = 0.27). Individual and group models are shown in Supplemental Digital Content 2, (https://links.lww.com/JNA/A652; figure showing details of the models used in the induction time analysis).
TABLE 2 - Linear Mixed-effect Models Fixed coefficient estimate SE tStat P 95% CI R 2 Clinical outcome*CNS denotes the inclusion of the presence of a brain tumor as a random effect in the model.
With respect to the equation:αt=Kmodcos(Φtslow−Φmod
),αt
is the instantaneous alpha amplitude,Φtslow
is the instantaneous slow oscillation phase,Kmod
represents the strength of the modulation, and Φmod represents the preferred slow oscillation phase at which the alpha amplitude is maximal; the variablesKmod
and Φmod are assessed in model 3.CNS indicates central nervous system; etSevo, end-tidal sevoflurane concentration; SEF95, spectral edge frequency 95.
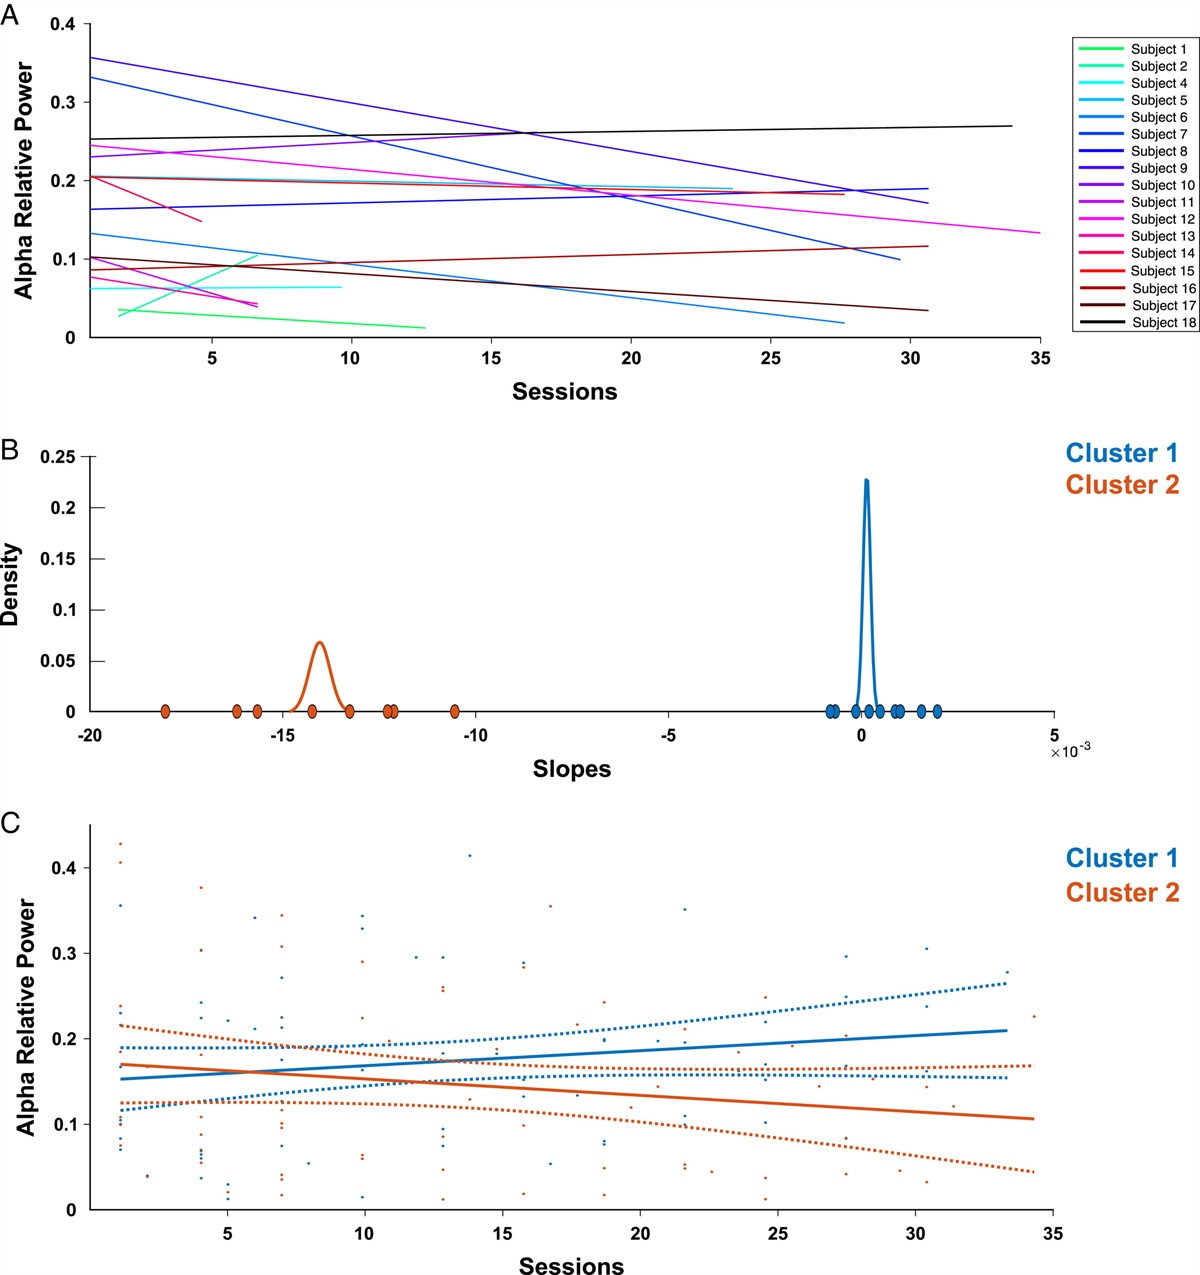
For the EEG analysis, we analyzed a total of 134 epochs that, on average, were selected 14.8 ± 4.0 minutes after the beginning of the EEG recording. This time coincided with the point at which the end-tidal sevoflurane concentration became quasi-stable (Supplemental Digital Content 3, https://links.lww.com/JNA/A653, figure showing the time at which the analyzed EEG epochs were selected). The first mixed-effect model (Eq. 1) indicated that both the alpha relative power (coefficient estimate, −0.0019; R2, 0.57; P = 0.03) and SEF95 (coefficient estimate: −0.1155; R2, 0.79; P = 0.02) were inversely correlated with the number of anesthesia sessions (Table 2, electroencephalographic outcome model 1). To further evaluate this association, we modeled individual subjects with simple linear regression and found that only a subgroup of patients exhibited an inverse correlation between the alpha relative power and anesthesia sessions; 8 out of 18 patients showed a P value <0.05, with coefficient estimates ranging from −0.002 to −0.001 (Fig. 1A). Similar findings were observed for SEF95. When end-tidal sevoflurane recorded before the EEG epoch analyzed in the model was included (Eq. 2), the negative correlation between both alpha relative power and SEF95, and anesthesia sessions remained (Table 2, electroencephalographic outcome model 2). However, there was no significant correlation between the end-tidal sevoflurane concentration and the EEG outcomes.
 FIGURE 1:
 Electroencephalogram (EEG) alpha relative power across sessions. A, Alpha relative power linear model for each individual subject. One patient (ID 3) was excluded as one of the 3 recorded sessions had only electrical noise. B, Slopes for each individual subject linear model for alpha power were clustered using a Gaussian mixture model and an expectation maximization algorithm. C, Group-level linear model for each cluster. Cluster 1 (blue) represents those patients with a slope close to 0 and cluster 2 (orange) represents those patients with a negative slope.
To improve the linear mixed-effects model, we used a Gaussian mixture model to characterize the subgroups of patients that showed an association at the individual level (Fig. 1B). The data set was composed of 2 subpopulations identified by their estimated individual slope (Fig. 1B, C). One group (cluster 1) had a mean slope close to zero, whereas the other group (cluster 2) showed a negative slope in agreement with the inverse correlation between the alpha relative power and anesthesia sessions. After implementing the cluster variable as a random effect in the second mixed-effect model (Eq. 3), the correlation between the alpha relative power and anesthesia sessions remained negative (coefficient estimate: −0.0018; R2, 0.57; P = 0.03) (Table 2, electroencephalographic outcome model 2), and no other EEG band was significantly correlated with repeated exposure to sevoflurane. The third model that included the Gaussian mixture model-derived cluster variable performed better than the 2 original models, as measured by the Akaike information criterion and Bayesian information criterion, whereas the second model (that included end-tidal sevoflurane concentration) performed better based on the log-likelihood and P value (Supplemental Digital Content 4, table comparing the 3 models, https://links.lww.com/JNA/A654). There were no differences in the clinical characteristics of patients in the 2 clusters (Supplemental Digital Content 5, table comparing demographics between the two clusters, https://links.lww.com/JNA/A655) and both groups exhibited similar alpha relative power at the first session (cluster 1 median: 0.10; IQR: 0.08 to 0.22 vs cluster 2 median: 0.14; IQR: 0.08 to 0.36; P = 0.61; Fig. 2). Consistent with the results of the mixed-effect model, the median alpha relative power in the last treatment session was higher in cluster 1 (median: 0.21; IQR: 0.14 to 0.29) compared with cluster 2 (median: 0.04; IQR: 0.03 to 0.12; P = 0.004; Fig. 2). There were no differences in the median end-tidal sevoflurane concentration between the two clusters or throughout the sessions (Supplemental Digital Content 6, figure showing the average sevoflurane concentration in both clusters, https://links.lww.com/JNA/A656), or in the average induction times between the groups (cluster 1: 192 ± 61 s vs cluster 2, 192 ± 58 s; P = 0.72).
 FIGURE 2:
 EEG alpha relative power comparison between clusters in the first and last treatment sessions Median and interquartile range alpha relative power for cluster 1 (blue) and cluster 2 (orange) is displayed. Note the alpha drop in cluster 2 and the absence of an alpha drop in cluster 1. Pair comparisons were performed with the Mann-Whitney test. *P < 0.05 and **P < 0.01.
A reduction in the alpha relative power is noticeable on the EEG spectrograms in some subjects from each cluster. Example EEG spectrograms across sessions from a subject in cluster 2 exposed to 28 radiotherapy sessions and from a subject in cluster 1 exposed to 34 sessions are shown in Figure 3. Despite some variability from session to session, the alpha power in the subject from cluster 2 was reduced, whereas the alpha power in the subject from cluster 1 was sustained across sessions. The spectrograms from each subject in cluster 1 are presented in Supplemental Digital Content 7 (https://links.lww.com/JNA/A657, figure showing individual spectrograms from patients in cluster [1]) and those for subjects in cluster 2 in Supplemental Digital Content 8 (https://links.lww.com/JNA/A658, figure showing individual spectrograms from patients in cluster [2]). Overall, they reveal similar qualitative properties.
 FIGURE 3:
 Spectrogram of 2 representative cases from each cluster. ID 6: a patient from cluster 2 (alpha drop) was exposed to 28 radiotherapy sessions. From session 15 is evident the reduction in the alpha power is evident from session 15 and even more pronounced around session 23. ID 18: a patient from cluster 1 (no alpha drop) was exposed to 34 sessions without a clear change in alpha power. Both spectrograms depict power from 1 to 30 Hz at sessions; the color scale is in decibels.
To elucidate whether the reduction in the alpha power was a manifestation of a deeper anesthesia state, we computed the phase amplitude modulation between slow and alpha oscillations. The mixed-effect model showed no association between either Kmod or Φmod and sessions of anesthesia (Table 2, electroencephalographic outcome model [3]).
DISCUSSIONWe investigated the effects of repeated exposure of children to sevoflurane in 2 ways—the clinical outcome, represented by induction time, and the electrophysiological outcome, assessed as the EEG power spectrum. Induction time remained constant across sevoflurane exposure repetition, despite patients being exposed to up to 33 sessions on consecutive days. This indicates that, at the group level, children did not develop tolerance to sevoflurane when administered repeatedly. We reasoned that the development of tolerance would translate to a prolongation of the induction time, but our analysis showed that the induction time remained constant across sessions. Nonetheless, we acknowledge that several factors, such as comorbidities, intersubject variability, and the anesthesia provider’s experience and preference, may have influenced induction times. Another potential explanation is that using 8% for induction would hide subtle changes in response to the drug because of the large concentration administered. For the electrophysiological outcome, we observed a reduction in alpha-band power only in a subgroup of patients. Overall, we interpret these results to suggest that repeated exposure to sevoflurane does not lead to the development of tolerance.
In a cohort of pediatric patients with hematologic malignancies, a previous study found that the induction dose of propofol had to be increased over time.6 An obvious difference between that study and ours is that it evaluated propofol dose as the endpoint to evaluate tolerance, instead of evaluating a change in effect as we did in our study. In addition, the propofol dose was determined by the anesthesiologist in the previous study and this might have been influenced by several factors, such as provider experience or personal preference (eg, combining propofol with other sedative drugs). In addition, sedation was required for different procedures making it difficult to standardize the sedative requirements. Hence, we cannot consider the results of that study to be entirely comparable to ours. Two other studies evaluated hypnotic (propofol) tolerance in the same setting as ours and neither demonstrated changes that support the development of tolerance to propofol.3,4 In one of those studies, by Keidan et al,4 physiological and clinical parameters, as well as bispectral index, were evaluated to assess the development of tolerance. There were random fluctuations in bispectral index throughout the sessions, indicating that tolerance did not develop in children undergoing repeated exposure to propofol.
Radiotherapy under general anesthesia or deep sedation offers a unique opportunity to evaluate the effect of repeated anesthetic administration with sessions occurring every day for up to 5 weeks. In addition, contrary to surgical scenarios, no injury is associated with the treatment. Also, the protocol in our study was based on the sole administration of sevoflurane which allowed evaluation of the effect of that specific drug without confounding by other drugs used in the operating room. Likewise, the absence of a surgical stimulus enabled us to use a fixed anesthetic dose which was the minimal necessary to avoid movements during a radiotherapy procedure that is not painful.22 In summary, our protocol was an exceptional scenario in which patients were subjected to repeated anesthetic exposures that modified neuronal activity and brain state over a relatively short period of time23 without the bias of surgical injury.
留言 (0)