Ethical approval and mouse model
8-week-old female C57BL/6 mice were obtained from the Vital River company (Beijing, China). Mgl2DTR mice were obtained from the Jackson Laboratory. Animals were bred and maintained under specific pathogen-free conditions. All procedures were conformed to the ARRIVE guidelines 2.0 and approved by the Animal Care and Use Committee of Shandong First Medical University & Medical Science Technology Innovation Center and Wuhan University, China (MLIC2021175).
As previously described, a bacterially retentive 5-0 silk ligature was installed between the first and second molars for inducing periodontitis.45 The contralateral side in each mouse was left untreated to serve as the control for bone loss calculation and baseline for other related assays. To explore the bone formation during the resolving phase of periodontitis, ligatures were removed on day 8 and the mice were monitored and analyzed for another 3, 6, and 10 days (denoted as 3DR, 6DR, 10DR). While in the other queue, ligatures remained in place for 8, 11, 14, and 18 days (denoted as 8DL, 11DL, 14DL, 18DL). At different timepoints, animals were sacrificed for further examinations. To observe the bone healing after CD301b+ macrophages depletion during the resolving phase of periodontitis, 100 μL PBS with or without 500 ng DT was injected intraperitoneally (i.p.) every one to two days per Mgl2DTR mice at certain timepoint.
Micro-computed tomography
Maxillary bones were harvested and fixed in 4% formaldehyde for 24 hours. Then specimens were scanned with the μCT system (SkyScan, Buker). In the reconstructed maxillary, the distance between the cementoenamel junction and alveolar bone crest (CEJ-ABC) was measured on the buccal of the ligated site (the distal buccal root of the first molar and mesial buccal root of the second molar) as previously described.45 To calculate bone loss, the CEJ-ABC distance of each ligated site was subtracted from the CEJ-ABC distance of the contralateral untreated site.46 The alveolar bone between the first and second molars was measured and the parameters of bone loss, BV/TV, Tb.Th., and Tb.Sp. were calculated.
Tissue preparation and histological staining
The fixed maxillae were decalcified for 3 weeks at 4 °C. For frozen sections, the samples were dehydrated in 15%, 30%, and 60% sucrose solution for 12 h at 4 °C respectively and embedded in OCT (Sakura, America), followed by cryosection (8 μm). As for paraffin sections, the periodontal blocks were dehydrated in ethanol and xylene with gradients of different concentrations and then embedded in 5 µm thick paraffin sections. The sections were stained with (1) H&E, (2) and TRAP with the Leukocyte Acid Phosphatase Kit (Sigma-Aldrich). The staining procedures were performed according to the manufacturer’s instructions. Immunostaining was used to detect the expression of CD301b+ macrophages and osteogenic-associated indicators. The primary antibodies were used: rat anti-CD301b (1: 100, Invitrogen, Cat No: 14-3011-95), goat anti-CD206 (1: 200, R&D Systems, Cat No: AF2535), goat anti-ALP (1: 200, R&D Systems, Cat No: AF2910), rabbit anti-OSX (1: 200, Abcam, Cat No: ab22552), mouse anti-IL-1β (1: 200, CST, Cat No: 12242), rabbit anti-TNF-α (1: 200, CST, Cat No: 3707). For immunohistochemistry, the sections were incubated with the secondary antibody and immersed in a DAB solution for coloration, followed by counterstaining with hematoxylin. For immunofluorescence, slides were incubated with secondary fluorescent antibodies (1:200, Invitrogen) and DAPI. Slides were observed and captured using the orthographic microscope (Olympus, Japan). The percentage of positive area was analyzed by ImageJ software.
CD301b+ macrophage induction in vitro
BMDMs were extracted from the femur and tibia bone marrow of C57BL/6 mice. Bone marrow cells were plated and cultured in the presence of recombinant murine macrophage colony-stimulating factor (M-CSF; 20 ng·mL−1, PeproTech). Five days later, the mature BMDMs were eligible for subsequent experiments. BMDMs were stimulated with IL-4 (20 ng·mL−1, PeproTech) for 24 h. The induction efficiency of CD301b+ macrophages was determined by flow Cytometry. To detect the effect of an inflammatory environment on the induction of CD301b+ macrophages, CD301b+ macrophages were detected by immunofluorescence staining after co-incubation with IL-4 in the presence of IL-1β (20 ng·mL−1, PeproTech) and TNF-α (20 ng·mL−1, PeproTech).
Flow cytometry and sorting
Given the small amount of periodontal soft tissue, gingival tissue from 3 mice taken at the same timepoint was pooled and analyzed as one sample. Excised periodontal tissues were minced and digested with RPMI-1640 containing collagenase II (2 mg·mL−1, Thermo Fisher Scientific Inc.) and collagenase IV (2 mg·mL−1, Thermo Fisher Scientific Inc.) for 1 h, then single-cell suspensions were obtained. The antibodies used were CD16/CD32 (1:200, BD Biosciences, Clone: 2.4G2), CD45-APC/Cyanine7 (1:400, Biolegend, Cat No. 103116), CD11b-Pacific Blue (1:200, Biolegend, Cat No. 101223), F4/80-APC (1:400, Biolegend, Cat No. 123115), CD301b-PE (1:200, Biolegend, Cat No. 146803), CD206-FITC (1:200, Biolegend, Cat No. 141703), and Ly6C-PE/Cyanine7 (1:400, Biolegend, Cat No. 128017). Cell viability was determined with Fixable Viability Stain 510 (1:500, BD Biosciences, Cat No. 564406). Flow cytometry analysis of stained cells was conducted using an LSR FortessaX20 (BD, USA).
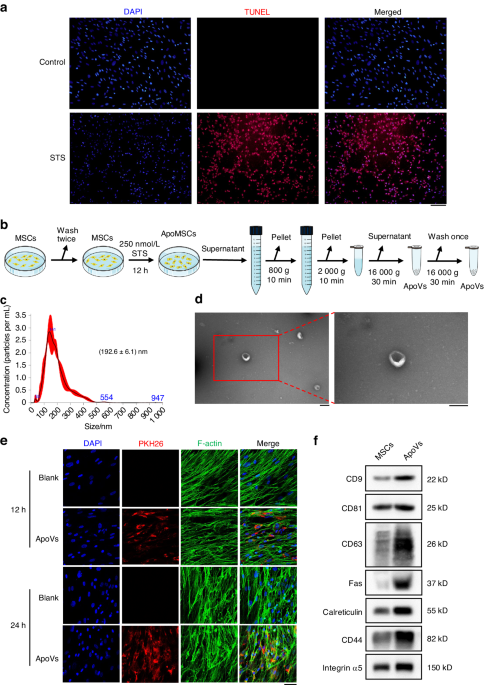
For periodontal macrophage sorting, periodontal tissue acquired from 6DR models was processed in accordance with the above-described procedure, and CD301b- macrophages and CD301b+ macrophages were sorted using a FACS Aria II (BD Bioscience). Cells (n = 2 replicates per group) were collected in 1.5-mL centrifuge tubes for SMART RNA sequencing. For in vitro CD301b+ macrophage sorting, after 24 hours of IL-4 induction (20 ng·mL−1, PeproTech), BMDMs were harvested and prepared as single-cell suspensions. Similar to periodontal macrophage sorting, BMDM-derived CD301b− macrophages and CD301b+ macrophages were obtained and cultured in α-MEM complete medium, and the supernatant was collected every two days for a total of four days as CM for inducing mineralization. CM derived from untreated BMDMs served as the M0 control group.
Osteogenesis assays
BMSCs were obtained from the femur and tibia bone marrow of C57BL/6 mice. BMSCs at passage three were utilized for osteogenic mineralization assay. To verify the role of CD301b+ macrophages on osteogenesis, BMSCs were co-cultured with CM derived from different macrophage subtypes at the dilution ratio of 1:1 for osteogenic differentiation assay. The total RNA of BMSCs was extracted, and the osteogenic gene (alp, runx2, col1) expression was detected on day 7. ALP staining (Beyotime Biotechnology) and alizarin red staining (Sigma Aldrich) were performed according to the instructions on day 7 and day 14, respectively. Stained cells were observed and imaged using an optical microscope.
RNA sequencing and quantitative real-time PCR
At 6DR, CD301b- and CD301b+ macrophages were sorted from periodontal tissues and collected for SMART RNA sequencing (Illumina, USA). Expression levels were calculated using RSEM (v.1.3.1). Differential expression analysis was performed using DESeq2 (v.1.4.5). For all upregulated and downregulated DEGs, GO and GSEA analyses were performed using the free online Dr. TOM II Platform. The top seventy-eight upregulated DEGs associated with the process of osteogenic induction regulation were used for heat map analysis.
To monitor the level of periodontal inflammation, excised gingival tissue was used to extract total RNA in accordance with the instructions of the RNAprep Pure Micro Kit (TIANGEN). For cell experiments in vitro, total RNA was extracted via Trizol reagent in accordance with the manufacturer’s instructions (TAKARA, Japan). The RNA was reverse-transcribed using PrimeScript RT Master Mix (Takara, Japan) in accordance with the manufacturer’s instructions. Real-time PCR with cDNA was performed with a LightCycler 480 Instrument (Roche) using SYBR Green (Takara). Relative target mRNA expression normalized with Gapdh was determined. Data were analyzed using the comparative (2-ΔΔct) method. The primers used are shown in Table 1.
Table 1 Primer sequences used in RT-PCRWestern blot
For the extraction of total protein, 80 μl radio immunoprecipitation assay (RIPA) lysis buffer (Beyotime Biotechnology) containing protease inhibitor and 1% phosphatase inhibitor was used to lyse the cells. All samples were quantified and normalized by a bicinchoninic acid (BCA) protein assay kit (Thermo Fisher Scientific). After heated for 10 min at 95°C, the samples were separated via sodium dodecyl sulfate polyacrylamide gel electrophoresis (SDS-PAGE) and transferred to a polyvinylidene fluoride membrane (Millipore). The membranes were incubated with antibodies against IGF1R (1:1 000, ABclonal), p-IGF1R (1:1 000, ABclonal), Akt (1:1 000, ABclonal), p-Akt (1:1 000, Abcam), mTOR (1:1 000, CST), p-mTOR (1:1 000, CST), GAPDH (1:1 000, ABclonal) at 4 °C overnight, followed by horseradish peroxidase (HRP)-conjugated secondary antibodies (Sigma) treated for 1 h. Blots were visualized by the enhanced chemiluminescence (ECL) HRP Substrate Kit (Thermo Fisher Scientific, US).
Preparation and characterization of OINC
Peripheral blood was collected from lipopolysaccharide-stimulated mice and neutrophils were collected by gradient centrifugation into 15-mL centrifuge tubes as previously described.47 At 4 °C, 35% amp ultrasound was applied for 5 s, then after a 3-s pause the procedure was repeated for 45 min. The suspension was centrifuged at 4 000 r·min−1 for 5 min, then the supernatant was collected and centrifuged at 20 000 g for 30 min in an ultracentrifuge at 4 °C. The supernatant was then collected and centrifuged at 70 000×g for 2 h. The precipitate was resuspended in ultra-pure water and the concentration of membrane protein was detected via a BCA protein assay kit (Thermo Fisher Scientific). AuNC was synthesized and IL-4 was loaded via a phase transition method as previously described,23 and together with extracted mouse neutrophil membranes they were assembled into OINCs by a micro-extruder (Avanti, USA). Transmission electron microscopy (JEM2100, Japan) was used to examine the morphologies of AuNCs and OINCs. Hydrodynamic diameters and zeta potentials were detected by dynamic light scattering. Ultra-violet-visible absorption spectra were observed and recorded by a dual-beam spectrophotometer (TU-1901, China) in the wavelength range of 400–900 nm to detect the absorption peaks of AuNCs and OINCs.
To investigate the in vitro cytotoxicity of AuNCs, RAW264.7 cells were incubated with AuNC solutions of different concentrations (0, 12.5, 25.0, 50.0, and 100.0 μg·mL−1) for 12 h, 24 h, and 48 h. Cell vitality was evaluated with a cell counting kit (CCK-8). To evaluate the capacity of OINCs to control drug release, OINCs were loaded with fluorescein methylene blue (MB) as a model drug, then 1 mL of OINCs was irradiated with a 690-nm wavelength far-red laser for 5 min, repeated 3 times. The irradiation power density was 3.0 W·cm−2. A fluorescence spectrometer was used to monitor the release kinetics of the fluorescein MB. In vitro, the photothermal effects of AuNCs and OINCs were detected using a far-red laser at 3.0 W·cm−2 for 15 min. In vivo, twenty-five microliters of solution containing AuNCs or OINCs was injected into the periodontal tissue between the first and second molars from the buccal and palatal sides, respectively. The normal saline group served as a control, and a 690-nm diode laser system (BWT Beijing Co., Ltd., Beijing, China) was used as an irradiation source (3.0 W·cm−2 power density). The FLIR A65sc test kit (FLIR Systems, Inc. USA) was used for temperature detection and thermal image recording.
Functional verification of AuNCs and OINCs
Western blotting was used to investigate the protein expression of cytokine receptors on OINCs. Mouse neutrophils were collected in RIPA buffer containing protease inhibitor, quantified via a BCA protein assay kit (Thermo Fisher Scientific), and mixed with loading buffer. Neutrophil lysate and OINCs with comparable protein content were loaded into a 10% SDS-PAGE gel, and AuNCs served as a control. IL-1R (1:1 000, Santa Cruz) and TNF-αR (1:1 000, CST) were visualized by the ECL method. To evaluate the neutralization efficiency of OINCs with respect to IL-1β and TNF-α (PeproTech, USA), 100 μL OINCs (membrane protein concentrations 200, 500, and 1 000 μg·mL−1) were incubated with IL-1β (4 ng·mL−1) or TNF-α (4 ng·mL−1). The pellet was removed by centrifugation at 16 000 g for 30 min at 4 °C. Cytokines remaining in the supernatant were detected by ELISA (Bioswamp), and a 100 μL PBS-treated group was served as a control.
To evaluate the osteogenesis-promoting effects of OINCs on periodontitis, periodontitis was induced between the first and second molar of the maxilla in mice. Twenty-five microliters of solution containing AuNCs or OINCs was injected into the periodontal tissue between the first and second molars from the buccal and palatal sides, respectively, and a normal saline group served as a control. All injections in mice were performed under a stereomicroscope. A 690-nm wavelength far-red light was used on the day of injection and for 3 consecutive days thereafter to promote continuous release. To ensure sufficient drug release 4 times, we determined that an adequate time for each in vivo irradiation was 5 min. An additional injection was performed on the 4th day, the irradiation was the same as that utilized previously, and the mice were sacrificed on day 8. Samples were collected for μCT detection and histological examination.
Statistics
Data were represented as means ± SEM of at least three independent experiments. Statistical analysis was performed with GraphPad Prism software (version 8.0). Significant differences were calculated with Student’s t test or by analysis of variance (ANOVA), followed by the Bonferroni post hoc test, for multiple comparisons. P < 0.05 was considered as a statistically significant difference. The symbols *, **, and *** indicate p values < 0.05, 0.01, and 0.001 respectively; ns. not significant.


留言 (0)