


記住我
Conceptualization, C.W. and K.Y.; methodology, W.G., Q.M., X.W. and Z.Z.; software, W.G., Q.M. and Z.Z.; validation, W.G., C.W. and K.Y.; formal analysis, W.G. and C.W.; investigation, K.Y.; resources, W.G., Q.M. and X.W.; data curation, C.W. and K.Y.; writing—original draft preparation, W.G., Q.M., K.Y. and C.W.; writing—review and editing, W.G., Q.M., K.Y. and C.W.; visualization, Q.M. and Z.Z.; supervision, C.W.; project administration, K.Y. and W.G.; funding acquisition, K.Y. and C.W. All authors read and agreed to the published version of the manuscript.
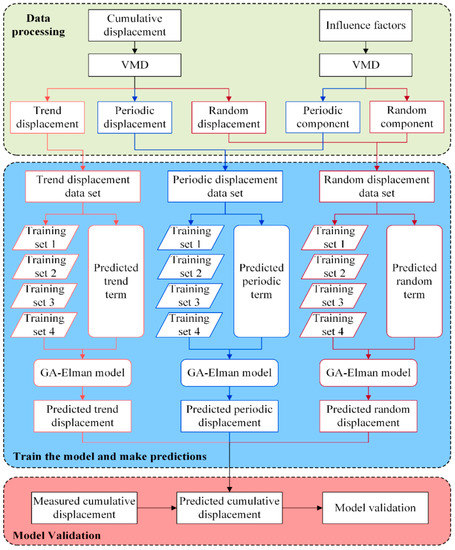
Figure 1. Flowchart of displacement prediction.
Figure 1. Flowchart of displacement prediction.
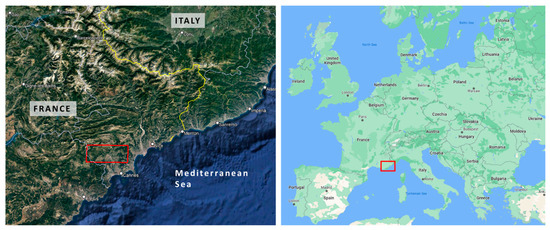
Figure 2. Location of the Shuizhuyuan landslide.
Figure 2. Location of the Shuizhuyuan landslide.
Figure 3. The engineering geological profile of the Shuizhuyuan landslide.
Figure 3. The engineering geological profile of the Shuizhuyuan landslide.
Figure 4. Layout plan of the Shuizhuyuan landslide monitoring network.
Figure 4. Layout plan of the Shuizhuyuan landslide monitoring network.
Figure 5. Precipitation, reservoir water level, and cumulative displacement at the SZY-03 monitoring point of the Shuizhuyuan landslide.
Figure 5. Precipitation, reservoir water level, and cumulative displacement at the SZY-03 monitoring point of the Shuizhuyuan landslide.
Figure 6. Decomposition results of the displacement data after processing.
Figure 6. Decomposition results of the displacement data after processing.
Figure 7. Decomposition results of the influencing factors: (a) decomposition result of P1; (b) decomposition result of P2; (c) decomposition result of P3; (d) decomposition result of P4.
Figure 7. Decomposition results of the influencing factors: (a) decomposition result of P1; (b) decomposition result of P2; (c) decomposition result of P3; (d) decomposition result of P4.
Figure 8. Trend displacement prediction results for different training sets: (a) prediction results of Model 1; (b) prediction results of Model 2; (c) prediction results of Model 3; (d) prediction results of Model 4.
Figure 8. Trend displacement prediction results for different training sets: (a) prediction results of Model 1; (b) prediction results of Model 2; (c) prediction results of Model 3; (d) prediction results of Model 4.
Figure 9. Periodic displacement prediction results of different training sets: (a) prediction results of Model 1; (b) prediction results of Model 2; (c) prediction results of Model 3; (d) prediction results of Model 4.
Figure 9. Periodic displacement prediction results of different training sets: (a) prediction results of Model 1; (b) prediction results of Model 2; (c) prediction results of Model 3; (d) prediction results of Model 4.
Figure 10. Random displacement prediction results of different training sets: (a) prediction results of Model 1; (b) prediction results of Model 2; (c) prediction results of Model 3; (d) prediction results of Model 4.
Figure 10. Random displacement prediction results of different training sets: (a) prediction results of Model 1; (b) prediction results of Model 2; (c) prediction results of Model 3; (d) prediction results of Model 4.
Figure 11. Cumulative displacement prediction results of different training sets: (a) prediction results of Model 1; (b) prediction results of Model 2; (c) prediction results of Model 3; (d) prediction results of Model 4.
Figure 11. Cumulative displacement prediction results of different training sets: (a) prediction results of Model 1; (b) prediction results of Model 2; (c) prediction results of Model 3; (d) prediction results of Model 4.
Figure 12. Cumulative displacement prediction results of the combined model.
Figure 12. Cumulative displacement prediction results of the combined model.
Figure 13. The cumulative displacement prediction results of the validation set.
Figure 13. The cumulative displacement prediction results of the validation set.
Table 1. The training set of the prediction model.
Table 1. The training set of the prediction model.
Model NumberTraining SetTable 2. Analysis of the relational degree between the displacement component and the influence factor component.
Table 2. Analysis of the relational degree between the displacement component and the influence factor component.
Model NumberComponent TypeInfluencing FactorsP1P2P3P4Model 1Periodic component0.57690.57510.57470.5734Random component0.56630.56930.56900.5685Model 2Periodic component0.85050.85090.85070.5349Random component0.97590.59200.97620.9764Model 3Periodic component0.65320.65590.65440.6703Random component0.89160.60570.91940.9139Model 4Periodic component0.62930.63000.62970.6357Random component0.82340.89570.90990.6676Table 3. Evaluation index values of different models in trend displacement.
Table 3. Evaluation index values of different models in trend displacement.
Model NumberEvaluation IndexMAPE (%)MSERMSER2Model 10.30001.02760.69980.6462Model 20.06000.03610.02170.9876Model 30.20000.22790.45290.9215Model 40.54002.05261.25010.2933Table 4. Evaluation index values of different models of periodic displacement.
Table 4. Evaluation index values of different models of periodic displacement.
Model NumberEvaluation IndexMAPE (%)MSERMSER2Model 11.56610.00010.00970.9994Model 210.50000.00660.08110.9611Model 37.99050.00390.06280.9766Model 423.37920.03270.18080.8067Table 5. Evaluation index values of different models of random displacement.
Table 5. Evaluation index values of different models of random displacement.
Model NumberEvaluation IndexMAPE (%)MSERMSER2Model 132.960.00490.06990.8326Model 2112.880.00310.05600.8926Model 333.870.00570.07580.8028Model 413.730.00070.02610.9765Table 6. Evaluation index values of different models for cumulative displacement.
Table 6. Evaluation index values of different models for cumulative displacement.
Model NumberEvaluation IndexMAPE (%)MSERMSER2Model 10.27630.94690.63960.7261Model 20.18830.03770.04690.9891Model 30.25650.37280.59140.8922Model 40.60822.46311.40480.2875Combined model0.16850.03710.03840.9893Table 7. Comparison of the prediction accuracy of different prediction models.
Table 7. Comparison of the prediction accuracy of different prediction models.
Model NameEvaluation IndexMAPE (%)MSERMSER2Elman372.5598.63579.37090.3633GA–Elman153.0423.12813.89040.8507VMD–GA–Elman
留言 (0)