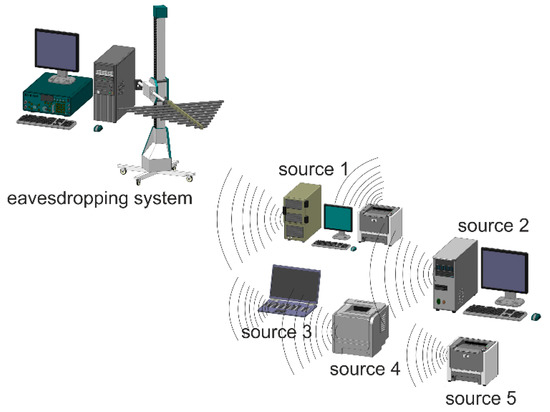
Figure 1.
Surrounding us potential sources of undesirable emissions correlated with the information processed.
Figure 1.
Surrounding us potential sources of undesirable emissions correlated with the information processed.
![Applsci 13 00447 g001]()
Figure 2.
An example of anechoic chamber.
Figure 2.
An example of anechoic chamber.
![Applsci 13 00447 g002]()
Figure 3.
Illustrating the effect of the number lines of image on its content: (a) correct number lines of the image, (b) too few lines of the image, (c) too many lines of the image.
Figure 3.
Illustrating the effect of the number lines of image on its content: (a) correct number lines of the image, (b) too few lines of the image, (c) too many lines of the image.
![Applsci 13 00447 g003]()
Figure 4.
The working scheme of coherent summing of images in electromagnetic infiltration process.
Figure 4.
The working scheme of coherent summing of images in electromagnetic infiltration process.
![Applsci 13 00447 g004]()
Figure 5.
Illustrating the influence of a wrongly determined number lines of image on the result of coherent summation (a summation of two first images): (a) for a small number lines of image, (b) for a large number lines of image.
Figure 5.
Illustrating the influence of a wrongly determined number lines of image on the result of coherent summation (a summation of two first images): (a) for a small number lines of image, (b) for a large number lines of image.
![Applsci 13 00447 g005]()
Figure 6.
Examples of incorrectly determined number of lines of the reconstructed images: (a) too few lines, (b) correct number of lines, (c) too many lines—30-fold summation of the reconstructed image for the revealing emission signal measured at the frequency fo=1334 MHz, band reception BW=50 MHz, primary image displayed in the mode of 1280 × 1024/60 Hz, DVI standard, image in greyscale.
![Applsci 13 00447 g006a]()
![Applsci 13 00447 g006b]()
Figure 7.
Test images used in the analysis of the effectiveness of the proposed measures in the process of determining the correct number of lines of the reproduced image: (a) a photo showing two vehicles (HDMI standard), (b) a three-column text (HDMI standard), (c) three words “protection” written in secure font (VGA standard), (d) menu of multifunctional device.
![Applsci 13 00447 g007]()
Figure 8.
Measuring systems for three different sources of revealing emissions: (a) HDMI and DVI standards, (b) display of laser printers.
Figure 8.
Measuring systems for three different sources of revealing emissions: (a) HDMI and DVI standards, (b) display of laser printers.
![Applsci 13 00447 g008]()
Figure 9.
An algorithm for determining the correct number lines of a reconstructed image.
Figure 9.
An algorithm for determining the correct number lines of a reconstructed image.
![Applsci 13 00447 g009]()
Figure 10.
Image reconstructed (two consecutive realizations of the image) from the recorded revealing signal for: (a) too few image lines, B=730; (b) correct number of image lines, BCorr=806; (c) too many image lines, B=900.
Figure 10.
Image reconstructed (two consecutive realizations of the image) from the recorded revealing signal for: (a) too few image lines, B=730; (b) correct number of image lines, BCorr=806; (c) too many image lines, B=900.
![Applsci 13 00447 g010]() Figure 11.
Figure 11.
Normalized values (in relation to the maximum value) of the variability of measures as a function of the number of image lines, supporting the determination of the correct number of lines of the image reproduced for the source image in the form of a picture from
Figure 7a—HDMI graphic standard, computer monitor operating mode 1280 × 1024/60 Hz, frequency of the reveal emission signal fo=1334 MHz, reception bandwidth BW=50 MHz, correct number of lines BCorr=1066.
![Applsci 13 00447 g011]() Figure 12.
Figure 12.
Images reconstructed from the revealing emission signal measured at the frequency fo=1334 MHz for the number of lines of this image determined in accordance with the criterion of the maximum value of the measures presented in
Figure 11: (
a) the number of image lines determined in accordance with method V (B=1062, the number of lines smaller than required), (
b) number of image lines determined in accordance with methods I, II, III, IV, VI, and VII (BCorr=1066, correct number of lines).
![Applsci 13 00447 g012]() Figure 13.
Figure 13.
Normalized values (in relation to the maximum value) of the variability of measures as a function of the number of image lines, supporting the determination of the correct number of lines of the image reproduced for the source image in the form of a picture from
Figure 7b—HDMI graphic standard, computer monitor operating mode 1280 × 1024/60 Hz, frequency of the reveal emission signal fo=200 MHz, reception bandwidth BW=100 MHz, correct number of lines BCorr=1125.
![Applsci 13 00447 g013]() Figure 14.
Figure 14.
Images reconstructed from the revealing emission signal measured at the frequency fo=200 MHz for the number of lines of this image determined in accordance with the criterion of the maximum value of the measures presented in
Figure 13: (
a) the number of image lines determined in accordance with method V (B=1114, the number of lines smaller than required), (
b) number of image lines determined in accordance with methods I, II, III, IV, VI, and VII (BCorr=1125, correct number of lines).
![Applsci 13 00447 g014]() Figure 15.
Figure 15.
Normalized values (in relation to the maximum value) of the variability of measures as a function of the number of image lines, supporting the determination of the correct number of lines of the image reproduced for the source image in the form of a picture from
Figure 7c—VGA graphic standard, computer monitor operating mode 1024 × 768/60 Hz, frequency of the reveal emission signal fo=558 MHz, reception bandwidth BW=10 MHz, correct number of lines BCorr=806.
![Applsci 13 00447 g015]() Figure 16.
Figure 16.
Images reconstructed from the revealing emission signal measured at the frequency fo=558 MHz, for the number of lines of this image determined in accordance with the criterion of the maximum value of the measures presented in
Figure 15: (
a) the number of image lines determined in accordance with method V (B=803, the number of lines smaller than required), (
b) number of image lines determined in accordance with method II (B=823, the number of lines bigger than required), (
c) number of image lines determined in accordance with method I, III, IV, VI, and VII (BCorr=806, correct number of lines).
![Applsci 13 00447 g016]() Figure 17.
Figure 17.
Normalized values (in relation to the maximum value) of the variability of measures as a function of the number of image lines, supporting the determination of the correct number of lines of the image reproduced for the source image in the form of a picture from
Figure 7d—menu of multifunctional device, frequency of the reveal emission signal fo=235 MHz, reception bandwidth BW=10 MHz, correct number of lines BCorr=288.
![Applsci 13 00447 g017]() Figure 18.
Figure 18.
Images reconstructed from the revealing emission signal measured at the frequency fo=235 MHz, for the number of lines of this image determined in accordance with the criterion of the maximum value of the measures presented in
Figure 17: (
a) the number of image lines determined in accordance with method V (B=273, the number of lines smaller than required), (
b) number of image lines determined in accordance with method I, II, III, IV, VI, and VII (BCorr=288, correct number of lines).
![Applsci 13 00447 g018]()
Figure 19.
Images for which statistical analyses were conducted (images reconstructed on base on reveal emissions for thirty times summation without colorization): (a) DVI standard, receive frequency fo=365 MHz, BW=50 MHz, number lines Bcorr=525, resolution 640 × 480/60 Hz; (b) DVI standard, receive frequency fo=1334 MHz, BW=50 MHz, number lines Bcorr=1066, resolution 1280 × 1024/60 Hz; (c) DVI standard, receive frequency fo=1805 MHz, BW=100 MHz, number lines Bcorr=1066, resolution 1280 × 1024/60 Hz; (d) DVI standard, receive frequency fo=1775 MHz, BW=100 MHz, number lines Bcorr=1125, resolution 1920 × 1080/60 Hz; (e) laser printer HP M507, menu with icons, receive frequency fo=392 MHz, BW=10 MHz, number lines Bcorr=266; (f) VGA standard, receive frequency fo=450 MHz, BW=20 MHz, number lines Bcorr=628, resolution 800 × 600/60 Hz; (g) laser printer, menu with text, receive frequency fo=235 MHz, BW=10 MHz, number lines Bcorr=288; (h) DVI standard, receive frequency fo=740 MHz, BW=50 MHz, number lines Bcorr=628, resolution 1280 × 1024/60 Hz; and (i) display of terminal VoIP, receive frequency fo=800 MHz, BW=20 MHz, number lines Bcorr=528.
![Applsci 13 00447 g019]() Table 1.
Table 1.
Normalized values (in relation to the maximum value) of the variability of measures as a function of the number of image lines, supporting the determination of the correct number of lines of the image reproduced for the source image in the form of a picture from
Figure 7a.
Table 1.
Normalized values (in relation to the maximum value) of the variability of measures as a function of the number of image lines, supporting the determination of the correct number of lines of the image reproduced for the source image in the form of a picture from
Figure 7a.
Number LinesMethod
IMethod
IIMethod
IIIMethod
IVMethod
VMethod
VIMethod
VII10490.481120.663680.120380.376830.996670.319550.7107210500.481100.663680.120210.379140.997150.326500.7133710510.493750.681140.120350.381690.997450.331380.7152110520.506410.707560.119870.382570.997240.332630.7151110530.500080.685530.121180.386100.997350.341760.7196310540.512760.702890.127270.388810.997130.348960.7223010550.500120.694270.121230.389660.997060.345180.7193510560.519130.716070.122940.393260.996530.355040.7236610570.538150.728440.124680.396530.995970.360580.7253910580.531750.733540.123950.400990.996540.369900.7296410590.550560.754960.125600.407550.996930.382650.7366610600.563070.772310.126230.414670.998020.398780.7456510610.569450.776110.125660.421140.998450.412600.7527010620.582290.783560.127310.427370.997670.427340.7596110630.582160.783560.129210.435370.998210.430990.7583710640.600990.794400.133410.445950.999390.445640.7638410650.638900.814940.131970.465661.000000.490050.7904510660.708620.868160.135630.511400.998970.568920.8378510670.765680.912290.144810.584040.999260.663390.8775910680.778410.927370.120760.673890.998640.802810.8861410691.000001.000001.000001.000000.998401.000001.0000010700.784850.929830.119410.672820.998780.801180.8851110710.759550.909720.138530.581230.997780.644580.8652510720.708920.878020.134470.510340.997410.568970.8381510730.639310.824580.131660.465140.997320.492380.7913610740.613990.811120.138340.446510.996880.448400.7663210750.588690.787220.127670.435080.997150.428760.7576710760.626700.808250.128940.428350.996420.431720.7632510770.563400.762720.126680.421040.996550.413780.7534710780.569730.776110.125890.414520.996080.400840.7468010790.557090.758860.125710.408140.995560.384210.7369310800.550760.754960.125540.402800.995550.374150.7325410810.525440.720250.123420.397800.995770.361930.7262810820.525450.711300.123270.394360.995120.355000.7239610830.51278


 Figure 11.
Normalized values (in relation to the maximum value) of the variability of measures as a function of the number of image lines, supporting the determination of the correct number of lines of the image reproduced for the source image in the form of a picture from
Figure 11.
Normalized values (in relation to the maximum value) of the variability of measures as a function of the number of image lines, supporting the determination of the correct number of lines of the image reproduced for the source image in the form of a picture from  Figure 12.
Images reconstructed from the revealing emission signal measured at the frequency fo=1334 MHz for the number of lines of this image determined in accordance with the criterion of the maximum value of the measures presented in
Figure 12.
Images reconstructed from the revealing emission signal measured at the frequency fo=1334 MHz for the number of lines of this image determined in accordance with the criterion of the maximum value of the measures presented in  Figure 13.
Normalized values (in relation to the maximum value) of the variability of measures as a function of the number of image lines, supporting the determination of the correct number of lines of the image reproduced for the source image in the form of a picture from
Figure 13.
Normalized values (in relation to the maximum value) of the variability of measures as a function of the number of image lines, supporting the determination of the correct number of lines of the image reproduced for the source image in the form of a picture from  Figure 14.
Images reconstructed from the revealing emission signal measured at the frequency fo=200 MHz for the number of lines of this image determined in accordance with the criterion of the maximum value of the measures presented in
Figure 14.
Images reconstructed from the revealing emission signal measured at the frequency fo=200 MHz for the number of lines of this image determined in accordance with the criterion of the maximum value of the measures presented in  Figure 15.
Normalized values (in relation to the maximum value) of the variability of measures as a function of the number of image lines, supporting the determination of the correct number of lines of the image reproduced for the source image in the form of a picture from
Figure 15.
Normalized values (in relation to the maximum value) of the variability of measures as a function of the number of image lines, supporting the determination of the correct number of lines of the image reproduced for the source image in the form of a picture from  Figure 16.
Images reconstructed from the revealing emission signal measured at the frequency fo=558 MHz, for the number of lines of this image determined in accordance with the criterion of the maximum value of the measures presented in
Figure 16.
Images reconstructed from the revealing emission signal measured at the frequency fo=558 MHz, for the number of lines of this image determined in accordance with the criterion of the maximum value of the measures presented in  Figure 17.
Normalized values (in relation to the maximum value) of the variability of measures as a function of the number of image lines, supporting the determination of the correct number of lines of the image reproduced for the source image in the form of a picture from
Figure 17.
Normalized values (in relation to the maximum value) of the variability of measures as a function of the number of image lines, supporting the determination of the correct number of lines of the image reproduced for the source image in the form of a picture from  Figure 18.
Images reconstructed from the revealing emission signal measured at the frequency fo=235 MHz, for the number of lines of this image determined in accordance with the criterion of the maximum value of the measures presented in
Figure 18.
Images reconstructed from the revealing emission signal measured at the frequency fo=235 MHz, for the number of lines of this image determined in accordance with the criterion of the maximum value of the measures presented in 
 Table 1.
Normalized values (in relation to the maximum value) of the variability of measures as a function of the number of image lines, supporting the determination of the correct number of lines of the image reproduced for the source image in the form of a picture from
Table 1.
Normalized values (in relation to the maximum value) of the variability of measures as a function of the number of image lines, supporting the determination of the correct number of lines of the image reproduced for the source image in the form of a picture from 
留言 (0)