1. IntroductionUnmanned Aerial Vehicles (UAVs) depend primarily on the Global Navigation Satellite System (GNSS) for precise navigation and positioning, which is necessary for guidance and control during flights. Technical improvements in UAV automation and control have largely increased in the last few decades; however, cybersecurity has received less attention despite many reported cyberattacks. One of the most dangerous threats is Global Positioning System (GPS) spoofing attacks [
1]. This type of attack occurs when a malicious user broadcasts false GPS signals that are difficult to detect [
2,
3]. These attacks significantly affect the targeted UAV receiver, especially because the vehicle may remain unaware of the attack for a prolonged period of time since spoofing gives the attacker virtual control [
4,
5].Numerous studies have been conducted to detect, identify, and mitigate attacks on UAVs.
Table 1 compares existing machine learning techniques with respect to the dataset and model parameters. The authors of [
6] proposed a technique for classifying GPS spoofing attacks using artificial neural networks (ANNs) with a benchmark that includes signal-to-noise ratio, pseudo-range, and Doppler shift. The authors of [
7] proposed using Linear Regression and Long Short-Term Memory to detect GPS spoofing attacks and evaluated their proposed model using time steps and neurons. The authors of [
8] used the least absolute shrinkage and selector operator to detect and classify GPS spoofing attacks on UAVs. The authors of [
9] proposed a k-learning-based approach and evaluated its performance in terms of several k values. An algorithm based on Support Vector Machine (SVM) was proposed by the authors of [
10], who evaluated its performance using the evaluation window and time width. The authors of [
11] proposed a technique, Long Short-Term Memory, using a dataset of features such as flight speed, altitude, and range.The authors of [
12] also applied SVM to detect GPS spoofing attacks by conducting a correlation analysis and evaluating their model based on accuracy. The authors of [
13] used a deep learning (DL)-based method, DeepSIM, to detect GPS spoofing attacks by employing a camera and comparing historical GPS images to incoming GPS images using image processing techniques. The authors of [
14] proposed two dynamic selection approaches based on ten commonly used ML models. The authors of [
2] compared several tree-based ML models, Extreme Gradient Boosting (XGBoost), Random Forest (RF), Gradient Boosting (GBM), and Light Gradient Boosting (LightGBM), to detect GPS spoofing attacks targeting UAVs. The authors performed a correlation analysis and used a benchmark with 13 features. The authors of [
15] analyzed three types of ensemble models to detect GPS spoofing attacks targeting UAVs, including bagging, boosting, and stacking.The authors of [
16] also compared the performance of supervised and unsupervised ML models, namely Gaussian Naïve Bayes, Random Forest, Classification and Regression Decision Tree, Linear-Support Vector Machine, Logistic Regression, Principal Component Analysis, Artificial Neural Network, and Autoencoder, to detect GPS spoofing attacks. Another study [
17] incorporated Support Vector Machine with K-fold cross-validation to detect GPS spoofing attacks on UAVs. The authors of [
18] proposed a semantic-based detection technique, CONSDET, to support onboard GPS spoofing attack detection. The authors of [
19] proposed a resilient state estimation framework that combines Kalman filter and Inertial Measurement Unit to address UAV sensor drift issues. The authors of [
20] provided a strategy, 5G-assisted UAV position monitoring, and an anti-GPS spoofing system to detect live GPS spoofing attack detection. This strategy involves the uplink receiving signal strength measurements used to detect these attacks. The authors of [
21] used a vision-based approach, combining UAV’s sensors, camera, and Inertial Measurement Unit to detect GPS spoofing attacks on small UAVs. Another study [
22] used a vision-based approach, employing Visual Odometry methods to detect GPS spoofing attacks on UAVs. The authors compared the extracted images with the flight trajectory information to detect and classify spoofed signals.Most research on this subject has focused on using specific ML and DL models without addressing the impact of dataset characteristics and model parameters on model performance (
Table 1). Multiple issues can hinder the development of feasible models for the problem at hand. For instance, classification algorithms can perform poorly and have low generalization ability when trained on small or biased datasets. The classification problem becomes more challenging when working with unreliable and biased data, such as datasets containing correlated features. Data reflecting GPS spoofing attacks are challenging to acquire and are limited; therefore, it is essential to find solutions that improve the quality of the corresponding dataset instead of focusing solely on increasing model accuracy. Investigating the impact of these factors on GPS spoofing detection techniques is needed to provide a consensus on best practices and create a basis for future research directions.In this work, we investigate the key factors that impact the performance of the most widely used AI models, including dataset characteristics and model parameters such as feature correlation, class imbalance, dataset size, hyperparameter tuning, and regularization (
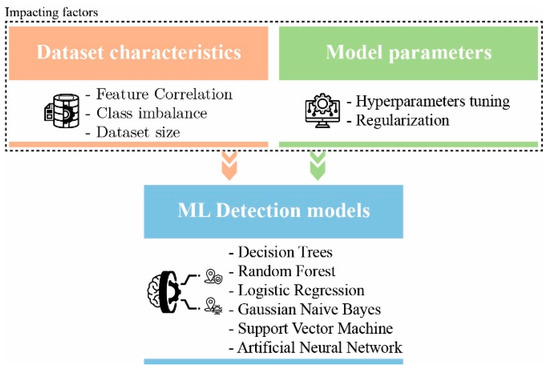
Figure 1). The investigated models in this study are SVM, ANN, RF, Gaussian Naïve Bayes (GNB), Classification, Regression Decision Tree (CART), and Logistic Regression (LR). We used a benchmark consisting of 13 features [
15] for training and testing the models. The performance of the models are evaluated on the basis of accuracy (ACC), probability of false alarm (Pfa), probability of detection (PD), and probability of misdetection (Pmd).
The main contributions of this paper are:
Evaluating the impact of hyperparameter tuning and regularization parameters on the performance of ML techniques to detect GPS spoofing attacks targeting UAVs,
Evaluating the impact of correlated and uncorrelated features on ML model performance,
Investigating the impact of correlated features on ML model performance with respect to dataset size,
Examining the impact of the percentage of malicious samples in the dataset on ML model performance.
The remainder of this paper is organized as follows:
Section 2 indicates the used materials and methodology,
Section 3 presents and discusses the simulation results, and the conclusion and future work recommendations are highlighted in
Section 4. 3. ResultsFour metrics were used to evaluate model performance: ACC, PD, Pfa, and Pmd. These metrics are defined as:
ACC=TP+TNTP+TN+FP+FN∗ 100
(5)
where TP defines the number of accurately predicted malicious samples, TN denotes the number of predicted normal samples, FP is the number of falsely predicted malicious samples, and FN is the number of falsely predicted normal samples. This work applied a 10-fold cross-validation method to train 80% of the given data and test 20% of the remaining data.
Table 3 summarizes the hyperparameter settings for the evaluated models with the best parameter values according to the Bayesian optimization technique. The regularized learning parameters determine the level of bias each model can tolerate with respect to an optimal value. We selected the degree of a correct classification parameter, such as C in SVM; a penalty parameter, alpha, in ANN; a complexity parameter, such as ccp_alpha, in RF and CART; a stable value of var_smothing in GNB; and a regularization strength parameter, C, in LR as the regularized learning parameters that play significant roles in model learning.The results are illustrated in
Figure 3,
Figure 4,
Figure 5,
Figure 6,
Figure 7 and
Figure 8.
Figure 3 depicts the detection model’s performance using the different values of the regularized learning parameter, r. A significant improvement for each model can be observed when using specific values. For instance, SVM reaches the highest performance at r = 8 with an ACC of 96.2%, a PD of 96.2%, a Pmd of 4.9%, and a Pfa of 6.2%. For r values higher than 8, this classifier’s performance stagnates. The ANN classifier reaches its maximum performance at r = 5 with an ACC of 99.34%, a PD of 99.4%, a Pmd of 0.6%, and a Pfa of 1.7%. This classifier also stagnates at values higher than r = 5. Other classifiers performe similarly in terms of the regularized learning parameters, excluding the GNB classifier.
The GNB classifier reaches its highest performance at r = 5 with an ACC of 91.2%, a PD of 86.16%, a Pmd of 13.84%, and a Pfa of 2.23%. The ACC of this classifier decreases slightly in the range of 0 to 0.1; however, it reaches a constant value of 84.9%. Other metrics, including PD, Pfa, and Pmd, follow similar trends. The RF classifier reaches a maximum ACC of 99.43% at r = 5 and a maximum PD of 99.6% at r = 0. This classifier also reaches a minimum Pmd of 1.8% at r = 5 and a minimum Pfa of 1.01% at r = 0.9. This classifier’s performance remains constant with higher r values. The CART classifier also reaches its maximum with an ACC of 99.9% at r = 10, a maximum PD of 99.98% at r = 0.9, a minimum with a Pmd of 0.02% at r = 10, and a Pfa of 1.005 at r = 0.9. This classifier’s performance remains constant at higher r values. The LR classifier reaches a maximum ACC of 91.2% at r = 10 and a maximum PD of 86.19% at r = 5, while reaching a minimum Pmd of 13.84% and a Pfa of 3% at r = 8. The performance of the six selected models slightly increase as the regulated parameters gradually increased; therefore, optimizing these hyperparameters can drastically improve the ML model’s performance.
Figure 4 illustrates the simulation results of the selected ML models with default and tuned parameters in terms of the four evaluation metrics. There is a modest improvement in the performance of all models after using the hyperparameters identified by the Bayesian optimization tuning technique. For instance, under the default hyperparameter values, the ANN classifier scores an ACC of 93%, a PD of 93.4%, a Pmd of 6.6%, and a Pfa of 3.37%. This classifier achieves an ACC of 99.3%, a PD of 99.4%, a Pfa of 2.01%, and a Pmd of 0.6% with the tuned values. Similarly, when the RF classifier used the default parameters, it achieves an ACC of 95.23%, a PD of 96%, a Pfa of 3.2%, and a Pmd of 4%. The model achieves an ACC of 99.89%, a PD of 99.87%, a Pfa of 1.8%, and a Pmd of 1.3% when using the tuned hyperparameters.
The GNB classifier yields an ACC of 88%, a PD of 84.44%, a Pmd of 15.56%, and a Pfa of 5.8%. The same classifier yields an ACC of 91%, a PD of 86.16%, a Pmd of 13.84%, and a Pfa of 5.8% with tuned parameters. The CART classifier has an ACC of 97%, a PD of 98.1%, a Pfa of 4.6%, and a Pmd of 1.9% with the default parameters, while the same classifier using the tuned parameters yields an ACC of 99.99%, a PD of 99.98%, a Pfa of 1.1%, and a Pmd of 0.02%. The same observations hold true for the LR classifier. This classifier yields an ACC of 89.6%, a PD of 84.4%, a Pmd of 15.6%, and a Pfa of 3.3% with the default parameters, and an ACC of 91%, a PD of 86.19%, a Pmd of 13.81%, and a Pfa of 3% with tuned parameters.
Figure 5 depicts the heatmap for the Pearson’s Correlation Coefficient and Chi-squared feature importance results.
Figure 5a indicates that five pairs of features, DO and TCD, TOW and RX, PC and LC, PC and EC, and EC and LC, are highly correlated with coefficient values greater than 0.9.
Figure 5b illustrates that the importance of TCD is greater than DO, RX is greater than TOW, LC is greater than PC, EC is greater than PC, and LC is greater than EC; therefore, we can keep the features with higher importance scores and remove those with lower scores. We discarded TOW, PC, and DO from the given dataset and conducted the training, testing, and validation of all models with the remaining nine features: PRN, PD, RX, PIP, PQP, TCD, C/N0, CP, and LC.
Figure 6 depicts the simulation results of the models’ performance with and without correlated features. All models with correlated features yield better results in terms of the four metrics. For instance, the models have lower ACC with the three correlated features than those without correlation. The LR classifier yields the highest difference between correlations and without correlations. This classifier has a 5.23% lower ACC without correlated features. The SVM model also achieves a 2.39% lower ACC without correlation. Other models, such as ANN, RF, GNB, and CART, have a lower ACC without correlations. The CART model exhibits the lowest difference between model ACC in terms of with and without correlation, with a 0.05% lower accuracy, while the ANN, RF, and GNB has approximately the same difference, 0.6%, after removing correlations from the given dataset.
The PD exhibits the same trends. The highest reduction in correlated feature removal is exhibited by the LR classifier, with 2.31%, whereas the CART classifier has the lowest reduction of 0.01% in the PD. The GNB classifier has a 0.09% lower PD after removing the correlated features. Other models, ANN and RF, also slightly have reduced PD by 0.5% and 0.27%, respectively. The classifiers have a higher Pmd after removing correlations. The highest Pmd with correlations is exhibited by the LR classifier, at 3.1%, while the CART classifier has slightly higher results after removing correlations, with a 0.2% lower Pmd. GNB and AN, have an approximately 2% higher Pmd without correlations, while ANN and RF have an increase of Pmd by 1% after removing correlations.
Removing correlations also impacts the probability of false alarm. The SVM classifier has the highest reduction in Pfa, at 1.3%, after discarding the correlated features. The CART classifier has a higher Pfa, 0.02%, after removing correlated features. The RF classifier has a slightly higher Pfa after removing the correlated features of 0.01%. Other models, such as GNB, have an approximately 1% higher Pfa without correlations. Using a dataset with correlated features increases model ACC and PD and decreases the Pfa and Pmd. Eliminating correlated features will ensure more optimal learning and accurate performance for the final ML models.
Figure 7 illustrates the impact of dataset size on model performance for 1000, 2000, 4000, 6000, 8000, 10,000, 12,000, and 14,000 samples. All created datasets were balanced, that is, we used equal numbers of both spoofed and normal GPS signal samples from the original dataset. This investigation evaluates two scenarios: one with correlated features and the other after removing the correlated features.
Figure 7A illustrates the performance of the six models with correlations in terms of the four metrics. As it can be observed, all the models exhibit an increase in ACC and PD and a decrease in the probabilities of false alarm and misdetection ranging from 2% to 10% as the dataset size increases.
Figure 7B illustrates the results without correlation. Like in the previous case (
Figure 7A), the accuracy and probability of detection increase as the dataset size increases for all models, while the probabilities of false alarm and misdetection decrease.
Therefore, with and without correlations, the performance of machine learning models improves when more training data are used.
We also evaluated the effect of dataset imbalance on ML model performance by examining different percentages of normal and malicious data samples in the dataset size of 14,000 samples (without correlation) by using the following ratios: 10% malicious signals to 90% normal signals, 20% malicious signals to 80% normal signals, 30% malicious signals to 70% normal signals, and 40% malicious signals to 60% normal signals. The results of these four scenarios were compared with those of the original balanced dataset (50% normal samples and 50% malicious samples).
Figure 8 presents the performance of the six models for different percentages of malicious signals. As it can be seen, the accuracy and probability increase with the rate of malicious signals and reach their best values at a rate of 50%. In addition. the probability of misdetection and false alarm decrease as functions of malicious signals rate and reach their best values at 50% rate. Therefore, an imbalance dataset causes degradation in classifiers’ performance.
In summary, we can conclude that:
Tuned hyperparameters and regularized learning parameters improve models’ performance in terms of the selected metrics.
The presence of correlated features in a dataset degrades models’ performance. Identifying and removing redundant features from the dataset improves significantly this performance.
Dataset size plays an important role in models’ performance which increases as the size increases.
Class imbalance leads to biased models with degrading performance.

留言 (0)