
 Figure 2.
IOTA2 classification module flow chart [
Figure 2.
IOTA2 classification module flow chart [


記住我
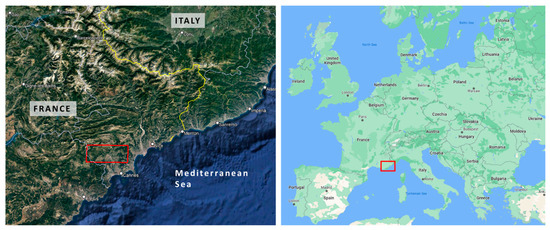
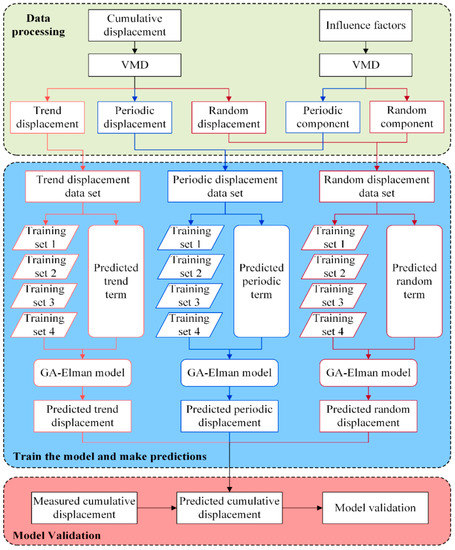
Figure 1. Area of interest identified by the red polygon, top left point: 43°43′15.86″ N 6°46′11.01″ E, bottom right point: 43°36′50.10″ N 7°4′45.83″ E in EPSG:4326/WGS84. (Google Earth).
Figure 3. The multi-classifier pipeline.
Figure 4. The architecture of Multi-Layer Perceptron (MLP) in this study.
Figure 5. Classification maps from (a) the baseline pipeline; (b) the multi-classifier pipeline using Multi-Layer Perceptron (MLP); (c) the multi-classifier pipeline using One-class Support Vector Machine (OCSVM).
Figure 6. Raster subtraction of classification maps between: (a) the baseline pipeline and the multi-classifier pipeline using MLP; (b) the baseline pipeline and the multi-classifier pipeline using OCSVM. X|Y indicates class X in the baseline pipeline was classified as class Y in the multi-classifier pipeline.
Table 1. Earth Observation data selection and their corresponding phenological stage.
Table 1. Earth Observation data selection and their corresponding phenological stage.
Phenological StepsFile NameAcquisition DateCloud Cover Dormancy period after harvestingS2B_MSIL2A_20190125T103319_N0211_R108_T32TLP_20190125T13425325 January 20196.74%Flowering periodS2A_MSIL2A_20190430T103031_N0211_R108_T32TLP_20190430T14010630 April 20195.86%Early-stage of fruit growthS2B_MSIL2A_20190724T103029_N0213_R108_T32TLP_20190724T13553924 July 20193.67%Late-stage of fruit growthS2B_MSIL2A_20190912T103019_N0213_R108_T32TLP_20190912T14121812 September 20190.18%Harvest seasonS2A_MSIL2A_20191106T103231_N0213_R108_T32TLP_20191106T1120196 November 201911.87%Table 2. The list of pipelines used in this study.
Table 2. The list of pipelines used in this study.
PipelineClassifier(s)DescriptionBaseline pipelineRandom ForestThe pipeline that used one classifierMulti-classifier pipeline 1Random Forest + Multi-layer PerceptronPipeline using a multi-classifier system random forest and a binary classification approach in its second classifierMulti-classifier pipeline 2Random Forest + One-class Support Vector MachinePipeline using a multi-classifier system, random forest and a unary classification approach in its second classifierTable 3. The total area in km2 based on each change category.
Table 3. The total area in km2 based on each change category.
Raster SubtractionChange CategoryArea [km2]Baseline–MLPNon-olive to Olive16.8Olive to Non-olive62.5No change192.9Baseline–OCSVMNon-olive to Olive16.3Olive to Non-olive42.9No change212.9Table 4. True positive rate of the three pipelines.
Table 4. True positive rate of the three pipelines.
PipelineTrue Positive RateIOTA281.7%IOTA2 + MLP83.5%IOTA2 + OCSVM87.1%Table 5. False positive rate of the baseline pipeline and the multi-classifier pipelines.
Table 5. False positive rate of the baseline pipeline and the multi-classifier pipelines.
PipelineFalse Positive RateIOTA242.5%IOTA2 + MLP1.4%IOTA2 + OCSVM28.9%
留言 (0)