


記住我
Conceptualization, S.G.E.-S., H.M.R., M.K.D., K.H.R. and E.I.E.-H.; methodology, S.G.E.-S., H.M.R., M.K.D., K.H.R. and E.I.E.-H.; software, S.G.E.-S., H.M.R., M.K.D., K.H.R. and E.I.E.-H.; validation, S.G.E.-S., H.M.R., M.K.D., K.H.R. and E.I.E.-H.; formal analysis, S.G.E.-S., H.M.R., M.K.D. and K.H.R.; investigation, S.G.E.-S., H.M.R., M.K.D., K.H.R. and E.I.E.-H.; resources, S.S., S.G.E.-S., H.M.R., M.K.D., K.H.R., E.I.E.-H., M.G., H.M.A.E.-L., H.E.-S. and M.M.K.; data curation, S.G.E.-S., H.M.R., M.K.D., K.H.R. and E.I.E.-H.; writing—original draft preparation, S.S., S.G.E.-S., H.M.R., M.K.D., K.H.R., E.I.E.-H., M.G., H.M.A.E.-L., H.E.-S. and M.M.K.; writing—review and editing, S.S., S.G.E.-S., H.E.-S., H.M.R., M.K.D., E.I.E.-H., M.G., H.M.A.E.-L., H.E.-S. and M.M.K.; visualization, S.G.E.-S., H.M.R. and E.I.E.-H.; supervision, S.G.E.-S., H.M.R., M.K.D., K.H.R. and E.I.E.-H.; project administration, S.S., S.G.E.-S., H.M.R., M.K.D., K.H.R., H.E.-S. and E.I.E.-H.; funding acquisition, S.S., M.G., H.M.A.E.-L., H.E.-S. and M.M.K. All authors have read and agreed to the published version of the manuscript.
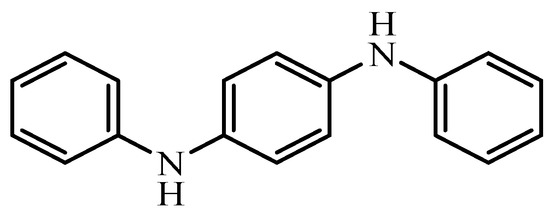
Figure 1. Antioxidants N,N′-diphenyl-1,4-phenylenediamine.
Figure 1. Antioxidants N,N′-diphenyl-1,4-phenylenediamine.
Figure 2. AD-MSCs positive surface markers (CD 73: 96.0%, CD 90: 96.7%, CD 105: 97.5%); AD-MSCs negative surface markers (CD 11b: 4.0%, CD 34: 4.6%, CD 45: 1.8%).
Figure 2. AD-MSCs positive surface markers (CD 73: 96.0%, CD 90: 96.7%, CD 105: 97.5%); AD-MSCs negative surface markers (CD 11b: 4.0%, CD 34: 4.6%, CD 45: 1.8%).
Figure 3. (A) Serum glucose levels (mg/100 mL). Values expressed as ±SEM (n = 6). a, b are Significant differences (p ≤ 0.05) compared to control, diabetic untreated and DPPD-diabetic treated groups, respectively. % is the percent of change compared to the diabetic group. (B) Serum insulin, C-peptide, and HbA1c levels. Values expressed as ±SEM (n = 6). a, b are Significant differences (p ≤ 0.05) compared to control, diabetic untreated and DPPD-diabetic treated groups, respectively. % is the percent of change compared to the diabetic group.
Figure 3. (A) Serum glucose levels (mg/100 mL). Values expressed as ±SEM (n = 6). a, b are Significant differences (p ≤ 0.05) compared to control, diabetic untreated and DPPD-diabetic treated groups, respectively. % is the percent of change compared to the diabetic group. (B) Serum insulin, C-peptide, and HbA1c levels. Values expressed as ±SEM (n = 6). a, b are Significant differences (p ≤ 0.05) compared to control, diabetic untreated and DPPD-diabetic treated groups, respectively. % is the percent of change compared to the diabetic group.
Figure 4. (A). Pancreatic oxidative stress (MDA and XO) levels and antioxidant markers (SOD and GST) levels. Values expressed as ±SEM (n = 6). a, b & c are Significant differences (p ≤ 0.05) compared to control, diabetic untreated and DPPD-diabetic treated groups, respectively. % is the percent of change compared to the diabetic group. (B). Pancreatic oxidative stress (H2O2 and AGEs) levels and antioxidant markers (CAT and TAC) levels. Values expressed as ±SEM (n = 6). a, b & c are Significant differences (p ≤ 0.05) compared to control, diabetic untreated and DPPD-diabetic treated groups, respectively. % is the percent of change compared to the diabetic group. (C). Pancreatic heme-oxygenase 1 oxidative stress levels. Values expressed as ±SEM (n = 6). a, b & c are Significant differences (p ≤ 0.05) compared to control, diabetic untreated and DPPD-diabetic treated groups, respectively. % is the percent of change compared to the diabetic group.
Figure 4. (A). Pancreatic oxidative stress (MDA and XO) levels and antioxidant markers (SOD and GST) levels. Values expressed as ±SEM (n = 6). a, b & c are Significant differences (p ≤ 0.05) compared to control, diabetic untreated and DPPD-diabetic treated groups, respectively. % is the percent of change compared to the diabetic group. (B). Pancreatic oxidative stress (H2O2 and AGEs) levels and antioxidant markers (CAT and TAC) levels. Values expressed as ±SEM (n = 6). a, b & c are Significant differences (p ≤ 0.05) compared to control, diabetic untreated and DPPD-diabetic treated groups, respectively. % is the percent of change compared to the diabetic group. (C). Pancreatic heme-oxygenase 1 oxidative stress levels. Values expressed as ±SEM (n = 6). a, b & c are Significant differences (p ≤ 0.05) compared to control, diabetic untreated and DPPD-diabetic treated groups, respectively. % is the percent of change compared to the diabetic group.
Figure 5. Serum CRP & pancreatic TGF-β, CD95, and IL-6 levels. Values expressed as ±SEM (n = 6). a, b & c are Significant differences (p ≤ 0.05) compared to control, diabetic untreated and DPPD-diabetic treated groups, respectively. % is the percent of change compared to the diabetic group.
Figure 5. Serum CRP & pancreatic TGF-β, CD95, and IL-6 levels. Values expressed as ±SEM (n = 6). a, b & c are Significant differences (p ≤ 0.05) compared to control, diabetic untreated and DPPD-diabetic treated groups, respectively. % is the percent of change compared to the diabetic group.
Figure 6. Pancreatic T-Helper (CD 4) and T-Cytotoxic (CD 8) %. Values expressed as ±SEM (n = 6). a, b & c are Significant differences (p ≤ 0.05) compared to control, diabetic untreated and DPPD-diabetic treated groups, respectively. % is the percent of change compared to the diabetic group.
Figure 6. Pancreatic T-Helper (CD 4) and T-Cytotoxic (CD 8) %. Values expressed as ±SEM (n = 6). a, b & c are Significant differences (p ≤ 0.05) compared to control, diabetic untreated and DPPD-diabetic treated groups, respectively. % is the percent of change compared to the diabetic group.
Figure 7. Pancreatic P53, caspase 3, & Bcl-2%. Values expressed as ±SEM (n = 6). a, b & c are Significant differences (p ≤ 0.05) compared to control, diabetic untreated and DPPD-diabetic treated groups, respectively. % is the percent of change compared to the diabetic group.
Figure 7. Pancreatic P53, caspase 3, & Bcl-2%. Values expressed as ±SEM (n = 6). a, b & c are Significant differences (p ≤ 0.05) compared to control, diabetic untreated and DPPD-diabetic treated groups, respectively. % is the percent of change compared to the diabetic group.
Table 1. Pancreatic cell cycle (G0/G1)%.
Table 1. Pancreatic cell cycle (G0/G1)%.
ControlDPPDDiabetic (D)D+DPPDD+AD-MSCsD+AD-Table 2. Pancreatic annexin V%.
Table 2. Pancreatic annexin V%.
ControlDPPDDiabetic (D)D+DPPDD+AD-MSCsD+AD-
留言 (0)