


記住我
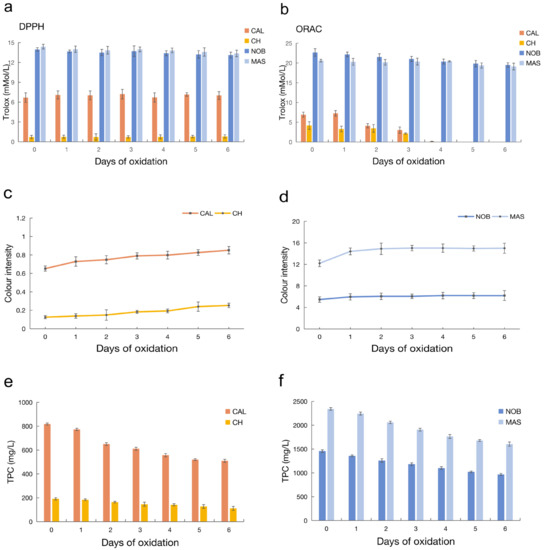
Figure 1. Antioxidant indices, color intensity, and total phenol contents of the wine during oxidation. (a) The DPPH of four wine samples during oxidation; (b) the ORAC of four wine samples during oxidation; (c) color intensity of the CAL and CH wines; (d) colour intensity of the NOB and MAS wines; (e) the TPC of CAL and CH; and (f) the TPC of NOB and MAS.
Figure 1. Antioxidant indices, color intensity, and total phenol contents of the wine during oxidation. (a) The DPPH of four wine samples during oxidation; (b) the ORAC of four wine samples during oxidation; (c) color intensity of the CAL and CH wines; (d) colour intensity of the NOB and MAS wines; (e) the TPC of CAL and CH; and (f) the TPC of NOB and MAS.
Figure 2. PCA score plots of the metabolite profiling data of the wine samples.
Figure 3. SCMs in different comparison groups during the oxidation process.
Figure 4. Selection of antioxidant-related compounds from SCMs. (a) Venn analysis of the SCMs in CAL vs. CH during oxidation; (b) Venn analysis of the SCMs in NOB vs. MAS during oxidation; (c) classification of the core 138 SCMs between CAL vs. CH and NOB vs. MAS; (d) and correlation heat map of core the 138 SCMs and antioxidant indices.
Figure 5. HPLC chromatograms of wine and pyrogallol solution. (a) CAL; (b) CH; (c) NOB; (d) MAS; (e) Pyrogallol. HPLC separation: reversed phase C18 column (2.1 mm × 100 mm × 1.7 μm); temperature: 45 °C; phase A: 0.1% formic acid solution; phase B: 0.1% formic acid—acetonitrile solution; flow rate: 0.4 mL/min. MS source temperature: 450 °C; ionspray voltage: 2 kV, flow rate: 15 L/min, scan range: 50–1000 m/z.
Figure 5. HPLC chromatograms of wine and pyrogallol solution. (a) CAL; (b) CH; (c) NOB; (d) MAS; (e) Pyrogallol. HPLC separation: reversed phase C18 column (2.1 mm × 100 mm × 1.7 μm); temperature: 45 °C; phase A: 0.1% formic acid solution; phase B: 0.1% formic acid—acetonitrile solution; flow rate: 0.4 mL/min. MS source temperature: 450 °C; ionspray voltage: 2 kV, flow rate: 15 L/min, scan range: 50–1000 m/z.
Figure 6. Antioxidant indices of Chardonnay and Marselan wines with pyrogallol during oxidation. Different letters indicate significant differences among values at the same date using Duncan’s test (p ≤ 0.05).
Table 1. Physicochemical indices of wine.
Table 1. Physicochemical indices of wine.
SampleResidue Sugar (g/L)Total Acidity (g/L)Alcohol (%)Total SO2 (mg/L)Free SO2 (mg/L)pHCAL1.12 ± 0.095.39 ± 0.147.52 ± 0.2478.24 ± 0.5629.08 ± 0.873.63 ± 0.02CH1.35 ± 0.266.32 ± 0.0813.53 ± 0.3192.19 ± 1.3432.21 ± 0.693.32 ± 0.02NOB2.34 ± 0.125.11 ± 0.177.04 ± 0.2270.12 ± 1.8323.33 ± 0.283.68 ± 0.03MAS2.81 ± 0.155.52 ± 0.1113.98 ± 0.2784.85 ± 1.0230.04 ± 0.353.51 ± 0.01
留言 (0)