


記住我
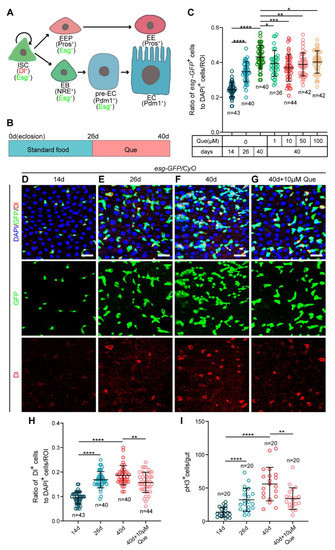
Figure 1. Que prevents gut hyperplasia in aged Drosophila. (A) The Drosophila intestinal stem cell (ISC) lineages. ISCs (marked by Dl and Esg) divide asymmetrically to renew themselves and give rise to enteroendocrine progenitor cells (EEPs; marked by Esg and Pros) or enteroblasts (EBs; marked by Esg and NRE). EEPs further differentiate into enteroendocrine cells (EEs; marked by Pros), whereas EBs with high Notch signaling (pre-ECs; marked by Esg and Pdm1) further differentiate into enterocytes (ECs; marked by Pdm1). (B) Schematic diagram showing the process of feeding quercetin (Que) to Drosophila. (C) The ratio of esg-GFP+ cells to DAPI+ cells per region of interest (ROI) in the posterior midguts of 14-, 26-, and 40-day-old flies (esg-GFP/CyO) without Que supplementation and 40-day-old flies fed with four concentrations (1, 10, 50, and 100 µM) of Que. n: number of ROI counted. (D–G) Representative immunofluorescence images of 14- (D), 26- (E), and 40-day-old (F) posterior midguts without Que supplementation and 40-day-old posterior midguts with 10 µM Que supplementation (G) stained with DAPI (blue; nuclei), GFP (green; ISCs and progenitor cells marker), and Dl (red; ISCs marker). The top panels represent the merged images, the middle panels represent esg-GFP, and the bottom panels represent Dl. Scale bars represent 25 µm. (H) The ratio of Dl+ cells to DAPI+ cells per ROI in the posterior midguts of flies in experiments D-G. n: number of ROI counted. (I) The number of pH3+ cells in the whole guts of flies in experiments D-G. n: number of guts counted. Error bars represent standard deviation (SDs). Student’s t-tests, * p < 0.05, ** p < 0.01, *** p < 0.001, and **** p < 0.0001.
Figure 1. Que prevents gut hyperplasia in aged Drosophila. (A) The Drosophila intestinal stem cell (ISC) lineages. ISCs (marked by Dl and Esg) divide asymmetrically to renew themselves and give rise to enteroendocrine progenitor cells (EEPs; marked by Esg and Pros) or enteroblasts (EBs; marked by Esg and NRE). EEPs further differentiate into enteroendocrine cells (EEs; marked by Pros), whereas EBs with high Notch signaling (pre-ECs; marked by Esg and Pdm1) further differentiate into enterocytes (ECs; marked by Pdm1). (B) Schematic diagram showing the process of feeding quercetin (Que) to Drosophila. (C) The ratio of esg-GFP+ cells to DAPI+ cells per region of interest (ROI) in the posterior midguts of 14-, 26-, and 40-day-old flies (esg-GFP/CyO) without Que supplementation and 40-day-old flies fed with four concentrations (1, 10, 50, and 100 µM) of Que. n: number of ROI counted. (D–G) Representative immunofluorescence images of 14- (D), 26- (E), and 40-day-old (F) posterior midguts without Que supplementation and 40-day-old posterior midguts with 10 µM Que supplementation (G) stained with DAPI (blue; nuclei), GFP (green; ISCs and progenitor cells marker), and Dl (red; ISCs marker). The top panels represent the merged images, the middle panels represent esg-GFP, and the bottom panels represent Dl. Scale bars represent 25 µm. (H) The ratio of Dl+ cells to DAPI+ cells per ROI in the posterior midguts of flies in experiments D-G. n: number of ROI counted. (I) The number of pH3+ cells in the whole guts of flies in experiments D-G. n: number of guts counted. Error bars represent standard deviation (SDs). Student’s t-tests, * p < 0.05, ** p < 0.01, *** p < 0.001, and **** p < 0.0001.
Figure 2. Que prevents stimulus-induced hyperproliferation of ISCs and improves stress tolerance in Drosophila. (A–F) Representative immunofluorescence images of Drosophila posterior midguts stained with DAPI, GFP, and Dl for DMSO (A), Que (B), PQ + DMSO (C), PQ + Que (D), BLM-rec-2d + DMSO (E), and BLM-rec-2d + Que (F) groups. The 0-day-old flies were fed with 10 µM Que for 10 days, then treated with 10 mM PQ for 1 day, followed by dissection. The 0-day-old flies were fed with 10 µM Que for 10 days, then treated with 25 µg/mL BLM for 1 day, and then resumed feeding with 10 µm Que for 1/2/3 days, followed by dissection. The top panels represent the merged images, whereas the bottom panels represent Dl. Scale bars represent 25 µm. (G,H) The ratio of esg-GFP+ cells (G) and Dl+ cells (H) to DAPI+ cells per ROI in the posterior midguts of flies in experiments (A–F). n: number of ROI counted. (I) The number of pH3+ cells in the whole gut of flies in experiments (A–F). n: number of gut counted. (J,K) Survival percentage of female W1118 flies with DMSO (blue curve) or Que (pink curve) supplementation under 20 mM PQ (J) or 5 µg/mL BLM (K) treatments. Each group had 100 flies and three independent experiments were conducted. Error bars represent SDs. Log-rank test was used for lifespan analysis. Student’s t-tests, * p < 0.05, ** p < 0.01, *** p < 0.001, **** p < 0.0001, and non-significance (ns) represents p > 0.05.
Figure 2. Que prevents stimulus-induced hyperproliferation of ISCs and improves stress tolerance in Drosophila. (A–F) Representative immunofluorescence images of Drosophila posterior midguts stained with DAPI, GFP, and Dl for DMSO (A), Que (B), PQ + DMSO (C), PQ + Que (D), BLM-rec-2d + DMSO (E), and BLM-rec-2d + Que (F) groups. The 0-day-old flies were fed with 10 µM Que for 10 days, then treated with 10 mM PQ for 1 day, followed by dissection. The 0-day-old flies were fed with 10 µM Que for 10 days, then treated with 25 µg/mL BLM for 1 day, and then resumed feeding with 10 µm Que for 1/2/3 days, followed by dissection. The top panels represent the merged images, whereas the bottom panels represent Dl. Scale bars represent 25 µm. (G,H) The ratio of esg-GFP+ cells (G) and Dl+ cells (H) to DAPI+ cells per ROI in the posterior midguts of flies in experiments (A–F). n: number of ROI counted. (I) The number of pH3+ cells in the whole gut of flies in experiments (A–F). n: number of gut counted. (J,K) Survival percentage of female W1118 flies with DMSO (blue curve) or Que (pink curve) supplementation under 20 mM PQ (J) or 5 µg/mL BLM (K) treatments. Each group had 100 flies and three independent experiments were conducted. Error bars represent SDs. Log-rank test was used for lifespan analysis. Student’s t-tests, * p < 0.05, ** p < 0.01, *** p < 0.001, **** p < 0.0001, and non-significance (ns) represents p > 0.05.
Figure 3. Que prevents age-related gut dysfunction and prolongs the lifespan. (A) Representative images of the intestinal acid-base homeostasis and the non-eating intestine of 14- and 40-day-old flies without Que supplementation and 40-day-old flies with 10 µM Que supplementation. A pink ellipse indicates the CCR. “Homeostasis” refers to CCR as yellow and “Perturbed” refers to CCR as blue. “Non-eating” means the flies did not eat, and the guts are not stained with bromophenol blue. (B,C) The percentage of acid-base balanced intestines (B) and eating intestines (C) in experiment (A). N ≥ 50 flies per group. Three independent experiments were conducted. (D,E) Representative images (D) and quantification (E) of excretion deposits of 14-and 40-day-old flies without Que supplementation and 40-day-old flies with 10 µM Que supplementation. Each group included 30 flies and three independent experiments were conducted. n: number of field counted. (F,G) Representative images (F) and quantification (G) of the percentage of the smurf flies in 14- and 40-day-old flies without Que supplementation and 40-day-old flies with 10 µM Que supplementation. Smurf (+) refers to a fly that leaks the blue dye from the gut into other tissues. Each group included 15 flies and three independent experiments were conducted. (H,I) Survival percentage of female W1118 flies with DMSO (blue curve) or Que (pink curve) supplementation starting from eclosion (0-day-old) or middle age (26-day-old). Each group included 100 flies. Three independent experiments were conducted. Error bars represent SDs. Log-rank test was used for lifespan analysis. Student’s t-tests, * p < 0.05, ** p < 0.01, *** p < 0.001, and **** p < 0.0001.
Figure 3. Que prevents age-related gut dysfunction and prolongs the lifespan. (A) Representative images of the intestinal acid-base homeostasis and the non-eating intestine of 14- and 40-day-old flies without Que supplementation and 40-day-old flies with 10 µM Que supplementation. A pink ellipse indicates the CCR. “Homeostasis” refers to CCR as yellow and “Perturbed” refers to CCR as blue. “Non-eating” means the flies did not eat, and the guts are not stained with bromophenol blue. (B,C) The percentage of acid-base balanced intestines (B) and eating intestines (C) in experiment (A). N ≥ 50 flies per group. Three independent experiments were conducted. (D,E) Representative images (D) and quantification (E) of excretion deposits of 14-and 40-day-old flies without Que supplementation and 40-day-old flies with 10 µM Que supplementation. Each group included 30 flies and three independent experiments were conducted. n: number of field counted. (F,G) Representative images (F) and quantification (G) of the percentage of the smurf flies in 14- and 40-day-old flies without Que supplementation and 40-day-old flies with 10 µM Que supplementation. Smurf (+) refers to a fly that leaks the blue dye from the gut into other tissues. Each group included 15 flies and three independent experiments were conducted. (H,I) Survival percentage of female W1118 flies with DMSO (blue curve) or Que (pink curve) supplementation starting from eclosion (0-day-old) or middle age (26-day-old). Each group included 100 flies. Three independent experiments were conducted. Error bars represent SDs. Log-rank test was used for lifespan analysis. Student’s t-tests, * p < 0.05, ** p < 0.01, *** p < 0.001, and **** p < 0.0001.
Figure 4. Que prevents age-related hyperproliferation of ISC partially through its antioxidative ability. (A) RT-qPCR analysis of the antioxidant-related genes (Cat, Sod1, Sod2, and GstD1) in the midguts of 40-day-old flies fed with or without Que. Three independent experiments were conducted. (B–D) Representative immunofluorescence images of the posterior midguts of 14- (B) and 40-day-old (C) flies without Que supplementation and 40-day-old flies with 10 µM Que supplementation (D) stained with DHE (red; ROS maker). Esg-GFP+ cells and DHE staining are circled by the white dashed line. The top panels represent the merged images, whereas the bottom panels represent DHE staining. Scale bars represent 10 µm. (E) Quantitation of DHE fluorescence intensity in esg-GFP+ cells from experiments (B–D). Each dot indicates one esg-GFP+ cell. (F–J) Representative immunofluorescence images of posterior midguts of flies carrying esgts-Gal4-driven UAS-lacZ (F), UAS-Cat + DMSO (G), UAS-Cat + Que (H), Keap1 RNAi + DMSO (I), and Keap1 RNAi + Que (J) stained with DAPI, GFP, and Dl. The top panels represent the merged images, whereas the bottom panels represent Dl. Scale bars represent 25 µm. (K,L) The ratio of esg-GFP+ cells (K) and Dl+ cells (L) to DAPI+ cells per ROI in the posterior midguts of flies in experiments (F–J). n: number of ROI counted. (M) The number of pH3+ cells in the whole gut of flies in experiments (F–J). n: number of gut counted. Error bars represent SDs. Student’s t-tests, * p < 0.05, ** p < 0.01, *** p < 0.001, and **** p < 0.0001.
Figure 4. Que prevents age-related hyperproliferation of ISC partially through its antioxidative ability. (A) RT-qPCR analysis of the antioxidant-related genes (Cat, Sod1, Sod2, and GstD1) in the midguts of 40-day-old flies fed with or without Que. Three independent experiments were conducted. (B–D) Representative immunofluorescence images of the posterior midguts of 14- (B) and 40-day-old (C) flies without Que supplementation and 40-day-old flies with 10 µM Que supplementation (D) stained with DHE (red; ROS maker). Esg-GFP+ cells and DHE staining are circled by the white dashed line. The top panels represent the merged images, whereas the bottom panels represent DHE staining. Scale bars represent 10 µm. (E) Quantitation of DHE fluorescence intensity in esg-GFP+ cells from experiments (B–D). Each dot indicates one esg-GFP+ cell. (F–J) Representative immunofluorescence images of posterior midguts of flies carrying esgts-Gal4-driven UAS-lacZ (F), UAS-Cat + DMSO (G), UAS-Cat + Que (H), Keap1 RNAi + DMSO (I), and Keap1 RNAi + Que (J) stained with DAPI, GFP, and Dl. The top panels represent the merged images, whereas the bottom panels represent Dl. Scale bars represent 25 µm. (K,L) The ratio of esg-GFP+ cells (K) and Dl+ cells (L) to DAPI+ cells per ROI in the posterior midguts of flies in experiments (F–J). n: number of ROI counted. (M) The number of pH3+ cells in the whole gut of flies in experiments (F–J). n: number of gut counted. Error bars represent SDs. Student’s t-tests, * p < 0.05, ** p < 0.01, *** p < 0.001, and **** p < 0.0001.
Figure 5. Que prevents age-related hyperproliferation of ISC by inhibiting insulin signaling. (A) Volcano plot shows differentially expressed genes in Que-treated 40-day-old flies compared to the control group. Red dots indicate significantly upregulated genes, blue dots indicate significantly downregulated genes, and gray dots indicate genes that are not significantly different. Glaz, Karl, and foxo are antioxidant-related genes, and the other identified genes are glucose and lipid metabolism-related. (B) KEGG pathway enrichment analysis of upregulated or downregulated genes in pair-wise comparison of 40-day-old flies without Que supplementation to 40-day-old flies with 10 µM Que supplementation. Both the p-value and input number represent the significance of the respective pathway. (C) RT-qPCR analysis of insulin signaling pathway-related genes (dilp2, dilp3, dilp5, and Thor) in the esg-GFP+ cells of 40-day-old flies fed with or without Que. Three independent experiments were conducted. (D–F) Representative immunofluorescence images of the posterior midguts of 14- (D) and 40-day-old (E) flies without Que supplementation and 40-day-old flies with 10 µM Que supplementation (F) stained with DAPI, GFP, and pAkt (red; a marker indicates activated insulin signaling pathway). White arrows indicate esg-GFP+ cells and pAkt staining. The top panels represent the merged images, whereas the bottom panels represent pAkt. Scale bars represent 10 µm. (G) Quantitation of pAkt fluorescence intensity in esg-GFP+ cells from experiments (D–F). Each dot indicates one esg-GFP+ cell. (H–L) Representative immunofluorescence images of the posterior midguts of flies carrying esgts-Gal4-driven UAS-lacZ (H), UAS-InR-DN + DMSO (I), UAS-InR-DN + Que (J), InR RNAi + DMSO (K), and InR RNAi + Que (L) stained with DAPI, GFP, and Dl. Scale bars represent 25 µm. (M,N) The ratio of esg-GFP+ cells and Dl+ cells to DAPI+ cells per ROI in the posterior midguts of flies in experiments. (H–L). n: number of ROI counted. (O) The number of pH3+ cells in the whole gut of flies in experiments (H–L). n: number of gut counted. Error bars represent SDs. Student’s t-tests, * p < 0.05, ** p < 0.01, *** p < 0.001, and **** p < 0.0001.
Figure 5. Que prevents age-related hyperproliferation of ISC by inhibiting insulin signaling. (A) Volcano plot shows differentially expressed genes in Que-treated 40-day-old flies compared to the control group. Red dots indicate significantly upregulated genes, blue dots indicate significantly downregulated genes, and gray dots indicate genes that are not significantly different. Glaz, Karl, and foxo are antioxidant-related genes, and the other identified genes are glucose and lipid metabolism-related. (B) KEGG pathway enrichment analysis of upregulated or downregulated genes in pair-wise comparison of 40-day-old flies without Que supplementation to 40-day-old flies with 10 µM Que supplementation. Both the p-value and input number represent the significance of the respective pathway. (C) RT-qPCR analysis of insulin signaling pathway-related genes (dilp2, dilp3, dilp5, and Thor) in the esg-GFP+ cells of 40-day-old flies fed with or without Que. Three independent experiments were conducted. (D–F) Representative immunofluorescence images of the posterior midguts of 14- (D) and 40-day-old (E) flies without Que supplementation and 40-day-old flies with 10 µM Que supplementation (F) stained with DAPI, GFP, and pAkt (red; a marker indicates activated insulin signaling pathway). White arrows indicate esg-GFP+ cells and pAkt staining. The top panels represent the merged images, whereas the bottom panels represent pAkt. Scale bars represent 10 µm. (G) Quantitation of pAkt fluorescence intensity in esg-GFP+ cells from experiments (D–F). Each dot indicates one esg-GFP+ cell. (H–L) Representative immunofluorescence images of the posterior midguts of flies carrying esgts-Gal4-driven UAS-lacZ (H), UAS-InR-DN + DMSO (I), UAS-InR-DN + Que (J), InR RNAi + DMSO (K), and InR RNAi + Que (L) stained with DAPI, GFP, and Dl. Scale bars represent 25 µm. (M,N) The ratio of esg-GFP+ cells and Dl+ cells to DAPI+ cells per ROI in the posterior midguts of flies in experiments. (H–L). n: number of ROI counted. (O) The number of pH3+ cells in the whole gut of flies in experiments (H–L). n: number of gut counted. Error bars represent SDs. Student’s t-tests, * p < 0.05, ** p < 0.01, *** p < 0.001, and **** p < 0.0001.
Figure 6. Que prevents age-related hyperproliferation of ISC through scavenging ROS and inhibiting insulin signaling pathway. (A–E) Representative immunofluorescence images of posterior midguts of flies carrying esgts-Gal4-driven UAS-lacZ (A), UAS-Cat; UAS-InR-DN + DMSO (B), UAS-Cat; UAS-InR-DN + Que (C), Keap1 RNAi; UAS-InR-DN + DMSO (D), and Keap1 RNAi; UAS-InR-DN + Que (E) stained with DAPI, GFP, and Dl. The top panels represent the merged images, whereas the bottom panels represent Dl. Scale bars represent 25 µm. (F) The ratio of esg-GFP+ cells and Dl+ cells to DAPI+ cells per ROI in the posterior midguts of flies in experiments (A–E). n: number of ROI counted. (G) The number of pH3+ cells in the whole gut of flies in experiments (A–E). n: number of gut counted. (H,I) The percentage of acid-base balanced intestines (H) and eating intestines (I) of flies in experiments (A–E). N ≥ 50 flies per group. Three independent experiments were conducted. (J) Quantifying the excretion deposits of flies in experiments (A–E). Each group included 30 flies and three independent experiments were conducted. n: number of field counted. (K) The percentage of the smurf (+) flies in experiments (A–E). Each group included 15 flies and three independent experiments were conducted. (L) Survival percentage of indicated genotypes of female flies. Each group included 100 flies. Three independent experiments were conducted. (M) Schematic model of the mechanism of quercetin action. Que prevents the hyperproliferation of ISCs via attenuating oxidative stress and inhibiting the insulin signaling pathway. Error bars represent SDs. Log-rank test was used for lifespan analysis. Student’s t-tests, *** p < 0.001, **** p < 0.0001, and non-significance (ns) represents p > 0.05.
Figure 6. Que prevents age-related hyperproliferation of ISC through scavenging ROS and inhibiting insulin signaling pathway. (A–E) Representative immunofluorescence images of posterior midguts of flies carrying esgts-Gal4-driven UAS-lacZ (A), UAS-Cat; UAS-InR-DN + DMSO (B), UAS-Cat; UAS-InR-DN + Que (C), Keap1 RNAi; UAS-InR-DN + DMSO (D), and Keap1 RNAi; UAS-InR-DN + Que (E) stained with DAPI, GFP, and Dl. The top panels represent the merged images, whereas the bottom panels represent Dl. Scale bars represent 25 µm. (F) The ratio of esg-GFP+ cells and Dl+ cells to DAPI+ cells per ROI in the posterior midguts of flies in experiments (A–E). n: number of ROI counted. (G) The number of pH3+ cells in the whole gut of flies in experiments (A–E). n: number of gut counted. (H,I) The percentage of acid-base balanced intestines (H) and eating intestines (I) of flies in experiments (A–E). N ≥ 50 flies per group. Three independent experiments were conducted. (J) Quantifying the excretion deposits of flies in experiments (A–E). Each group included 30 flies and three independent experiments were conducted. n: number of field counted. (K) The percentage of the smurf (+) flies in experiments (A–E). Each group included 15 flies and three independent experiments were conducted. (L) Survival percentage of indicated genotypes of female flies. Each group included 100 flies. Three independent experiments were conducted. (M) Schematic model of the mechanism of quercetin action. Que prevents the hyperproliferation of ISCs via attenuating oxidative stress and inhibiting the insulin signaling pathway. Error bars represent SDs. Log-rank test was used for lifespan analysis. Student’s t-tests, *** p < 0.001, **** p < 0.0001, and non-significance (ns) represents p > 0.05.
留言 (0)