
記住我


Liver disease is a leading cause of morbidity and mortality in people with HIV (PWH), even in those effectively treated with antiretroviral therapy (ART) [1–4]. A spectrum of conditions affecting the liver – including viral hepatitis, fatty liver disease, and insulin resistance – are common among PWH and contribute synergistically to liver injury, inflammation, and fibrosis [5–8]. At the same time, HIV infection itself is independently associated with significant liver disease [9,10], likely potentiated via immune-mediated pathways, such as oxidative stress, an altered cytokine profile, and systemic inflammation [11]. Several studies have shown deleterious effects of HIV on hepatocytes, liver-resident macrophages (Kupffer cells), hepatic stellate cells, and liver-resident lymphocytes [12–17], further suggesting the direct role HIV plays in the development and progression of liver damage.
Although most modern ART regimens are considered less hepatotoxic than previously used ‘first generation’ drugs [6], their short-term and long-term effects on the liver need to be further investigated. Some studies indicate that early and continued ART leads to improved liver-specific health outcomes [18,19], whereas others describe the opposite with symptoms of drug-related toxicity and metabolic dysregulation exacerbating liver injury [20,21]. Given this complex interplay of pathogenic and protective mechanisms, HIV-associated and ART-associated effects on the liver require further study.
[18F]-fluorodeoxyglucose (FDG) PET-computed tomography (PET/CT) imaging allows noninvasive visualization and quantification of glucose metabolism in the liver and other organs [22]. In this study, we used FDG PET/CT to evaluate structural and metabolic hepatic changes in PWH with advanced disease before and after ART initiation and their association with clinical and laboratory biomarkers to better understand the pathophysiology of liver disease in HIV and guide long-term disease management. In addition, imaging and biomarker findings were compared with a group of healthy participants.
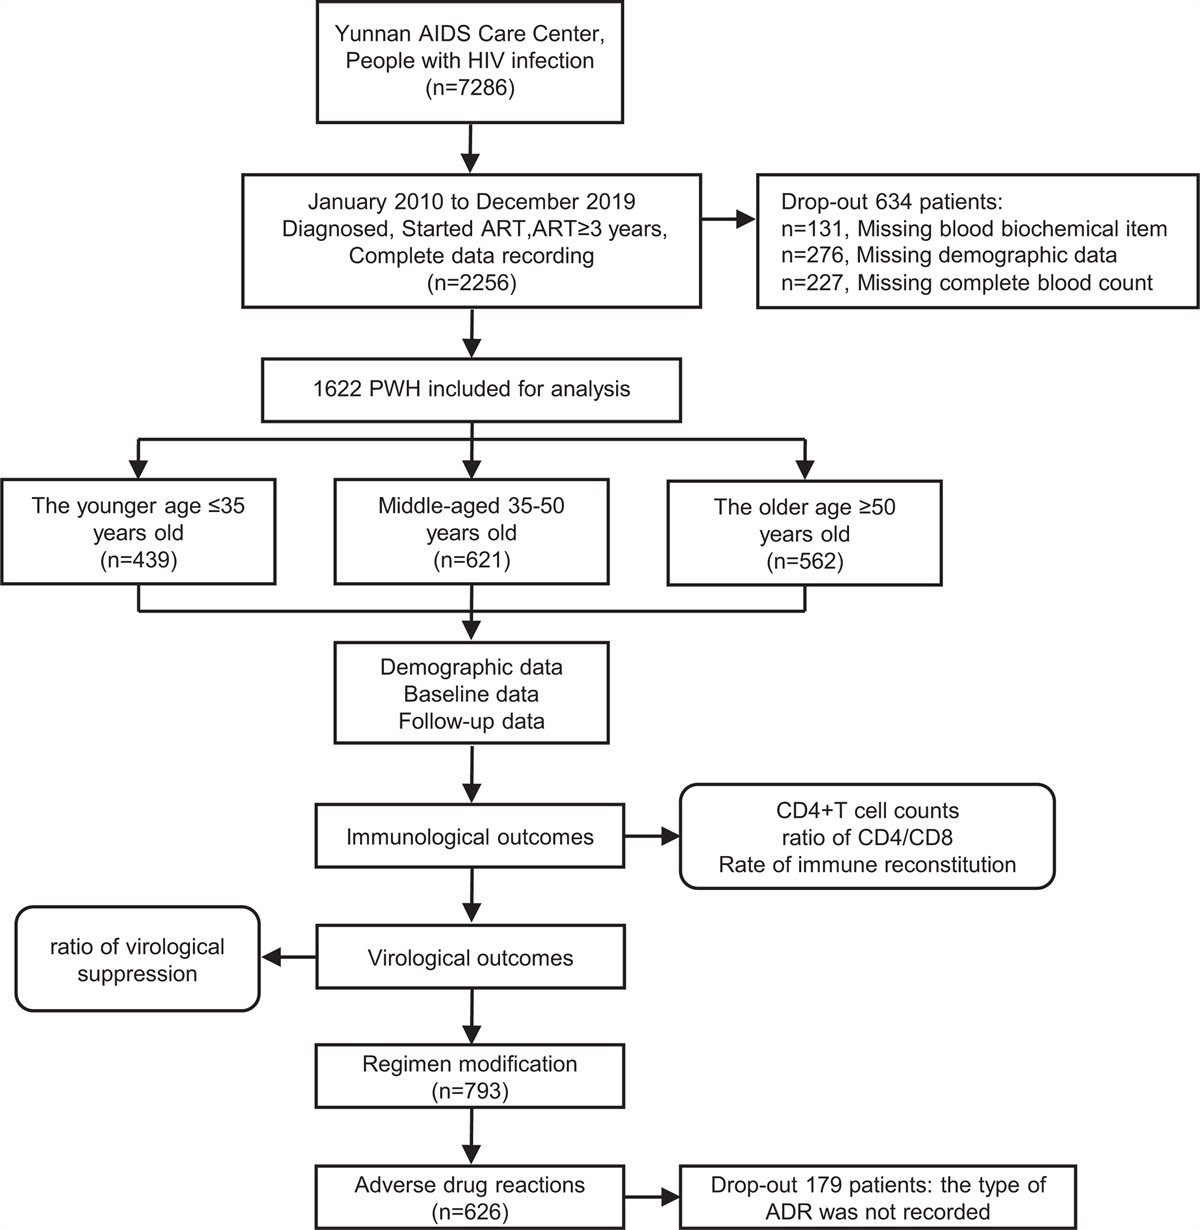
Materials and methodsForty-eight viremic, ART-naive PWH participants with CD4+ cell counts less than 100 cells/μl were recruited under protocol 14-I-0124 [PET Imaging and Lymph Node Assessment of Immune Reconstitution Inflammatory Syndrome (IRIS) in Persons With AIDS, PANDORA, NCT02147405]. All participants (n = 48) underwent whole-body [18F]-FDG PET/CT scans at baseline and approximately 6 weeks after ART initiation (short-term). Twenty-seven of these participants underwent long-term follow-up PET/CT scans approximately 2 years after ART initiation. Individuals diagnosed with hepatitis co-infection and/or severe hepatic steatosis were excluded. Twenty healthy volunteers recruited under protocol 13-H-0194 (Links Between Inflammation and Cardiometabolic Diseases, NCT01934660) were included as a control group. Healthy volunteers also received a whole body FDG PET/CT scan. Additional details regarding patient enrollment as well as inclusion and exclusion criteria for both protocols are included in Supplemental Methods, https://links.lww.com/QAD/C562. The studies were reviewed and approved by the Institutional Review Boards of the National Institute of Allergy and Infectious Diseases (NIAID) (protocol 14-I-0124) and National Heart, Lung, and Blood Institute (NHLBI) (protocol 13-H-0194). Both studies were approved by the NIH Radiation Safety Committee in keeping with the Declaration of Helsinki of the World Medical Association. All participants signed informed consent before any study procedures.
[18F]-fluorodeoxyglucose-PET/computed tomography imaging and image analysisDetails about FDG PET/CT scan acquisition are included in Supplemental Methods, https://links.lww.com/QAD/C562. Volumes of interest (VOIs) were manually drawn on co-registered PET/CT scans in the liver (methodological details in Supplemental Methods, https://links.lww.com/QAD/C562). Mean standardized uptake values (SUVmean) and mean CT attenuation values (HUmean) of the liver were measured. Although maximum standardized uptake value is more commonly utilized in clinical settings, especially for assessing FDG uptake in tumors, SUVmean is a more robust parameter for measuring liver uptake as a whole and has less statistical variability [23]. Volumes of interest were also drawn in the spleen (Supplemental Methods, https://links.lww.com/QAD/C562) to measure corresponding SUVmean values. Whole liver volumes were obtained through manual segmentation. MIM Software (V.6.9.4) was used for these analyses.
Clinical and laboratory parametersDetails about laboratory, immune and metabolic markers obtained in PWH and healthy controls are included in Supplemental Methods, https://links.lww.com/QAD/C562 and Table S1, https://links.lww.com/QAD/C562. Detailed clinical characterization of PWH participants including treatment regimens, comorbidities, IRIS status, and steroid use at the time of PET scanning pre-ART and post-ART was also performed.
Statistical analysisWhole liver volume, BMI, age, and other laboratory markers of control participants were compared with baseline and long-term values in the PWH group using nonparametric Mann–Whitney tests as some data sets did not have normal distributions (Table 1). All longitudinal comparisons in PWH participants (baseline versus short-term, short-term versus long-term, and baseline versus long-term) were assessed using Wilcoxon tests (nonparametric matched-pairs signed rank tests).
Table 1 - Comparison of demographics, clinical, and laboratory markers between control (n = 20) and people with HIV participants at baseline and short-term (n = 48) as well as long-term follow-up (n = 27) Comparisons (P value) Variables Controls (n = 20) PWH baseline (n = 48) PWH short-term (n = 48) PWH long-term (n = 27) Ctrl vs. PWH baseline Ctrl vs. PWH short-term Ctrl vs. PWH long-term Age (years) 52.6 (42.5–57.8) 37.5 (34.3–42.5) 37.6 (34.5–42.6) 38.9 (36.3–42.7) <0.0001 <0.0001 0.0002 Sex (M:F) 15 : 5 33 : 15 33 : 15 19 : 8 0.606 0.606 0.726 BMI (kg/m2) 28.9 (24.3–32.6) 21.8 (19.1–24.4) 23.4 (20.3–25.8) 27.3 (23.4–31.1) <0.0001 0.0007 0.408 CD4+ cell count (cells/μl) – 25.0 (11.0–41.75) 87.5 (47.3–173.8) 335.0 (214.0–458.0) – – – HIV viral load (copies/ml) – 258 428 (96 346–695 314) 106.5 (40.0–573.0) <40 in 26/2798 in 1/27 – – – ART regimen NNRTI – – 7 1 – – – INSTI – – 39a 24a – – – PI – – 3a 3a – – – Glucose (mg/dl) 93.5 (88.0–103.8) 82.5 (75.5–86.8) 84.0 (78.0–90.8) 92.0 (87.0–101.0) <0.0001 <0.0001 0.333 Cholesterol (mg/dl) 193.0 (167.0–214.5) 141.0 (122.0–172.0) NM 171.0 (157.0–201.0) 0.0003 – 0.273 LDL (mg/dl) 111.5 (87.8–128.5) 74.5 (63.5–92.8) NM 101.5 (80.5–115.3) <0.0001 – 0.236 HDL (mg/dl) 48.5 (40.5–57.8) 31.0 (28.0–52.0) NM 52.0 (38.0–58.0) 0.0013 – 0.936 TG (mg/dl) 104.0 (77.8–156.0) 122.0 (104.0–193.0) NM 107.0 (86.0–183.0) 0.173 – 0.721 CRP (mg/l) 1.35 (0.92–2.93) 6.00 (1.85–19.70) 4.40 (1.83–10.0) 2.20 (0.70–5.70) 0.0006 0.0004 0.491 SUVmean 2.49 (2.28–2.70) 1.92 (1.77–2.14) 1.92 (1.72–2.14) 2.26 (2.02–2.54) <0.0001 <0.0001 0.004 HUmean 56.4 (47.25–60.01) 51.51 (48.13–57.00) 55.44 (50.98–59.11) 56.16 (51.92–60.80) 0.138 0.714 0.873 Liver volume (cm3) 1668 (1153–1876) 1617 (1364–1774) NM 1485 (1352–1639) 0.923 – 0.364Comparison of demographics and laboratory tests for controls and PWH at baseline (BL), short-term (ST), and long-term (LT) follow-up. All values are medians with interquartile ranges (between parentheses) except for sex and initial ART regimen. Statistical comparisons were done using Mann–Whitney test except for sex, which was compared using chi-square test. CRP, C-reactive protein; HDL, high-density lipoprotein; HUmean, mean CT attenuation values; LDL, low-density lipoprotein; NM, not measured; PWH, people with HIV; SUVmean, mean standardized uptake value; TG, triglycerides.
aOne PWH participant received both protease inhibitors and NNRTIs in their short-term and long-term ART regimen.
SUVmean and HUmean values at baseline, short-term, and long-term time points for PWH participants were compared separately to control participants using Mann–Whitney tests (Table 1). Longitudinal comparisons within the PWH group over time were conducted using Friedman tests (nonparametric repeated-measures ANOVA) followed by Dunn's multiple comparison tests. Among PWH, liver SUVmean and HUmean values were compared between IRIS and non-IRIS participants at all timepoints using Mann–Whitney tests. Liver SUVmean and HUmean in PWH who experienced different levels of immune reconstitution at the long-term timepoint (CD4+ cell counts <200, 200–500, and >500) were also compared using a Kruskal–Wallis test at baseline, short-term, and long-term timepoints. The above comparisons were performed using GraphPad Prism (v.9.0.0).
For examining individual associations between clinical and laboratory markers on one hand and liver FDG uptake (SUVmean) and CT attenuation (HUmean) on the other, univariable linear regressions (using within-participant repeated-measures whenever appropriate) were performed. To identify the best set of markers associated with SUVmean and HUmean, stepwise linear regression analyses were performed based on a combination of P values and Bayesian Information Criterion (BIC), a.k.a. Schwarz Bayesian Information Criterion (SBC). The computer application SAS, version 9.4 (SAS Institute, Cary, North Carolina, USA) was used.
Following the strong recommendation of the American Statistical Association in 2019 [24], we avoided using strict P value thresholds to determine ‘statistical significance’. Instead, a general guideline used to consider evidence for a difference or an association was P value less than 0.01, with P values between 0.01 and 0.05 considered as possible evidence for a difference or an association. Semi-partial omega-squared values (ω2) were used for reporting effect size of the univariable and multivariable regression analyses [25].
Results Patient characteristicsAfter exclusion of individuals diagnosed with hepatitis co-infection and/or severe hepatic steatosis (for details see Supplemental Methods, https://links.lww.com/QAD/C562), this study included 48 ART-naive PWH (33 male individuals, 15 female individuals), scanned at baseline and approximately 6 weeks (mean = 6.0 ± 2.5 weeks) after ART initiation. Twenty-seven PWH (19 male individuals, 8 female individuals) underwent long-term follow-up PET/CT scans approximately 2 years (mean=1.9 ± 0.2 years) after starting ART. One included participant (#28) was found to have an echogenic liver with slightly nodular contour by ultrasound examination but normal flow direction in the portal and hepatic veins. Median CD4+ cell count at baseline, short-term, and long-term timepoints were 25.0, 87.5, and 335.0 cell/μl, respectively. Median HIV viral load was 258 428 copies (copies)/ml at baseline and 106.5 copies/ml at short-term. At the last timepoint (long-term), 26 out of 27 participants had undetectable viral load (<40 copies/ml) and one participant had a viral load of 98. The percentage undetectable viral load (<40 copies/ml) at each timepoint was 0, 35, and 96% (Table 1). Detailed characterization of PWH (treatment regimens, comorbidities, IRIS status, and steroid use at the time of the scan) is included in Table S2, https://links.lww.com/QAD/C562. Eighteen PWH participants out of 48 developed IRIS with various pathogens upon starting ART. Many participants (IRIS and non-IRIS) also required steroid treatment at different timepoints (Table S2, https://links.lww.com/QAD/C562).
A comparison of demographic and laboratory tests between the groups is summarized in Table 1. PWH participants were considerably younger than control participants. The median BMI of control participants was significantly higher than that of PWH at baseline and short-term but not at long-term (Fig. 1 a and Table 1). Notably, PWH experienced an average increase in BMI of 5.4 kg/m2 between the baseline and long-term scans, likely because of PWH participants having very advanced disease upon presentation, which reversed following ART initiation.
 Fig. 1:
 (a) Differences in biomarkers between control participants and people with HIV at baseline and people with HIV approximately 2 years after antiretroviral therapy initiation.
 Fig. 1 (Continued):
 (a) Differences in biomarkers between control participants and people with HIV at baseline and people with HIV approximately 2 years after antiretroviral therapy initiation.
Comparisons of clinical and laboratory measurements between control and people with HIV participantsBaseline prescan fasting blood glucose levels were significantly lower in PWH compared with control participants at baseline and short-term; however, values were no longer different from controls at the long-term scan (Table 1). Baseline cholesterol, low-density lipoprotein (LDL), and high-density lipoprotein (HDL) levels were lower in PWH at baseline compared with controls while C-reactive protein (CRP) values were higher. By the long-term follow-up, however, those differences disappeared. Triglyceride levels showed no differences between the groups at any time point (Table 1 and Fig. 1 a).
Comparing baseline PWH to long-term PWH participants (n = 27), BMI, LDL, and glucose increased while CRP decreased (P < 0.0001, P < 0.006, P = 0.007, and P = 0.002, respectively) (Fig. 1 b). Longitudinally, alanine aminotransferase (ALT), aspartate aminotransferase (AST) and glucagon decreased from baseline to long-term (P < 0.0001, P < 0.0001, 0.003), whereas albumin increased (P < 0.0001) (Fig. 1 b). Additional immune and metabolic markers were significantly different between baseline and long-term and were included as covariates in the linear regression analysis. Among those, glucagon decreased (P = 0.0025) and leptin increased (P < 0.0001) (Fig. 1 b).
Comparisons and correlations of imaging variablesMedian liver SUVmean was lower at baseline and short-term PWH scans (n = 48) compared with controls (n = 20) (P < 0.0001 for both). At the long-term scan (n = 27), PWH SUVmean values increased compared with short-term scans (n = 48); however, they remained lower than those of controls (n = 20) (P = 0.004) (Table 1, Fig. S1, https://links.lww.com/QAD/C558). No differences were detected in HUmean values between control and PWH participants at any time point (Table 1, Fig. S2, https://links.lww.com/QAD/C559). Liver SUVmean and HUmean in PWH who experienced different levels of immune reconstitution at the long-term timepoint (CD4+ cell counts <200, 200–500, and >500) were not different at any timepoint across groups (all P values >0.411).
Among PWH, there were no differences of liver SUVmean or HUmean values between participants who developed IRIS versus those who did not develop IRIS at any timepoint (all P values >0.185).
In the longitudinal analysis, when comparing baseline male and female liver SUVmean, male individuals had a weak evidence for lower values (P = 0.022). No differences, however, were noted between female and male values for the short-term and long-term time points (P = 0.126 and 0.095, respectively). For HUmean values, no differences between female and male individuals were seen at any point (all P values >0.125).
When evaluating all PWH participants with baseline and short-term scans, there were no differences in liver SUVmean values (P = 0.532, n = 48). When considering PWH participants who underwent baseline, short-term, and long-term imaging (n = 27), liver SUVmean increased from baseline to long-term and from short-term to long-term (P = 0.002; multiple comparisons: baseline to long-term, P = 0.008, short-term to long-term, P = 0.005) (Fig. 2a and b). Although there was weak evidence for increasing HUmean values in all participants between baseline and short-term follow-up (P = 0.011, n = 48), there were no differences when all three time points were considered (P = 0.264, n = 27) (Fig. S2, https://links.lww.com/QAD/C559).
 Fig. 2:
 (a) [18F]-fluorodeoxyglucose- PET scans of the liver from a representative people with HIV participant, obtained before (baseline), shortly after (∼6 weeks, short-term follow-up) and almost 2 years (long-term follow-up) after ART initiation.
There were mixed changes in liver volume from baseline to long-term in PWH. Together, however, there was weak evidence for change in liver volume (median 1617 and 1485 cm3 respectively, P = 0.036). There were no differences in volume in comparison to control participants either (all P values >0.364) (Fig. S3, https://links.lww.com/QAD/C560).
A limited evaluation of FDG uptake in the spleen found no difference between controls and PWH at any timepoint (all P values >0.587) (Fig. S4, https://links.lww.com/QAD/C561). Longitudinally, there were no changes in spleen SUVmean when all three time points were evaluated (P = 0.717, n = 27). Whenever evaluating all PWH with baseline and short-term scans, we found no change in spleen SUVmean values (P = 0.100, n = 48).
Regression analyses for control and people with HIV combinedAnalyses based on control and baseline PWH values revealed an association between age and SUVmean (r = 0.325, P = 0.007, ω2 = 0.091), but not with HUmean (r = −0.071, P = 0.565, ω2 = −0.010). To determine if this was because of PWH being significantly younger than controls, we performed separate univariable analyses in the control and PWH groups and found that age did not correlate with SUVmean or HUmean in either group (all P values ≥0.08). After excluding age, we performed univariable and multivariable analyses on baseline values only, from the control and PWH groups combined (two outcome measures and nine explanatory variables listed in Table S3A, https://links.lww.com/QAD/C562). BMI and HIV status emerged as having the strongest association with liver SUVmean, individually (r = 0.766, P < 0.0001, ω2 = 0.577; P < 0.0001, ω2 = 0.3270) and together, albeit with different predictive powers (P < 0.0001, ω2 = 0.308; 0.0007, ω2 = 0.063), followed by blood glucose (r = 0.409, P = 0.0005, ω2 = 0.1528). For HUmean, only liver volume showed a correlation (r = −0.410, P = 0.004, ω2 = 0.147) even when combined with other explanatory variables.
Univariable and multivariable analysis of imaging variables with clinical and laboratory measurements in people with HIVUnivariable analyses between imaging-derived measures (SUVmean and HUmean) and clinical and laboratory measures in PWH participants (total of 38 explanatory variables listed in Table S3B, https://links.lww.com/QAD/C562) demonstrated numerous associations of varying degrees. The most prominent associations are shown in Fig. 3. Of the available measures in PWH across all time points, BMI had a positive correlation and glucagon had a negative correlation with SUVmean (r = 0.521, P < 0.0001, ω2 = 0.095 and r = −0.536, P < 0.0001, ω2 = 0.109, respectively). Leptin had a positive correlation and IL-8 had a negative correlation with HUmean (r = 0.417, P = 0.0002, ω2 = 0.046 and r = −0.404, P = 0.0003, ω2 = 0.042). Other indicators of recovery, such as increased albumin and CD4+ cell count and decreased myeloperoxidase (MPO), sCD14, TNF-alpha, and IL-8 correlated with SUVmean and/or HUmean (all P values <0.007, range of ω2 = 0.024–0.095).
 Fig. 3:
 (a) Changes of biomarkers associated with changes in mean standardized uptake values values in people with HIV over time.
When considering measurements of all markers in PWH across time points, BMI and glucagon were the best set of predictors for liver SUVmean, each with distinct predictive value (P = 0.0007, ω2 = 0.042; P = 0.001, ω2 = 0.040). Leptin and IL-8 were the best set of predictors for HUmean when considering all markers (P = 0.002 and ω2 = 0.027 for both).
DiscussionIn this study, we used a combination of PET/CT imaging and clinical biomarkers to assess liver glucose metabolism patterns in treatment-naive late-presenting PWH and subsequent changes after ART initiation, both in the short-term and long-term (∼2 years). We observed that ART-naive PWH with advanced disease showed significantly lower liver FDG uptake at baseline, compared with healthy participants, which partially normalized 2 years following ART initiation (Fig. 2). Those changes in FDG uptake were seen despite no significant change in liver volume or liver density suggesting a metabolic functional rather than structural abnormality associated with HIV infection.
Hepatocytes constitute around 70–80% of the liver cells. The remaining are nonparenchymal cells, such as liver sinusoidal endothelial cells, hepatic stellate cells, Kupffer cells, and various liver-resident lymphocytes [26,27]. FDG accumulation in the liver reflects FDG metabolism in those different cell populations [28]. Thus, it is possible the low liver FDG uptake observed in PWH prior to ART, compared with controls, may represent HIV-associated perturbations affecting glucose metabolism of various liver cell populations.
Previous studies suggest the most affected cells by HIV infection are hepatocytes [26]. Hepatocyte apoptosis is a common mechanism of various liver diseases and is associated with elevated hepatic enzymes, mainly transaminases [26]. Even though HIV RNA has been detected in human hepatocytes ex vivo suggesting potential for infection [29], HIV has also been found to directly cause hepatocyte death through CXCR4 signaling, without infecting the cell [30]. Viral proteins likely play a role in this apoptotic cascade through interaction with CXCR4 on the surface of the hepatocytes [26,30,31]. In a preclinical model of HIV, the dual-reconstituted humanized mouse, HIV infection resulted in hepatocyte dysfunction and death with reduction of albumin levels [13]. Clinically, HIV was found to exacerbate hepatocyte apoptosis in patients with HBV and HCV infection with higher number of hepatocytes expressing the death receptor Fas in co-infected patients [32–34]. In our PWH, transaminases decreased significantly after initiation of ART, even though their pre-ART levels were not too high to begin with and albumin levels increased, positively correlating with increasing FDG uptake. At the same time, liver SUVmean values in our PWH participants correlated negatively with peripheral inflammation. It is thus possible that HIV-mediated hepatocyte apoptosis accounts, at least partially, for the decreased FDG uptake in the pre-ART stage.
The contribution of immune cell dysfunction to decreased liver FDG uptake is less clear. It is well established that HIV causes depletion of CD4+ lymphocytes [35] with CD4+ cell depletion shown in the livers of SIV-infected monkeys [36] and dual-reconstituted humanized mice infected with HIV [13]. It is possible that CD4+ depletion in the liver of our acutely infected patients with very low CD4+ cell counts (<100 cells/μl) at baseline could account partially for decreased FDG uptake, which is supported by the positive correlation between CD4+ cell counts and liver SUVmean in our univariable analysis. Mucosal-associated invariant T cells (MAIT) have also been shown to decline in HIV [37] likely because of exposure to translocated microbial pathogens after breakdown of host defense mechanisms [38]. A similar depletion and functional exhaustion of liver MAITs, which make up 15–39% of the liver's T-cell pool, could have possibly contributed to the decreased liver SUVmean found at baseline in our advanced-stage PWH participants, although this remains speculative. Whether other liver-resident lymphocytes are also depleted in the setting of acute HIV is also unclear.
The most common liver resident macrophage cell line, Kupffer cellss, have also been found to be permissive to HIV infection in vitro and in vivo[14,15,39] and shown to get depleted in HIV immunodeficiency [40] with lower Kupffer cell density in patients with the lowest CD4+ lymphocyte counts [40]. At the same time, however, there is also evidence supporting increased numbers of Kupffer cells in the setting of acute SIV infection albeit with a higher apoptosis percentage [41]. It is, thus unclear whether Kupffer cell-related changes could be related to the decrease in liver SUVmean.
In our multivariable analyses with control and baseline PWH values, BMI and HIV status together best explained liver FDG uptake over any individual measure, each providing distinct predictive power. Also, in univariable analyses of uptake values in PWH, longitudinally, BMI emerged as the best predictor of liver FDG uptake. This is in agreement with previous studies establishing a strong positive relationship between BMI and liver FDG uptake in various clinical settings [42–44]. BMI, however, does not fully explain those changes, as other factors positively correlated with recovery of SUVmean values, such as albumin, which reflects improved hepatocyte function. Factors that negatively correlated with SUVmean included inflammatory markers and glucagon levels. This could hypothetically reflect stimulation of glucagon levels by hypoglycemia and systemic inflammation [45–47] in the acutely sick PWH at baseline, with an eventual reduction as inflammation decreases during recovery following ART initiation.
It's important to mention that SUVmean values also correlated negatively with peripheral levels of MPO, sCD14, and MCP-1, markers of neutrophilic and monocytic activation. This seems counterintuitive as one would expect an inflammatory reaction with increased rather than decreased SUV values in the liver. One possible explanation is that this phenomenon could be similar, although to a lesser magnitude, to liver hypometabolism seen in association with sepsis, which has been postulated to reflect a potentially protective mechanism as reduced cellular metabolism can increase the chances of long-term cellular and organ survival in the face of an overwhelming insult [48,49].
Our study has limitations. Due to the small sample size of control and PWH groups, we could not effectively match for factors, such as age, sex, and BMI. PWH were significantly younger than control participants. Reports have shown mixed results on the relationship between age and liver FDG uptake, describing a positive association [50] or no association at all [51]. Examining values in control and baseline PWH participants, a positive correlation emerged between age and SUVmean. However, given no such correlations between age and liver FDG uptake surfaced when separately analyzing the control and baseline/long-term PWH groups, it is likely the aforementioned positive relationship was driven by the significant age difference between the groups. Although there were more male individuals than female individuals within each group, the male-to-female ratios between PWH and control participants were similar, so we do not believe sex affected our findings in a major way. Another limitation was the partial availability of biomarkers from the retrospective cohort of control participants, preventing the comparison of liver function tests and albumin measurements to PWH. Furthermore, limited information was available on alcohol consumption [52], use of liver-metabolized medication, and potential sociostructural or lifestyle factors that could have affected liver function measures. Lastly, this was a single-center study where most PWH presented at an advanced disease stage prior to beginning ART. A previous study showed PWH with unsuppressed viral loads had higher odds for liver injury compared to those with well controlled values [53]. Without comparisons to PWH with less advanced disease, the abnormalities observed in our PET/CT findings and clinical markers could reflect severe disease characteristics that may not be generalizable to all PWH, though still relevant to our understanding of liver dysfunction in HIV management.
Overall, our findings suggest a multifactorial model for liver injury in PWH characterized by decreased metabolic uptake pre-ART that improves following treatment. It is important to recognize PWH participants in our study had advanced-stage HIV upon presentation where long-term pathological changes involving cellular damage and exhaustion as well as peripheral inflammation can underlie more severe liver abnormalities compared with earlier, less severe stages of HIV. Although long-term ART seems to reverse many aspects of hepatic and metabolic dysfunction, residual liver injury may exist especially in PWH with low nadir CD4+ cell counts, as suggested by liver FDG uptake remaining lower than that of healthy participants. Although we are limited in our ability to confirm what is occurring at the cellular level in our PWH cohort without liver biopsy, we believe PET/CT imaging may be a valuable, noninvasive approach in elucidating liver dysfunction in PWH, warranting further investigation.
AcknowledgementsThe authors would like to thank Dr Nehal Mehta, NHLBI, for his valuable collaboration on this project. The authors also thank PWH and healthy control participants for helping us improve care and understanding of HIV through their participation in our study.
Study funding: This work was supported by the Intramural Research Programs of the Clinical Center (CC), National Heart, Lung, and Blood Institute (NHLBI) and National Institute for Allergy and Infectious Diseases (NIAID), National Institutes of Health (NIH), Bethesda, Maryland, USA.
D.A.H., I.S., T.H., and N.N.M. conceived and designed the study; R.P., Z.W., M.M.M., E.L., M.A., E.L., F.G., A.L., A.R., and D.A.H. evaluated the study participants and/or collected and analyzed the data; P.W. performed the statistical analysis. R.P. wrote the first paper draft. All authors participated in drafting the article and/or revising it critically for intellectual content and gave final approval of
留言 (0)