
記住我

Memory disorder is a common cognitive comorbidity of temporal lobe epilepsy (TLE). Around 50% of the TLE patients suffer greatly from severe memory deficits, the rests remains relatively intact (Helmstaedter & Elger, 2009; Thompson & Corcoran, 1992). In the 1960s, the researchers considered that memory impairment may be related to the damaged integrity of the hippocampus in TLE (Milner, 1968). Since the early 1990s, there has been a shift toward the thinking that the degree of memory impairment is closely associated with the extent of abnormalities in the hippocampal memory circuits (Bell, Lin, Seidenberg, & Hermann, 2011; Saling, 2009; Squire & Zola-Morgan, 1991). Importantly, the heterogeneity of memory performance with TLE may indicate different cognitive phenotypes relate to the whole brain network changes (Dabbs, Jones, Seidenberg, & Hermann, 2009; Kaestner et al., 2019; Rayner, Tailby, Jackson, & Wilson, 2019; Reyes et al., 2019). Cognitive phenotypes have the potential to provide marks for treatment and prognosis. However, it is not well known that whether the “memory-deficits” (MD) and “memory-intact” (MI) phenotypes within TLE have unique patterns of the hippocampal “network” characteristics. Thus, further elucidating the hippocampal network underlying the memory phenotypes may provide individualized strategy for TLE management.
The hippocampal network consists of regions in medial temporal lobe (MTL) and extra-MTL, some of which are believed to be involved in memory processes in TLE. Previous studies using task based functional magnetic resonance imaging (fMRI) techniques in TLE demonstrated that the aberrant functional coupling and activation in the MTL, including the hippocampus, perirhinal cortex (PRC), and parahippocampal cortex (PHC), were closely related to the episodic memory declines (Doucet, Osipowicz, Sharan, Sperling, & Tracy, 2013; Figueiredo et al., 2008; Powell et al., 2007; Vannest, Szaflarski, Privitera, Schefft, & Holland, 2008). Moreover, anterior extra-MTL including regions like orbitofrontal cortex (OFC), amygdala (AMY), and anterior fusiform gyrus (FUS) and posterior extra-MTL including regions like posterior cingulate cortex (PCC), retrosplenial cortex (RSC), precuneus (PREC) anterior inferior temporal cortex (ITC), and angular gyrus (ANG) were reported to be abnormal activation in TLE across different memory process (Addis, Moscovitch, & McAndrews, 2007; Bonelli et al., 2009; Guedj et al., 2011; Hill, King, Lega, & Rugg, 2020; Sidhu et al., 2013). Further studies of large-scale network analysis focusing on the hippocampal network indicated widespread abnormalities of functional connectivity (FC) as well as nodal topological properties, which contribute greatly to identifying memory abilities in TLE (Bettus et al., 2009; McCormick et al., 2014; Roger, Pichat, Torlay, & David, 2020). However, most of previous studies did not consider the important aspect of the functional diversity in this network, as the hippocampus was assessed as a unitary structure.
Recent evidence considered that there are dissociable hippocampal networks along the anterior–posterior axis of the hippocampus (Poppenk & Moscovitch, 2011; Ranganath & Ritchey, 2012; Voets et al., 2014). More specifically, the modularity feature was found in the hippocampal network, suggesting that anterior MTL (e.g., anterior hippocampus and PRC) and posterior MTL (e.g., posterior hippocampus and PHC) are connected with extra-MTL modules through different neuroanatomical pathways. The anterior and posterior MTL implicated in sematic knowledge presentation and scenes/spatial layouts respectively, and their interplay with extra-MTL modules serves as integration for memory system (Ritchey, Libby, & Ranganath, 2015). Our previous study demonstrated that alteration in this conceptual framework contributes to revealing the changes of diverse memory systems in TLE (Li et al., 2017).
The brain network can be characterized by the principles of graph theory analysis, in particular the characteristic of modularity. Typically, modularity can be described as the brain network with a given module partition, presenting spatially separated modules with densely intramodular connections and sparsely intermodular connections (Sporns & Betzel, 2016). In addition, the interactions between specialized brain modules with fluctuating over time were observed by dynamic FC analysis, presenting reoccurring patterns of brain states (Allen et al., 2014; Bosman, Lansink, & Pennartz, 2014; Chang & Glover, 2010; Gonzalez-Castillo et al., 2015). Modular segregation and integration are two basic brain patterns (Friston, 2002), which were reported within the hippocampal network dominating in episodic memory encoding and retrieval, respectively (Cooper & Ritchey, 2019). Investigating modularity features of the hippocampal network and their dynamic fluctuations may provide important evidence for understanding the mechanism of memory impairment in TLE.
Herein, we hypothesized that TLE patients with different memory phenotypes may have distinct functional modular patterns of the hippocampal network during resting. In this study, we used resting-state fMRI and a combination method of graph theory analysis and sliding-window approaches to test this hypothesis. Our aim involves two aspects: (a) whether the hippocampal network has integrated and segregated states during resting and (b) whether the temporal properties of the dynamic hippocampal network can predict memory phenotypes in TLE.
2 MATERIAL AND METHODS 2.1 ParticipantsThis study was approved by the Medical Ethics Committee of the Second Affiliated Hospital, Zhejiang University School of Medicine. (Study No. 2014-151), and written informed consent was obtained from all participants. Then, 79 right-handed subjects, including 66 TLE patients with unilateral hippocampal sclerosis (HS) (left, 35; right, 31) and 31 healthy controls (HC), were consecutively enrolled from April 2014 to January 2020. All patients were referred from the comprehensive epilepsy center in our hospital. Each patient was diagnosed based on the detailed history, neurological examination, video-EEG recordings, and MRI findings. The inclusion criteria included: (a) unilateral HS without other abnormalities on MRI such as cerebral trauma, tumors, vascular malformations, or malformations of cortical development and (b) electroclinical features suggesting ipsilateral TLE. Patients were excluded if they met any of the following criteria: (a) a history of brain trauma or surgery, (b) evidence of an infectious origin, (c) a severe psychiatric disorder, or (d) bilateral TLE. Clinical and imaging data including detailed medical history, scalp video electroencephalogram, routine epileptic MRI, high resolution hippocampal T2WI images, and neuropsychological examination were obtained. HC without neurological or psychiatric disorders were recruited.
2.2 Neuropsychological measurementsImmediate retrieval tests were performed by the Wechsler Memory Scale-Revised, Chinese version. The scores of the verbal paired associates and logical memory tests were added together as verbal memory scores, as well as the scores of the figure memory, recognition and visual reproduction tests were added together as nonverbal memory scores. The total scores of verbal and nonverbal memory were converted into z-scores separately. Impairment was defined as memory z-scores at least 1.5 SDs below the mean HC data. Taking into account the limited sample size, two groups of memory phenotypes would be appropriate for statistical analysis in this present study. In our study, all patients completed each memory subtest. Patients were determined to be impaired in the memory domain if verbal memory or nonverbal memory z-scores fell within the impaired range. Then, 66 patients were classified into 2 groups, within which 35 as MI and 31 as MD (verbal memory impairment: 17, nonverbal memory impairment: 3, both verbal and nonverbal memory impairment: 11).
2.3 MRI acquisitionStructural MRI and resting state fMRI data were acquired using a 3 T Discovery MR750 (GE Healthcare) scanner with an eight-channel head coil in the Second Affiliated Hospital, Zhejiang University School of Medicine. All patients were scanned during the interictal period (at least 3 days after the latest focal seizure and at least 7 days after the latest focal to bilateral generalized tonic–clonic seizure). All subjects were asked to keep their eyes closed, let their mind relaxed during scans. T1 weight structural data were acquired using a high-resolution three-dimensional brain volume (3D-BRAVO) imaging sequence with the following parameters: repetition time (TR)/echo time = 8.2/3.2 ms, inversion time = 450 ms, flip angle = 12°, matrix = 256 × 256, voxel size = 0.47 × 0.47 × 1 mm3 without slice gap, and 206 slices. Resting-state data were obtained using a gradient-echo echo-planar imaging sequence (TR/echo time = 2000/30 ms, flip angle = 77°, matrix = 64 × 64, voxel size = 3.75 × 3.75 × 4 mm3 with no gap, number of slices = 38), for a total of 180 TRs (6 min) or 195 TRs (6.5 min) per scan.
2.4 Analysis 2.4.1 Functional image preprocessingResting-state fMRI data were preprocessed using SPM 12 (www.fil.ion.ucl.ac.uk/spm/) and DPABI software (http://rfmri.org/dpabi). To maintain data consistency, we selected the first 180 brain volumes of each subject for the following analysis. The first 10 scans were removed to stabilize the MRI baseline signal. The following steps include slice-time correction, realignment, spatial normalization with resampling to 3-mm isotropic voxels through T1 weight structural images, linear detrending, regression of nuisance covariates (Friston-24 head motion parameters, white matter, cerebrospinal fluid signals), and temporal filtering (0.01–0.1 Hz). Smoothing was unapplied for avoiding extraction of averaged component with mixed signals that belong to outside ROIs.
2.5 Network constructionROIs of MTL and extra-MTL were defined to construct a hippocampal network. These ROIs comprise the MTL (anterior nodes: anterior hippocampus and PRC); posterior nodes: posterior hippocampus and PHC) and the extra-MTL (anterior nodes: AMYG, anterior FUS, anterior ITC, OFC; posterior nodes: RSC, PCC, PREC, and ANG). The anterior and posterior hippocampus masks were created using voxel-wise correlation analysis. Details of the parcellation of the hippocampus steps are described in our previous study (Xu, Guan, Li, Xu, & Zhang, 2019). The PHC and PRC masks were extracted from an MTL atlas (https://neurovault.org/collections/3731/). The other ROIs were obtained from the Harvard-Oxford Structural Atlas (https://www.fmrib.ox.ac.uk/fsl/data/atlas-description.html). In total, 24 target masks were assigned to ipsilateral and contralateral hemisphere (12 for each hemisphere) subsequently used for the analyses. By generating pairwise Pearson coefficients between each pair of mean ROI time series and proceeding to use Fisher z-transformation (Fz) to stabilize the distribution of Pearson's correlation, we obtained a hippocampal network 24 × 24 Fz weighted matrix for each subject. We flipped the corresponding regions of the right hemisphere to the left hemisphere in right TLE-HS patients and proportionate HC for the following analysis.
2.6 Dynamic functional analysisDynamic functional analysis was performed using DynamicBC toolbox (http://restfmri.net/forum/DynamicBC) with the sliding-window approach and k-mean clustering method (see Supporting Information Figure S1 in Appendix S1). First, to capture the hippocampal network time-varying correlations, we segmented the whole time series into a fixed window with a width of 20 TRs. This setting has demonstrated good balance between the estimation of dynamic connectivity and statistical tests, owing to no suppression of blood oxygenation level-dependent frequency beyond 0.01 Hz (Zalesky & Breakspear, 2015). With a step-wise slide of 1 TR along the 170-TR length scan, we constructed 150 successive 24 × 24 matrices for each subject. The resulting correlation matrices were converted to z-values with Fz.
Second, we used the K-means clustering algorithm to cluster dynamic FC patterns across control and patients together (Lloyd, 1982). This clustering algorithm was repeated 100 times to weaken the impact of local minima (Pascual-Marqui, Michel, & Lehmann, 1995). The correlation distance function was used to measure similarity between FC matrices of different windows since the correlation distance metric is more sensitive to the FC pattern irrespective of magnitude (Damaraju et al., 2014). A K of 2 were obtained using three recognized evaluation indexes (Silhouette, Calinski-Harabasz, and Davies-Bouldin) in a search range of K from 2 to 10 (see Supporting Information Figure S2 in Appendix S1). Afterward, the resulting optimal clusters were indicated as two corresponding cluster centroids, which were regarded as two dynamic FC states across subjects and windows. Using these subjects state vectors (a vector indicating which state each time point is assigned to), we assess the temporal variability of dynamic FC: (a) fractional windows, means the occupancy of each state, which is calculated as a ratio between the number of windows assigned to each state and the number of total time windows; (b) mean dwell time, denotes the window length of the subject staying in certain state, which is calculated as an average of the consecutive number of windows assigned to certain state before changing to the other state; and (c) number of transitions, calculated as the number of windows switching from one state to the other state.
2.7 Static and dynamic modular analysisA predefined module parcellation was applied for the modular analysis of the hippocampal functional networks, including anterior MTL module, posterior MTL module, anterior extra-MTL module and posterior extra-MTL module (see Supporting Information Figure S1 for more detail). This predefined module partition provides an unbiased sample-independent reference for group statistical comparisons and keep a consistent framework for the subsequent modular interaction analysis across static and dynamic states.
We investigated the static modular properties of this hippocampal network in each participant: (a) global modularity value, reflecting the degree to which a set of nodes are operating as distinct networks based on their covariation in activity (see Supporting Information “Global modularity analysis” section in Appendix S1 for more detail) and (b) intramodular and intermodular connectivity, calculated as the mean node-to-node connectivity of all nodes within a module and the mean node-to-node connectivity for each pair of nodes between distinct modules.
For dynamic functional modular analysis, 151 time-varying functional correlation matrices for each subject were transformed into the corresponding Fz weight matrices. Only positive correlations of each windowed correlation matrix were selected to generate dynamic weighted functional networks for each subject. Then, a predefined module partition was applied for calculating intrasubject modular properties of dynamic weighed functional networks. Each window of intrasubject dynamic modular properties was labeled by individual's state vectors described above. For each subject, the modular properties which belong to the same state were averaged to present the state-specific modular pattern.
2.8 Statistical analysisThe Kolmogorov–Smirnov test was used to assess the normality of the demographic and clinical characteristics. Group differences in age, education, age at onset, epilepsy duration, seizure frequency, number of antiepileptic medications, and memory scores were determined using independent t test or Mann–Whitney test. Gender distribution, carbamazepine, and topiramate load between groups were compared using the χ2 test. These analyses were completed using IBM SPSS version 19.
For the modular metrics and temporal properties, the Freal was initially calculated in three groups. Then, the permutation test was performed for ANOVA. We randomly reallocated all subjects to three groups with the same sample size to obtain the Fsurrogate (10,000 permutations). The observed proportions of the Fsurrogate, which was greater than Freal in the null distribution, were detected for estimating the p value. The post hoc analysis was conducted by adjusting on the multiple-group level with Bonferroni correction. After multiple-group level correction, the modular metrics of each state and temporal properties were conducted by adjusting on multiple-metrics level FDR correction separately. Modular metrics of each state included 11 measurements (e.g., global modularity, intramodular connections, intermodular connections). Temporal properties included four measurements (e.g., fractional windows, mean dwell time, number of transitions).
2.9 Validation Although a window size in the range of 30–60 s has been widely used to capture the real variations in the brain connectivity (Allen et al., 2014; Hutchison, Womelsdorf, Allen, et al., 2013; Hutchison, Womelsdorf, Gati, Everling, & Menon, 2013), a mismatch between cut-off frequencies for filtering and the choice of the window length may cause a spurious variability of dynamic FC (Leonardi & Van De Ville, 2015). To validate the stability and robustness of the results, we repeat our analysis using a sliding window approach with different window sizes (15 TRs, 30 TRs, 40 TRs, 50 TRs). To further investigate whether the temporal properties and modular metric differences between two patient groups depended on the side of the epileptogenic zone, the Scheirer–Ray–Hare test was used for 2 (TLE-MI vs. TLE-MD) × 2 (left TLE-HS vs. right TLE-HS) factorial ANOVA. To validate the robustness of dynamic network properties at the individual level, we first performed logistic regression with a backward stepwise selection to identify the most important variables that can discriminate TLE-HS patients between TLE-MI and TLE-MD. The most important variables between two patient groups were selected as input for the logistic regression model. From the resulting logistic model, we conducted the receiver operating characteristic (ROC) analysis to obtain the compositive scores. The best discriminative result was identified by the Youden index. The logistic regression was operated to determine whether dynamic FC variables are superior to hippocampal volumetric variables for classification of TLE-MD versus TLE-MI.The ratio of each side hippocampal volume (HPV) divided by total intracranial volume (TIV) was estimated by individual’s structural MRI and compared between groups (see Supporting Information “Hippocampal volume analysis” section in Appendix S1 for more detail). The model performance was compared by the area under the curve (AUC) for models with significant hippocampal volumetric information only to models that also include the significant dynamic FC variables. The 95% confidence interval test with 10,000 bootstrapped samples was computed for assessing the differences between model AUCs. A superior model was identified if the 95% confidence interval for AUC was above that of the model to be compared.
3 RESULTS 3.1 Demographic profiles and memory functionThere was no difference in age or gender between TLE-HS patients and the HC group. However, the education level was lower in TLE-HS patients (p < .05). No significant differences in age, gender, duration of epilepsy, age at seizure onset, seizure frequency, number of antiepileptic drugs, or lateralization of the epileptogenic zone were observed between TLE-MI and TLE-MD group. Compared to TLE-MD, TLE-MI had more years of education (p < .005). The numbers of carbamazepine (p = .159) and topiramate (p = 0.335) load also did not significantly differ between TLE-MD and TLE-MI. Obviously, verbal memory (p < .0001) and nonverbal memory (p < .01) were significantly impaired in the TLE-HS patients compared to HC. Moreover, the TLE-MD group presented lower verbal and nonverbal memory scores than the TLE-MI group (both p < .0001). In the TLE-MD group, 28 patients (left, 18; right, 10) showed verbal memory impairment, and 14 patients (left, 9; right, 5) showed nonverbal memory impairment. Detailed information is shown in Table 1.
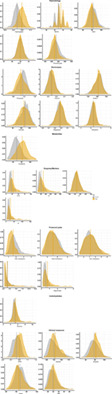
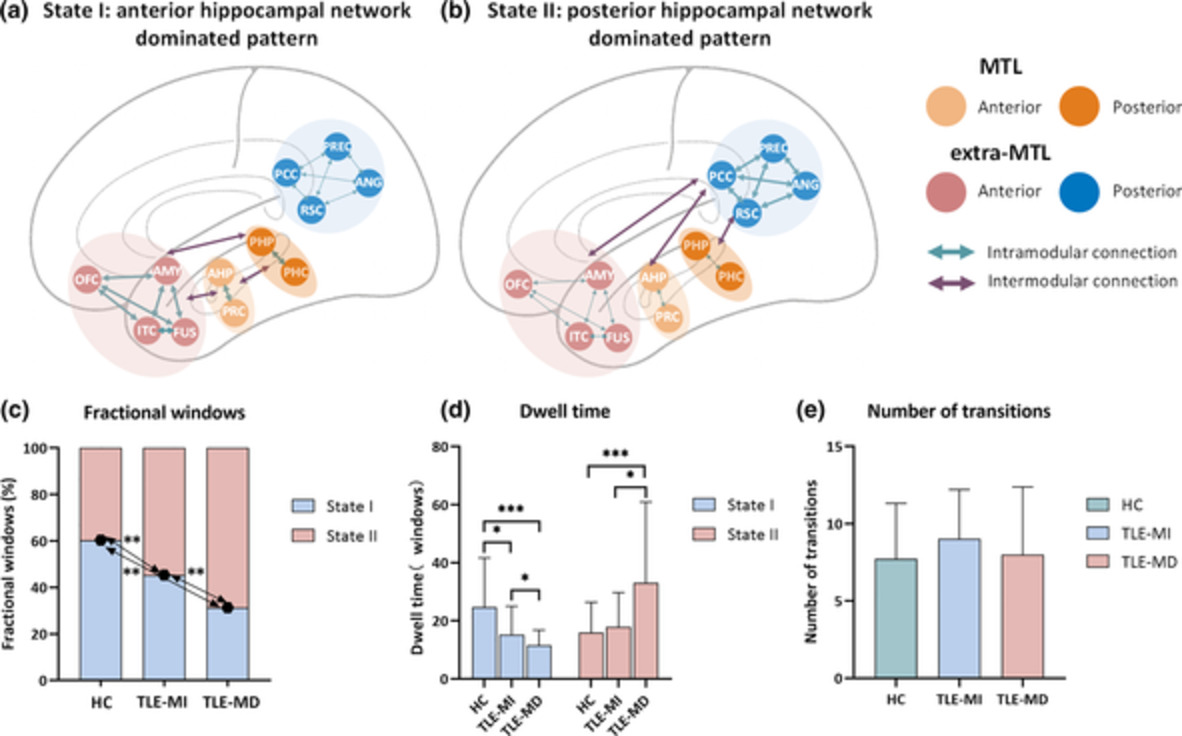
TABLE 1. Summary of demographic and clinical data Item TLE HC p-Value Number (F/M) 66 (38/28) 31 (15/16) .529a Age 30.43 (9.92) 33.87 (10.03) .117b Education 10.98 (3.19) 12.66 (4.29) .042c Verbal memory z-score −1.27 (1.47) 0 <.0001c Nonverbal memory z-score −0.80 (0.99) 0 .001c TLE-MD TLE-MI Number (F/M) 31 (14/17) 35 (24/11) .054a Age 32.84 (10.53) 28.31 (8.97) .067b Education 9.71 (2.93) 12.11 (3.02) .002c Side, L/R 19/12 17/18 .300a Age at onset 17.06 (10.47) 15.00 (8.30) .384b Duration 16.52 (10.06) 13.80 (8.30) .266b Seizure frequency per month 9.24 (22.94) 13.61 (31.17) .827c Numbers of AED 2.19 (0.79) 2.2 (0.90) .847c Patients on carbamazepine 15 (45.2%) 11 (31.4%) .159a Patients on topiramate 3 (3.2%) 1 (5.7%) .335d Verbal memory z-score −2.42 (1.02) −0.18 (0.84) <.0001c Nonverbal memory z-score −1.37 (0.92) −0.22 (0.72) <.0001c Note: SDs are presented in parentheses. Abbreviations: AED, antiepileptic drug; MD, memory deficit; MI, memory intact; TLE, temporal lobe epilepsy. 3.2 Two connectivity states of the hippocampal networkThe dynamic FC was divided into two clusters that represent the transitional hippocampal network states. Figure 1 displays the corresponding visualized connectivity patterns (centroids of clusters) of the two common FC states: a highly modularized state (State I); and a lowly modularized state (State II).

Functional connectivity state results. The centroid of group-specific cluster for each state, averaged across subject-specific median cluster centroids of each group. Respective percentages of occurrences for States I and II: 60.35 and 39.65% in the healthy controls (HC), 45.33 and 54.67% in temporal lobe epilepsy (TLE) with memory intact (MI), 31.32 and 68.68% in TLE with memory deficit (MD). The mean global modularity of State I was higher than that of State II in each group by using paired permutation tests. Each dot represents an individual mean global modularity score. ***p < .001; error bars represent SDs. The hippocampal network is divided into anterior medial temporal lobe (MTL), posterior MTL, anterior extra-MTL and posterior extra-MTL. AMYG, amygdala; ANG, angular gyrus; Ant, anterior; c, contralateral; FUS, anterior fusiform gyrus; ITC, anterior inferior temporal cortex; l, ipsilateral; OFC, lateral orbitofrontal cortex; PCC, posterior cingulate cortex; PHC, parahippocampal cortex; Pos, posterior; PRC, perirhinal cortex; PREC, precuneus; RSC, retrosplenial cortex
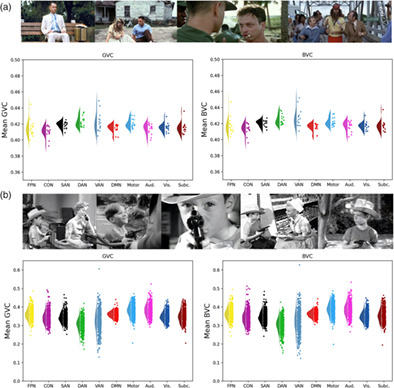
3.3 Temporal properties of FC statesA significant difference on fractional windows was identified among the three groups (F = 15.5766, p < .001). In HC, the fractional windows in State I (60.35 ± 21.71%) was higher than State II (39.65 ± 21.71%). Compared to HC, both TLE-HS groups showed lower fractional windows in State I and higher fractional windows in State II (all p < .01) (Figure 2c). Additionally, we observed lower frequency of occurrence in State I and higher frequency of occurrence in State II in TLE-MD (State I: 31.32 ± 18.36%, State II: 68.68 ± 18.36%) compared to TLE-MI (State I: 45.33 ± 21.75%; State II: 54.67 ± 21.75%, p < .01).

Temporal properties analysis in two discrete functional connectivity states of the hippocampal network. (a) State I is characterized by anterior hippocampal network dominated pattern, which represents positive coupling within/between modules of the medial temporal lobe (MTL) and anterior extra-MTL. (b) State II is characterized by posterior hippocampal network dominated pattern, which represents positive coupling within posterior extra-MTL module, as well as positive correlation between posterior extra-MTL module and each other modules. The percentage of fractional windows (c), mean dwell time (d), and number of transitions (e) in each state is displayed for the healthy controls (HC), temporal lobe epilepsy with memory intact (TLE-MI) patients, and TLE with memory deficit (TLE-MD) patients. All of the significance levels were set to p < .05 with multiple comparisons correction. *p < .05, **p < .01, ***p < .001; error bars represent SDs. AMYG, amygdala; ANG, angular gyrus; FUS, anterior fusiform gyrus; ITC, anterior inferior temporal cortex; OFC, lateral orbitofrontal cortex; PCC, posterior cingulate cortex; PHC, parahippocampal cortex; PRC, perirhinal cortex; PREC, precuneus; RSC, retrosplenial cortex
Significant differences in the mean dwell time of each state were observed among groups (State I: F = 10.7984, p < .001; State II: F = 7.6450, p < .001). The post hoc analysis revealed that the mean dwell time of State I was shortest in TLE-MD and longest in HC (Figure 2d). Accordingly, the mean dwell time in State II was longer in the TLE-MD group than that in HC (p < .005) as well as TLE-MI (p < .05). No differences among groups were found in the number of transitions between states (F = 1.2026, p = .2048) (Figure 2e).
3.4 Static and dynamic modular alteration of the hippocampal network 3.4.1 Overall modular propertiesThe mean global modularity of State I was higher than that of State II in each group by using paired permutation tests (all p < .005) (Figure 1). A significant difference in global modularity was identified in State I among the three groups (F = 2.8926, p < .05). The mean global modularity measured in State I was lower in TLE-MD compared to HC (p < .05) as well as TLE-MI (p < .05). No significant difference in the global modularity was found in either static state or State II among the three groups (static state: F = 1.3263, p = .1498; State II: F = 1.1543, p = .2227).
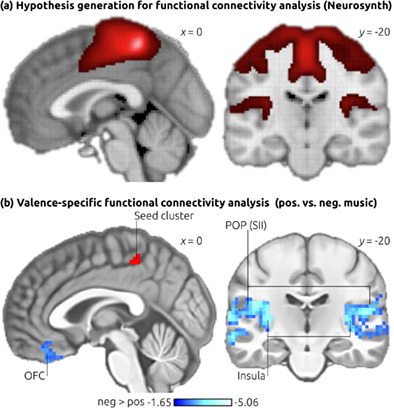
3.4.2 Intramodular and intermodular connectionsIn static state analysis, significant group differences in intramodular communication of anterior MTL (F = 11.9545, p < .0001), posterior MTL (F = 11.2306, p < .0001), and intermodular connections between anterior and posterior MTL (F = 6.1897, p < .005) were found. Intramodular communication of anterior and posterior MTL in both patient groups was decreased (all p < .05). Decreased intermodular connections between anterior and posterior MTL were found in TLE-MD relative to HC (p < .05) (Figure 3).

Modular analysis of the hippocampal network in static state and dynamic functional connectivity states. The matrices present between-group differences in intramodular and intermodular functional connectivity of the hippocampal network for each pair of groups in static state and two discrete functional connectivity states, respectively. The color bar indicates the change in connectivity. All of the significance levels were set to p < .05 with multiple comparisons correction. *p < .05. Ant, anterior; HC, healthy controls; MD, memory deficit; MI, memory intact; MTL, medial temporal lobe; Pos, posterior; TLE, temporal lobe epilepsy
In State I, significant group differences in intramodular communication of anterior MTL (F = 7.2981, p < .005), posterior MTL (F = 6.6068, p < .001), and posterior extra-MTL (F = 5.6142, p < .005) were revealed. We found common reduced intramodular communication of anterior and posterior MTL in both patient groups (all p < .05). Moreover, TLE-MD showed lower intramodular connections of posterior extra-MTL compared with TLE-MI (p < .05) (Figure 3).
In State II, we found significant group differences in intramodular communication of anterior MTL (F = 6.0935, p < .0001) and posterior MTL (F = 9.5985, p < .0001). Significant group differences were also found in intermodular connectivity between anterior and posterior MTL (F = 3.0795, p < .05) and intermodular connectivity between posterior MTL and posterior extra-MTL (F = 3.9456, p < .05). The two patient groups exhibited lower intramodular connectivity of anterior MTL than HC (p < .05). The TLE-MD group had decreased intramodular connectivity within posterior MTL and intermodular connections between anterior and posterior MTL relative to HC (both p < .05). Additionally, the TLE-MD group exhibited lower intermodular connectivity between posterior MTL and posterior extra-MTL relative to the TLE-MI group (p < .05) (Figure 3).
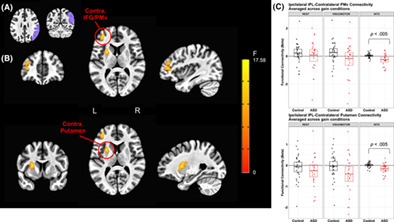
3.4.3 Validation Dynamic FC analysis identified the hippocampal network with dichotomous FC states: a highly modularized state and a lowly modularized state. These connectivity patterns of identified dynamic FC states are highly similar to the original results and across different window sizes. In addition, group comparisons on modular and temporal features of dynamic FC states keep consistent with different window sizes (see Supporting Information Figures S4–S11 in Appendix S1). Through identifying the differences in temporal and modular properties using the 2 × 2 factorial ANOVA, we found that there was a main effect of TLE-MI versus TLE-MD (fractional windows of State I: F = 7.6959, p < .01; mean dwell time of State I: F = 4.1655, p < .05; mean dwell time of State II: F = 4.8681, p < .05; intramodular connections of posterior extra-MTL in State I: F = 7.9755, p < .005; intermodular connectivity between posterior MTL and posterior extra-MTL in State II: F = 8.3179, p < .005), while there were no significant main effects for seizure lateralization or interaction effects (all p > .05). In the discrimination between TLE-MI and TLE-MD, dynamic FC variables of the dwell time in State II and intermodular FC between posterior MTL and posterior extra-MTL were selected. The sensitivity, specificity, AUC value, and p value were 82.9%, 71.0%, 0.842, and p < .001, respectively. The ratio of ipsilateral HPV/TIV was significantly lower in TLE-MD than that in TLE-MI. In the discrimination between TLE-MI and TLE-MD patients, three models were compared to determine whether dynamic FC variables offer unique information for classification of memory impairment. The baseline model including the ratio of ipsilateral HPV/TIV had an AUC significantly above chance (AUC = 0.745, p < .05). The model including dynamic FC variables produced a lager AUC increase (AUC = 0.842) than the baseline model (p < .05). An additional model that included the most important dynamic FC variables as well as the ratio of ipsilateral HPV/TIV performed best (AUC = 0.876) than the other two models (both p < .05) (Figure 4).
Receiver operating characteristic (ROC) curves and area under the curve (AUC) comparing model performance when discriminating temporal lobe epilepsy with memory deficit (TLE-MD) from TLE with memory intact (TLE-MI). (a) The ROC curves associated with three logistic regression models. Models 3 include Model 1 plus Model 2. The red points represent the location of the best discriminative results determined by the Youden index in each ROC. (b) The AUC associated with each ROC curve. Model 2 produced a lager AUC increase (AUC = 0.842) than Model 1 (AUC = 0.745). Model 3 performed best (AUC = 0.876) than the other two models. *p < .05. FC, functional connectivity; HPV, hippocampal volume; TIV, total intracranial volume
4 DISCUSSIONIn this study, we investigated the difference of dynamic modular organization of the hippocampal network among healthy subjects and TLE-HS patients with memory phenotypes in resting-state fMRI. We had three main findings: (a) there are two different connectivity patterns within the hippocampal network, a high modularized state (State I) with anterior hippocampal network dominated pattern, and a low modularized state (State II) with posterior hippocampal network dominated pattern; (b) TLE was prone to drive less State I but more State II, and the tendency was more obvious in TLE-MD; (c) TLE-MD showed more widespread alterations of modular properties compared with TLE-MI across two states, but the measurement was not sensitive to conventional static FC analysis. Dynamic FC approach has attracted growing attention and may be useful for studying the neural basis of cognition (Deco, Jirsa, & McIntosh, 2011; Lurie et al., 2019). It has been indicted that dynamic FC may reflect language as well as memory functional capacity in TLE (Douw et al., 2015; He et al., 2018). In short, our data demonstrated that dynamic FC analysis of resting-state fMRI provided insights into fluctuations of the hippocampal network underlying episodic memory impairment in TLE.
Previous research studies demonstrated that dynamic FC analysis could characterize brain segregated and integrated state during rest in healthy subjects and patients with neuropsychiatric disorders (de Pasquale et al., 2012; Kim et al., 2017). Both states of the default mode network were also reported (Du et al., 2016). Here, our findings revealed the hippocampal network with dichotomous FC states: a highly modularized state (State I) and a lowly modularized state (State II). State I and State II may imply this network segregation and integration. Intuitively, State I represented positive coupling within/between modules of anterior extra-MTL and MTL; State II represent positive coupling within posterior extra-MTL module, as well as positive correlation between posterior extra-MTL module and each other modules. It is possible that the discrepancy in anatomical connections influence the intrinsic patterns of functional coupling, which exhibit dense communications in anterior hippocampal network via direct projections and sparse communications in posterior hippocampal network via polysynaptic projections (Poppenk & Moscovitch, 2011; Ranganath & Ritchey, 2012; Ritchey et al., 2015). Briefly, our data that State I had a higher mean global modularity than State II supported the hypothesis that the hippocampal network have segregated and integrated states, and we further indicated that State I was characterized by anterior hippocampal network dominated pattern, and State II was characterized by posterior hippocampal network dominated pattern. However, more evidence is required to confirm the possible mechanism.
Compared to controls, both patient groups have a similar tendency characterized by a reduced occurrence of State I, paralleled by an increased expression of State II. This is in line with the changed temporal properties that patients have a decrease in the dwell time patterns of State I, as well as a corresponding increase of dwell time of State II. Overall, these observations seem to corroborate previous evidence for a selective vulnerability of anterior hippocampal networks in TLE-HS. It is conceptually understandable that the epileptogenic network mainly occurred in anterior part of hippocampus may represent abnormalities of structure and function in the anterior hippocampal network in TLE-HS (Barnett, Man, & McAndrews, 2019; Bernasconi et al., 2003; Bernhardt, Bernasconi, Concha, & Bernasconi, 2010; Scanlon et al., 2013). Neuronal loss in the hippocampus may exert a cascading effect that induces proximal and remote limbic de
留言 (0)