
記住我

The function of a brain region is characterized in part by the dynamic patterns of connectivity that it has with other regions within and outside its neural network (Uddin, 2015). Studies investigating functional connectivity of the salience network (SN) demonstrate that the SN plays an important role in social behavior (Seeley, Menon, et al., 2007; Toller et al., 2018). However, functional connectivity analysis does not inform on causality or directionality of communication, even though information asymmetry plays a key role in brain network dynamics (Park & Friston, 2013). Dynamic causal modeling (DCM) yields better information on directional, or effective, connectivity within these networks. While earlier approaches of DCM applied only to task-based imaging, recent advances using spectral DCM have enabled investigators to use task-free functional imaging data as well, which can be used to model information flow among nodes of resting-state networks (Sharaev, Zavyalova, Ushakov, Kartashov, & Velichkovsky, 2016; van de Steen, Almgren, Razi, Friston, & Marinazzo, 2019). Since then, multiple studies have yielded novel insights in linking effective connectivity with behavior (Battistella & Simonyan, 2019; Cui et al., 2015; Li et al., 2020; Nicholson et al., 2017; Sokolov et al., 2018, 2020; Wei, Wu, Bi, & Baeken, 2020). Therefore, modeling causal and directional information flow in the SN and comparing patterns among neurotypical individuals and patients with social behavior deficits may be important to better understand how network dynamics are involved in social functioning, and how they change in disease.
The SN is predominantly comprised of regions in the limbic and paralimbic system, and plays an important role in integrating the homeostatic status of the body with information from other cognitive and affective systems. This facilitates interoceptive awareness and enables selection of appropriate behavioral responses based on the internal state of the body and external demands (Seeley, 2019; Seeley, Menon, et al., 2007). The SN has a particularly important role in managing socioemotional processes, which is evident from behavior deficits in behavioral variant frontotemporal dementia (bvFTD) patients, who develop striking impairments in socioemotional behavior (Seeley, Allman, et al., 2007; Zhou et al., 2010), and have focal neurodegeneration affecting the SN, including the dorsal ACC, anterior insula, periaqueductal gray (PAG), dorsomedial thalamus, and hypothalamus, with right stronger than left in early disease and extending throughout the frontal lobe as disease progresses (Rosen et al., 2002; Seeley, Menon, et al., 2007). SN functional connectivity also seems to play a role in healthy individuals' socioemotional sensitivity, as described by Toller et al. (2018). From anatomical and functional connectivity studies, Seeley et al. (2012b) assembled a working model of how SN nodes are expected to dynamically influence each other directionally, and how this system is expected to break down in bvFTD. However, network dynamics among all SN nodes have not been investigated; directional connectivity has been modeled for cortical SN nodes only (Bajaj & Killgore, 2021; Ham, Leff, de Boissezon, Joffe, & Sharp, 2013; Lamichhane & Dhamala, 2015). Additionally, the relation between SN network dynamics and behavior has thus far been investigated for the construct of “emotional intelligence,” but not for more specific social behavior constructs. One aspect of social function, sensitivity to others' subtle socioemotional cues, relies heavily on the formation of visceral responses to social signals. Previous work suggests that SN, and specifically the PAG, plays an important role in this (Toller et al., 2018). To regulate autonomic functions of the peripheral nervous system, the PAG and other “central pattern generators” (CPGs) (Sturm et al., 2018) generate stereotypical “fight,” “flight,” or “freeze” behavior (Grillner, 2006; Saper, 2002), and contribute to emotional responses more broadly. This function of the PAG could be especially important in social contexts by initiating social responses to subtle stimuli and providing a foundation for more complex social behaviors (Damasio & Carvalho, 2013; Motta, Carobrez, & Canteras, 2017).
In this study, we hypothesized that among healthy older adults, different patterns of effective PAG connectivity to other parts of the SN would influence the ability to detect subtle socioemotional cues, and that bvFTD patients with focal SN dysfunction would show different effective connectivity patterns than healthy individuals. Since bvFTD is associated with gray matter volume reduction and white matter disruptions (Whitwell, Avula, & Vemuri, 2010), we anticipate that structural lesions likely contribute to functional changes. However, the relationships among structure and function are highly complex in neurodegenerative disease (Bonakdarpour, Rogalski, Wang, Sridhar, & Hurley, 2017; Harrington et al., 2015) and in brain functioning in general (Damoiseaux & Greicius, 2009), and multimodal imaging would be required to disentangle the underlying cause of functional connectivity changes, which is beyond the scope of the current study. The goal of this study is to evaluate the impact of circuit disruption, independently of the structural changes that might contribute to this in neurodegenerative disease. To test these hypotheses, we used spectral DCM to identify the causal and asymmetric resting-state network dynamics of the SN, in combination with an observer-based measure of socioemotional sensitivity. We first modeled the average SN effective connectivity strength from resting-state data in older normal controls (ONC) and bvFTD patients, and investigated the differences between these groups. Next, we analyzed the relationship between each individual's connectivity estimates and their scores for social sensitivity. We examined whether PAG output toward other SN nodes or PAG input from other SN nodes predicted socioemotional sensitivity. Lastly, we used a clustering method to examine individual variation in patterns of SN effective connectivity among healthy older adults, and investigated how bvFTD patients mapped onto these commonly occurring patterns.
2 METHODS 2.1 ParticipantsFifty-three patients with bvFTD were initially selected for this study and matched based on age and sex with 50 ONCs. For the ROI sphere size that was selected in this study, nine bvFTD patients' and six ONCs' time series did not meet the model-based uncorrected p < .05 signal threshold (Zeidman, Jafarian, Corbin, et al., 2019), which indicated insufficient signal. They were therefore excluded from the selected sample. This resulted in inclusion of a final sample of 44 bvFTD patients and 44 ONCs. The bvFTD patients were diagnosed by a multidisciplinary team of neurologists, neuropsychologists and nurses after thorough assessment of neurological, neuropsychological and neuroimaging results using the FTDC criteria (Rascovsky et al., 2011). ONCs were only included when an unremarkable neurological exam was established, together with normal structural brain imaging results, and cognitive functioning within the normal range. All behavioral measures and informant ratings were obtained within an average number of 13 ± 23 days of the participants' fMRI scans. All participants were enrolled in research at the Memory and Aging Center (MAC) of the University of California San Francisco (UCSF). The Committee on Human Research at UCSF approved the study, and prior to testing all participants gave voluntary written informed consent, giving permission to use the collected data for analysis.
2.2 Revised self-monitoring scaleThe revised self-monitoring scale (RSMS) is a 13-item questionnaire that measures sensitivity to subtle socioemotional expressions of others and the tendency to modify behavior based on these social cues (Lennox & Wolfe, 1984). RSMS items are categorized into two subscales, of which one assesses the sensitivity to expressive behavior of others (EX), and includes statements such as “The subject can usually tell when he/she said something inappropriate by reading it in the listener's eyes.” We expected that a focus on the internal representation of social cues would best elucidate the contribution of the SN to social sensitivity, thus the RSMS EX was used as the primary outcome measure for the study. Informants (family members or friends who had known the participant for > 5 years) were asked to complete the measure, describing the study participant by rating items from “certainly, always true” to “certainly, always false” using a 6-point Likert scale.
The psychometric properties of the RSMS have been extensively investigated, and showed good internal reliability of all RSMS items combined, as well as for each subscale separately (Day, Schleicher, Unckless, & Hiller, 2002; Lennox & Wolfe, 1984; O'Cass, 2000). The instrument also reflects adequate test–retest reliability (Anderson, 1991), and correlates positively with scales that measure traits considered to benefit from strong self-monitoring, such as self-esteem (Miller, Omens, & Delvadia, 1991; Wolfe, Lennox, & Cutler, 1986), leadership skills (Ellis, 1988) and job performance (Day et al., 2002), and correlates negatively with traits such as shyness and social anxiety (Wolfe et al., 1986).
A number of studies that examine behavioral impairments in neurodegenerative disease showed that informant ratings on the RSMS are notably sensitive to social deficits associated specifically with bvFTD (Franklin et al., 2021; Shdo et al., 2016; Toller et al., 2018, 2020). In comparison to healthy individuals and other dementia syndromes, bvFTD patients are evaluated to be particularly insensitive to social cues (Shdo et al., 2016; Toller et al., 2018). This insensitivity seems to accurately delineate disease severity as well, which reflects the RSMS' strong potential to contribute to differential diagnostics in clinical setting (Franklin et al., 2021; Toller et al., 2020). More important for the current study, multiple studies using different neuroimaging models have shown that RSMS scores are strongly correlated with the SN ICN in neurodegenerative disease. Shdo et al. (2016) showed a linear relationship between the RSMS and gray matter volume in structures part of the SN, Toller et al. (2021) showed evidence that higher RSMS scores predict white matter integrity between SN structures, and Toller et al. (2018) also found that functional connectivity strength in the SN is directly linked to higher RSMS. In summary, these studies reflect that the RSMS is a robust scale to differentiate bvFTD from other dementias, to assess disease severity for this syndrome, and to assess brain lesions caused by the disease, which is relevant to the goal of the current study.
2.3 Image acquisition and preprocessingStructural and functional scans were acquired using a 3 T Siemens Trio scanner at UCSF. A T1-weighted 3D magnetization prepared rapid gradient echo (MPRAGE) sequence was used to obtain the structural images, with parameters as follows: 160 sagittal slices, 1-mm thick, skip = 0 mm; repetition time = 2,300 ms; echo time = 2.98 ms; flip angle = 9°; field of view = 240 × 256 mm2; voxel size = 1 mm3; matrix size = 256 × 256. Two-hundred and forty task-free functional MRI volumes were obtained over 8 min, during which participants were instructed to relax with their eyes closed, using a T2*-weighted gradient echo-planar imaging sequence (repetition time = 2,000 ms; echo time = 27 ms; flip angle = 80°; field of view = 230 × 230 mm2; inplane voxel size = 2.5 mm2; matrix size = 92 × 92). Functional imaging data were analyzed using Statistical Parametric Mapping (SPM)12 (The Wellcome Centre for Human Neuroimaging, n.d.) and the FMRIB Software Library (FSL) (Analysis Group FMRIB, n.d.) After discarding the first five volumes to allow for magnetic field stabilization, functional images were slice-time corrected, spatially realigned, co-registered to each participant's structural T1-weighted image, normalized to the Montreal Neurological Institute T1 (MNI) template using SPM segment, re-sampled at a voxel size of 2 mm3, and smoothed with a 6 mm full-width at half-maximum Gaussian kernel. Co-registered scans were visually inspected to identify scans with poor co-registration. Participants' scans that failed visual inspection through group consensus were excluded from the sample. An additional quality control step included inspection of motion during scanning. Since head motion can cause systematic but spurious correlations (Power, Barnes, Snyder, Schlaggar, & Petersen, 2012), only participants with a maximum translational movement of ≤3 mm, maximum rotational movement of ≤3°, and maximum displacement of ≤3 mm between functional volumes were included into the study. Mean root-mean-square of volume-to-volume changes in translational (in mm) and rotational (mean Euler angle) movement were calculated since these metrics can be associated with functional network connectivity strength (Table 1). A CSF mask in the central portion of the lateral ventricles, and a white matter (WM) mask based on the highest probability in the FMRIB Software Library (FSL) tissue probability mask were used to extract mean CSF and WM time series.
TABLE 1. Demographics and clinical characteristics of participants (N = 88) M (SD) ONC bvFTD p value R2 N 44 44 Age 65.2 (5.1) 61 (8) .004 .09 Sex (M/F) 26/18 26/18 — — MMSE total score 29.3 (0.9) 23.9 (5.2) <.001 .32 CDR global score 0 (0) 1.1 (0.6) <.001 .62 CDR sum of boxes 0 (0) 6.1 (2.9) <.001 .65 RSMS EX (max = 30) 20.5 (3.5) 9.5 (6.7) <.001 .52 Average max translational movement (in mm) 0.8 (0.4) 0.9 (0.5) .38 .009 Average max rotational movement (mean Euler angle) 0.6 (0.5) 1 (0.7) .01 .07 Note: Statistical difference between bvFTD patients and ONCs was calculated using post hoc Dunnett–Hsu test. Abbreviations: bvFTD, behavioral variant frontotemporal dementia; CDR, clinical dementia rating; EX, sensitivity to socioemotional expressiveness score; MMSE, Mini Mental State Examination; ONC, older normal controls; RSMS, revised self-monitoring scale. 2.4 Spectral DCM with PEB 2.4.1 Time series extractionThe preprocessed functional images were analyzed with a linear model containing a discrete cosine basis set with 58 functions with frequency characteristics of resting-state brain dynamics (0.0078–0.1 Hz) (Fransson, 2005; Kahan et al., 2014) including six head motion parameters as well as WM and CSF signals as covariates of no interest. We specified an F-contrast across the discrete cosine transforms (DCT), producing an SPM that identified regions exhibiting blood-oxygen-level-dependent (BOLD) fluctuations within the frequency band.
2.4.2 ROI identificationTo choose the most optimal ROI size, we calculated for each participant if the time series data of ROIs ranging from 2 to 8 mm in radius would pass the required signal threshold of p < .05 uncorrected within the model. This analysis of the data showed that over 25% of the sample had to be excluded when selecting ROI sizes smaller than 8 mm, whereas an ROI size of 8 mm had less detrimental effects of <15% exclusion. Thus, ROIs of 8 mm in radius were created using the MARSBAR toolbox for SPM (Brett, Anton, Valabregue, & Poline, 2002). This size selection was supported by careful examination of work by a number of research groups (Li et al., 2017; Sharaev et al., 2016; Sokolov et al., 2018, 2020, 2019), including spectral DCM validation studies (Razi, Kahan, Rees, & Friston, 2015; Razi, Seghier, Zhou, Mccolgan, & Zeidman, 2018), and DCM studies that included subcortical structures such as the PAG (Roy et al., 2014; Sevel, Craggs, Price, Staud, & Robinson, 2015) which all yielded meaningful results when applying an ROI of 8 mm. Additionally, a study that investigated the direct influence of 4, 8, 12, or 16 mm ROI radius sizes in the default mode network (Almgren et al., 2018) found that results between ROI sizes were very similar. This suggests that ROI size selection does not have large influence on final results.
The 8 mm ROIs were centered around a previously published gray matter atrophy peak in the right ventral anterior insula (AI) (42, 17, −10) in early bvFTD (Seeley, 2010; Seeley et al., 2008), and a corresponding ROI was defined for the ventral AI in the left hemisphere (−42, 17, −10). In addition, using coordinates from two recent neuroimaging meta-analyses (Beissner, Meissner, Bar, & Napadow, 2013; Linnman, Moulton, Barmettler, Becerra, & Borsook, 2012), ROIs were defined in the bilateral dorsomedial thalamus (±4, −16, 8), bilateral hypothalamus (±4, −6, −10), and the bilateral amygdala (±20, −8, −12), and ROI coordinates for the midline structures, that is, the ACC (2, 10, 40) and the PAG (2, −32, −5) were placed in the right hemisphere to limit CSF inclusion. Thus, 10 ROIs were selected in total (see Figure S3 for an illustration). For each region, the principal eigenvariate was computed from the radius sphere centered on each regions' peak F-value and was adjusted for the motion confounds. Participants that had insufficient time-series signal at a threshold of p < .05 uncorrected in one or more ROIs were excluded from the data, which were 15 participants in total.
2.4.3 First level model specification and inversionTo examine the causal and directional influence that SN nodes have on each other, we performed spectral DCM with resting-state data, in combination with the Parametric Empirical Bayes (PEB) framework in MATLAB (ver. R2019a) (Friston et al., 2016; Zeidman, Jafarian, Corbin, et al., 2019; Zeidman, Jafarian, Seghier, et al., 2019). Spectral DCM is distinct from stochastic DCM, in that it uses second order statistics (cross-spectra) rather than the original time-series data. This has the consequence that the time-dependent random fluctuations that are important in resting-state data are not treated as stochastic noise. Rather, spectral DCM relies on a static assumption (deterministic), making it more suitable for analysis with resting-state data (Friston, Kahan, Biswal, & Razi, 2014; Razi et al., 2015). Since bvFTD patients have structural and functional network changes in the SN resulting from neurodegenerative disease, we expected the DCM models for bvFTD patients to differentiate from the ONC models. We therefore estimated the DCMs for ONC and bvFTD patients separately in all levels of our DCM analysis, that is, first, second, and third level.
DCM starts with model specification, which is often based on results from existing literature. Previous studies focused on the cortical nodes of the SN (e.g., bilateral vAI and ACC), but did not include subcortical nodes, and focused on healthy controls rather than patients with neurodegenerative disease (Bajaj & Killgore, 2021; Ham et al., 2013; Lamichhane & Dhamala, 2015). Since we had no prior knowledge of effective connectivity patterns in all SN nodes (i.e., cortical and subcortical), we specified a hypothesis-free fully connected model. In other words, our model estimated 100 possible connectivity parameters, including 10 recurrent self-connections from each node. This step was done for all bvFTD patients and ONCs based on their individual hemodynamic connectivity patterns within and between SN nodes (Zeidman, Jafarian, Corbin, et al., 2019). To find the optimal model fit in terms of tradeoff between accuracy and complexity, individual DCM models were estimated using Bayesian model inversion, which updates the model after every iteration, generating first-level DCM estimates for each individual for each effective node pair connection. To test the accuracy of the DCM model estimation, the percentage of variance explained by each model for each individual was calculated (Zeidman, Jafarian, Corbin, et al., 2019). The completed first-level PEB files can be accessed in Dryad public repository (Rijpma et al., 2021).
2.4.4 Second level PEB analysis and Bayesian model averagingWe used the second level PEB framework to specify linear models representing each group's average effective connectivity and implemented Bayesian model averaging over this framework to account for model uncertainty. Effective connectivity matrices were generated with R Studio (ver. 1.2.5001) and display each group's node-to-node and self-connection (Figure 1). Positive values for the node-to-node connection represent activation, and negative values represent inhibition. For the self-connections this is reversed; positive values represent self-inhibition, and negative values represent self-activation (Zeidman, Jafarian, Seghier, et al., 2019). For the statistical assessment of significance of these probabilistic models, we used a posterior probability of Pp = .99, indicating very strong evidence (Kass and Raftery, 1995).

Matrices of mean effective connectivity of the ONC and bvFTD group and bvFTD compared with ONC, accompanied with schematic overviews of the effective connectivity results (thickness of lines equal the effective connectivity strength between node pairs). (a) At a Pp = 0.99, the ONC effective connectivity model shows reciprocal connections among the cortical vAI and ACC nodes. All subcortical bilateral counterparts are reciprocally connected as well. Self-connections are all self-inhibiting, except for the PAG. (b) At a Pp = 0.99, the bvFTD effective connectivity model shows reciprocal connections between the cortical SN nodes as well, as well as between the bilateral thalamic nodes. Self-connections are self-inhibiting in the bilateral hypothalamic nodes, the left thalamic node, the right vAI, and in the ACC, but are not significantly different in bilateral amygdala, right thalamus, and PAG. (c) The effective connectivity model of the bvFTD group compared with the effective connectivity model of the ONC group showed that at a Pp = .74 there was significantly weaker activation for the bvFTD group among (right) cortical nodes and subcortically between the bilateral thalamic nodes. Effective connectivity from the right to the left hypothalamus was significantly lower as well, and self-connections were less self-inhibiting in the right vAI, left hypothalamus and bilateral thalamic nodes. ACC, anterior cingulate cortex; amy, amygdala; bvFTD, behavioral variant frontotemporal dementia; hypo, hypothalamus; L, left; ONC, older normal controls; PAG, periaqueductal gray; Pp, posterior probability; R, right; thal, thalamus; vAI, ventral anterior insula
2.4.5 Third level PEB analysisSince structural and functional brain changes in bvFTD patients caused by neurodegenerative disease can have unwanted influence on model estimation, we modeled the second level PEB parameters of each individual at a third level, that is, a PEB of PEBs (Park, Friston, Pae, Park, & Razi, 2018; Zeidman, Jafarian, Seghier, et al., 2019) by generating (Bayesian) linear regression models that represent the difference for bvFTD compared with ONC. For the third level PEB, which requires greater statistical power to detect significant results than is required by the second level PEB analysis, we set a lower threshold of evidence at a posterior probability of Pp = .74, which is considered significant and reflects positive evidence (Kass and Raftery, 1995). Matrix figures were generated with R Studio (ver. 1.2.5001) and scripts for analysis and visualization are accessible in GitHub (Rijpma, 2021a, 2021b).
2.5 Effective connectivity of the PAG in relation to the RSMS EX score 2.5.1 PAG summary and single effective connection estimates predicting RSMS EX scoreAs a data reduction step, we calculated summary variables using SAS software (ver. 9.4) from each individuals' DCM connectivity parameter estimates by adding all effective node connections from the PAG to other SN nodes together (PAG output estimate) and adding all the effective connections from other SN nodes to the PAG (PAG input estimate). We derived separate cortical and subcortical input and output estimates, where the cortical estimates consisted of connections from the PAG to the ACC and bilateral vAI, and the subcortical estimates consisted of connections from the PAG to the thalamus, hypothalamus, and amygdala. The summary estimates were controlled for outliers. All subjects with a z-score of the summary estimates larger than 3 SDs from the mean were excluded. This resulted in exclusion of one bvFTD patient and one ONC. Using SAS software version 9.4, we first analyzed whether the PAG input and output summary estimates of the whole sample significantly predicted the RSMS EX score by running linear models controlling for age, rotational movement and diagnostic group, and repeated this step using the cortical and subcortical summary estimates. We also calculated the correlation between these subcortical and cortical summary estimates using Pearson's correlation coefficients for each diagnostic group separately. To further examine PAG effective connections with bilateral single SN nodes, we added effective connectivity estimates of same structures together (e.g., left and right amygdala nodes with the PAG) separately for input from and output to the PAG.
As a final exploratory analysis to confirm that we had not missed important predictors of RSMS occurring beyond the PAG connections, we also analyzed contribution across all single effective node connections to the RSMS EX score. Self-connections were excluded in this analysis, resulting in 90 comparisons in total. Due to the exploratory nature of this analysis and the large number of pairwise comparisons involved, the Benjamini–Yekutieli (B–Y) method was used as an FDR controlling procedure for multiple comparisons, with a threshold of p < .00942 for 90 comparisons (Narum, 2006).
2.5.2 Cluster analysis with PAG summary estimatesTo identify systematic variation (i.e., subgroups) among healthy older adults with respect to their patterns of effective connectivity, we performed in MATLAB (ver. 2019a) a k-means clustering analysis with the ONCs' cortical and subcortical summary variables. Selecting these summary variables (i.e., cortical and subcortical) enabled us to include all SN effective connections in an efficient way. The appropriate number of clusters were identified based on the best average silhouette values per number of cluster groups and a visual check of the cluster silhouette plots. To identify how bvFTD patients' estimates for the cortical and subcortical summary variables differed from the ONC estimates, we then used the smallest pairwise Euclidean distance between centroids of the ONC clusters and the bvFTD estimates to establish cluster membership of the bvFTD group based on the ONC clusters. Next, we identified linear models using SAS software (ver. 9.4) for the ONC group and for the full sample to test whether cluster membership could predict performance on the RSMS EX score in health and in disease. Finally, we established whether a significant difference existed between ONC cluster membership and bvFTD cluster membership using a χ2 analysis using SAS software (ver. 9.4) as well. Scripts for these analyses are available in GitHub (Rijpma, 2021c).
3 RESULTS 3.1 Demographics and clinical characteristicsThe ONC group (65.2 ± 5.1) was statistically significantly older than the bvFTD group (61.0 ± 8.0; p = .004), however the average difference between groups was small (≈4 years) and therefore unlikely to have meaningful influences on the results. There were no significant sex differences between groups; in both groups 26 males and 18 females were included. Scores on the MMSE and CDR were significantly different between the bvFTD and ONC group, which was in line with the expected functional impairment for bvFTD patients. On the CDR global score, bvFTD patients scored 1.1 ± 0.6, and on the CDR sum of boxes 6.1 ± 2.9. For both CDR measures, the ONCs had a score of 0. On the MMSE, bvFTD patients scored 23.9 ± 5.2, whereas ONC scored 29.3 ± 0.9 (Table 1).
3.2 Group average effective connectivity strength of each SN node connection 3.2.1 Effective connections in the ONC groupAt a posterior probability of 99%, within-group effective connections for ONCs were all excitatory except for the right thalamus to right vAI connection, and a total of 27 effective connections were identified. This demonstrates that SN nodes generally have an activating influence on each other (Figure 1a). Similarly to the results in the DCM studies by Ham et al. (2013) and Lamichhane and Dhamala (2015), SN nodes were reciprocally connected among the cortical nodes. Additionally, the subcortical contralateral ROI (e.g., left with right amygdala) were all reciprocally connected as well. All self-connections showed statistically significant self-inhibition, except for the PAG node. Nodes with higher levels of self-connection are understood be comparatively less responsive to inputs from other nodes (Zeidman, Jafarian, Corbin, et al., 2019), thus this result suggests that the PAG may be more responsive than other SN nodes. The percentage of explained variance reflected high accuracy of the DCM model for the ONC group; the average percentage of variance explained when fitting the DCM model-estimates to the cross-spectra was 68.50% (SD = 22.30%), with a minimum of 41.21% and a maximum of 90.24%.
3.2.2 Effective connections in the bvFTD groupAt a Pp of 99%, there were 28 significant within-group effective connections for bvFTD patients, which were all excitatory (Figure 1b). The cortical nodes were all reciprocally connected, as well as the bilateral nodes of the hypothalamus. Self-connections were self-inhibiting in cortical, hypothalamic, and the left thalamus nodes, which indicates that these nodes are not very receptive for input from other nodes. The remaining nodes (i.e., amygdala, PAG, and right thalamus) were not significantly self-inhibiting or self-activating, suggesting that these nodes are more receptive for input than the other SN nodes. Furthermore, the percentage of explained variance reflected that the estimated DCM model for the bvFTD group is highly accurate; the average explained variance when fitting the DCM model-estimates to the cross-spectra was 66.44% (SD = 13.82%), with a minimum of 34.25% variance explained and a maximum of 94.85%.
3.2.3 Differences in effective connectivity for bvFTD patients compared with ONCsAt a Pp of 74%, the bilateral effective connections between the insular nodes, and bilateral connections between the thalamic nodes were significantly lower for bvFTD patients compared with ONCs, as well as the reciprocal connection between the ACC and the right vAI, and effective connection from the right to the left hypothalamus (Figure 1c). Furthermore, self-connectivity in the right vAI, left hypothalamus, and bilateral thalamic nodes were significantly less self-inhibiting for bvFTD patients (compared with ONCs), which reflects that these nodes are more receptive for input from other SN nodes in bvFTD compared with ONC.
3.3 Role of effective PAG connections in socioemotional sensitivity 3.3.1 PAG summary estimates in relation to the RSMS EX scoreSummary variables were calculated based on the entire sample (bvFTD and ONC) from individuals' DCM connectivity estimates. The summary variable of the entire sample representing PAG output toward other SN nodes significantly predicted higher RSMS EX score [R2 = .56, F(2,83) = 6.64, p = .012], while the PAG input summary variable of the entire sample did not. The summary variables of the whole sample group were also divided into cortical and subcortical nodes. Output to cortical nodes significantly predicted higher RSMS EX score [R2 = .57, F(2,83) = 7.34, p = .0082], but input to cortical nodes did not. Both PAG output and PAG input to subcortical nodes did not significantly predict the RSMS EX score, and when further evaluating this by using summary variables of single bilateral SN nodes (to and from the PAG), only the summary variable representing PAG output to the thalamic nodes predicted higher RSMS EX score [R2 = .16, F(2.83) = 5.50, p = .024], and in ONCs only. All analyses were controlled for age, movement during scanning (mean Euler angle), and diagnostic group membership. See Figure S1 for all results.
3.3.2 Single PAG effective connections in relation to the RSMS EX scoreNext, we examined the contribution of each effective node-to-node connection that includes the PAG, separately for the ONC and the bvFTD group. For the ONC group, PAG output to the ACC (R2 = .18, F = 6.76, p = .013) and right vAI (R2 = .18, F = 6.24, p = .017) significantly predicted higher RSMS EX score, as well as PAG output toward the left (R2 = .15, F = 4.69, p = .037) and right thalamic nodes (R2 = .18, F = 6.24, p = .017). Input from the right hypothalamus to the PAG (R2 = .21, F = 8.02, p = .0073) predicted lower RSMS EX score. For the bvFTD group, PAG output toward the left vAI predicted higher RSMS EX scores (R2 = .23, F = 7.89, p = .0074). These effects were controlled for age and movement during scanning (mean Euler angle).
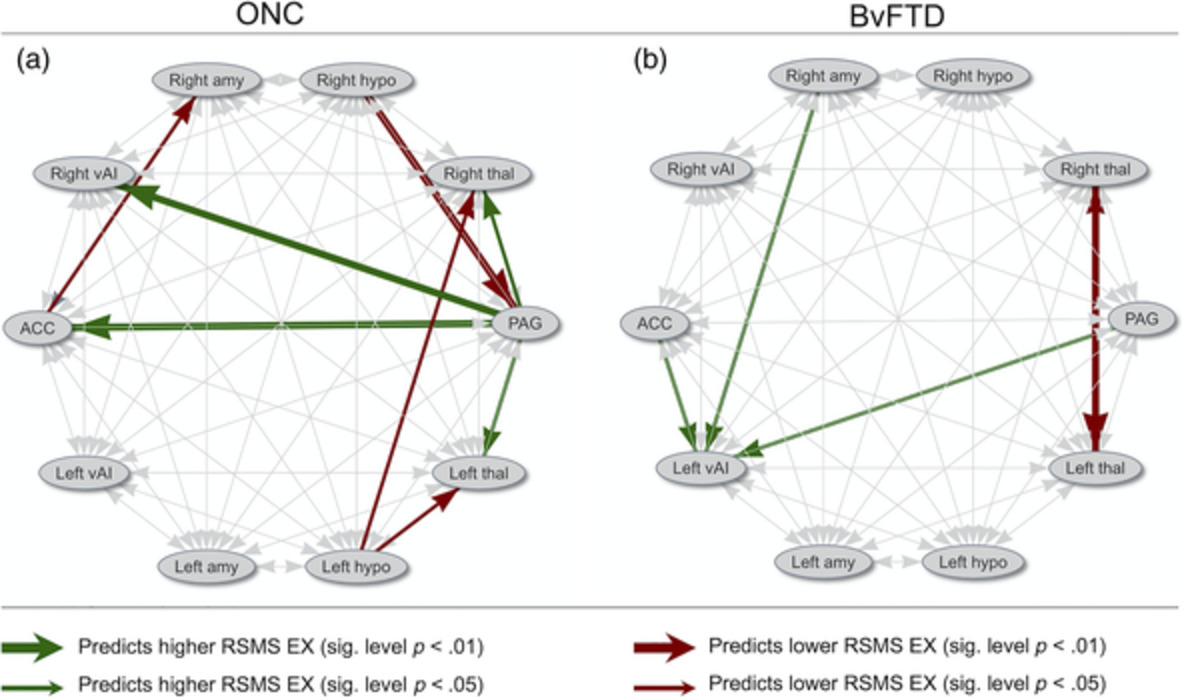
3.3.3 All node pair effective SN connections as a predictor of RSMS EX scoreWe also conducted an exploratory analysis to identify whether separately for the ONC and bvFTD group effective node connections other than the connections with the PAG significantly contribute to the RSMS score. We included all 10 nodes for the ONC and bvFTD group in these analyses but excluded effective connectivity within each node (self-connections), resulting in 90 comparisons in total. Figure 2a,b display these 90 comparisons at a level of p < .05 and p < .01. Next, a B–Y multiple comparison correction of p < .00942 was applied as a minimum threshold to gauge the statistical significance of results. Of these connections in ONCs, PAG output to the ACC (R2 = .16, F = 8.15, p = .0067.) and right vAI (R2 = .16, F = 7.82, p = .0078) remained statistically significant for higher RSMS EX scores, and input from the right hypothalamus to the PAG (R2 = .20, F = 9.97, p = .003) remained significant for lower RSMS EX score. For the bvFTD group, no node pair significantly predicted RSMS EX scores after multiple comparison correction. See Figure S2 for the confidence limits of all analyses.
 Schematic illustration of effective node connections that with a significance level of p p S2 for all effective node connections' confidence intervals in relation with the RSMS EX score). For the ONC group, PAG output to cortical and thalamic nodes positively predicted RSMS EX score, whereas input from the ACC, amygdala, and PAG to the left vAI positively predicted RSMS EX score for the bvFTD group. Mainly hypothalamic output had negative influence on the RSMS EX score for ONC, and bilateral thalamic connections for bvFTD patients. EX, expressive behavior; RSMS, revised self-monitoring scale
3.3.4 Cluster groups based on PAG output to cortical and subcortical SN nodes
Schematic illustration of effective node connections that with a significance level of p p S2 for all effective node connections' confidence intervals in relation with the RSMS EX score). For the ONC group, PAG output to cortical and thalamic nodes positively predicted RSMS EX score, whereas input from the ACC, amygdala, and PAG to the left vAI positively predicted RSMS EX score for the bvFTD group. Mainly hypothalamic output had negative influence on the RSMS EX score for ONC, and bilateral thalamic connections for bvFTD patients. EX, expressive behavior; RSMS, revised self-monitoring scale
3.3.4 Cluster groups based on PAG output to cortical and subcortical SN nodes
By performing a k-means clustering analysis of the summary variables representing PAG output in the ONCs, we found that individuals could be split into three cluster groups based on differences in their patterns of connectivity. PAG input summary variables did not reflect any meaningful clusters. Compared with separation in two or four clusters (average silhouette values of .58 and .57, respectively), separation in three clusters yielded the highest average silhouette value (.60). A visual check of the three-cluster analysis' silhouette plot showed that all data points in cluster group 3 have silhouette values above 0.8, and many data points in cluster groups 1 and 2 have silhouette values around 0.7, which indicates that separation into three clusters is acceptable (see Figure 3d). Cluster group 1 (blue) exhibited low PAG output toward cortical and subcortical SN nodes. Cluster group 2 (red) exhibited medium PAG output toward cortical and subcortical SN nodes, and cluster group 3 (green) exhibited high PAG output (Figure 3a). ONCs that belonged to cluster group 3 had significantly higher scores on the RSMS EX subscale than members of cluster group 2, p < .01 (Figure 3b1). There were no significant differences in RSMS EX score between cluster group 3 and 1, which is likely due to the small group size for group 1 (blue). When analyzing the whole sample (i.e., ONC and bvFTD), members of cluster group 3 scored significantly higher on the RSMS EX than members of cluster group 1, p < .01 (Figure 3b2) and there was a trend toward a significant difference between cluster group 3 and cluster group 2 (p = .06). Finally, bvFTD patients were significantly more likely to belong to cluster group 1, and ONCs were significantly more likely to belong to cluster group 3 (χ2 = .02), Figure 3c.

Individual differences in strength of PAG output predict RSMS EX score. (a) Comparing the summary estimates for PAG output to cortical nodes with PAG output to subcortical nodes yielded three different cluster groups in ONCs, of which group 1 (blue) showed weakest PAG output strength toward cortical and subcortical SN nodes, group 2 (red) showed medium output strength, and group 3 (green) showed most output strength toward cortical and subcortical SN nodes. (b1) When comparing RSMS EX scores of ONCs that belong to
留言 (0)