
記住我

An MRI scanner can be used to acquire a range of different contrasts, which provide complementary information and are sensitive to different pathophysiologies (Cercignani & Bouyagoub, 2018). Currently, multimodal MRI scanning involves specifying a sequence of contrasts prior to data acquisition and in research contexts, acquiring the same sequence for each individual. In a clinical context, the selection of contrasts is guided by factors such as clinical history, cognitive and neurological examinations, and symptoms (Camprodon & Stern, 2013). However, the optimal sequence of contrasts and/or parameters for each contrast may depend on the anatomical or physiological abnormalities specific to the individual patient or be specific to a given pathology, and thus may not be known a priori. As an alternative approach, it was recently proposed that data could be analysed as it is being acquired, with the near-real-time results used to determine subsequent acquisition steps (Cole et al., 2019). This approach was illustrated using three simulated scenarios, including (a) tailoring the resolution and/or field of view (FoV) of a structural scan to detect stroke, (b) adaptively acquiring multimodal data to classify a known outcome variable using a decision tree, and (c) adaptively searching across multiple MRI modalities using Bayesian optimisation to detect abnormality. However, adaptive acquisition is yet to be implemented practically. One prerequisite to progress beyond simulated scenarios (Cole et al., 2019) and implement adaptive acquisition in practice is the development of rapid analysis pipelines for multiple MRI modalities, enabling data to be processed in near-real-time.
We propose to capitalise on EPImix—a recently developed multicontrast sequence which acquires six contrasts (T1-FLAIR, T2, T2*, T2-FLAIR, DWI, ADC), at 0.975 × 0.975 × 3 mm resolution, in ~1 min (Skare et al., 2018). A multicontrast sequence such as EPImix, or other similar rapid multicontrast sequences (Polak et al., 2020), is well suited to be the first sequence in an adaptive acquisition run, rapidly providing an overview of neuroanatomy across multiple contrasts. EPImix contrasts have previously been compared to high-quality, single-contrast sequences to evaluate their suitability for qualitative disease identification and categorisation by trained radiologists, and have shown comparable diagnostic performance to routine clinical brain MRI (Delgado et al., 2019; Ryu et al., 2020). However, there have been no quantitative comparisons of EPImix and corresponding single-contrast scans.
Here, we explore rapid image processing pipelines for the EPImix sequence, as well as for a single-contrast T1-weighted (T1-w) sequence, and use the rapidly processed scans to quantitatively compare EPImix and standard T1-w scans (Figure 1c). We first optimise a rapid processing pipeline by evaluating the impact of several processing steps on the processing time and on the quality of registration of manually labelled scans, using openly available data with manual segmentations in both native and standard space (Klein & Tourville, 2012). Subsequently, we quantify, in several ways, the overlap between selected EPImix contrasts and corresponding single-contrast sequences. Finally, we demonstrate a novel quantitative application of the multicontrast EPImix sequence, which could be useful both in an adaptive imaging paradigm and beyond: the construction of morphometric similarity networks (MSNs; Seidlitz et al., 2018).
 Overview of analysis steps. (a) A rapid processing pipeline for T1-w scans was evaluated using the manually labelled Mindboggle dataset (Klein & Tourville, 2012; for details, see Figure 2). (b) The pipeline was used to process T1-FLAIR scans derived from the rapid multicontrast EPImix sequence (Skare et al., 2018) as well as single-contrast (IR-FSPGR) T1-w scans. (c) Jacobian determinants and tissue intensities derived from both types of T1-w scan were compared using several methods, including correlation (across participants), inter-individual identifiability, and structural covariance networks. (d) Additionally, we explored using the EPImix sequence to construct morphometric similarity networks (MSNs; Seidlitz et al., 2018). (e) Finally, we evaluated the test–retest reliability of all contrasts within the EPImix sequence, and of the derived MSNs
2 METHODS
2.1 Processing steps
While developing a rapid image processing pipeline, we considered the following factors to guide selection of steps:
Speed: Faster processing was preferred. We measured speed in seconds. (Processing was run on an Apple Macbook Pro [2.2 GHz Intel Core i7, 16 Gb 1,600 MHz DDR3 RAM], with no other user processes running in parallel).
Quality: Higher quality was preferred. We evaluated the quality of steps up to and including registration by quantifying overlap between source and target of manually labelled atlases (Klein et al., 2009) using the Mindboggle dataset (Klein & Tourville, 2012).
Automation: Fewer quality control steps and resulting re-running of processing steps following manual interventions and/or changes of parameters were preferred.
Overview of analysis steps. (a) A rapid processing pipeline for T1-w scans was evaluated using the manually labelled Mindboggle dataset (Klein & Tourville, 2012; for details, see Figure 2). (b) The pipeline was used to process T1-FLAIR scans derived from the rapid multicontrast EPImix sequence (Skare et al., 2018) as well as single-contrast (IR-FSPGR) T1-w scans. (c) Jacobian determinants and tissue intensities derived from both types of T1-w scan were compared using several methods, including correlation (across participants), inter-individual identifiability, and structural covariance networks. (d) Additionally, we explored using the EPImix sequence to construct morphometric similarity networks (MSNs; Seidlitz et al., 2018). (e) Finally, we evaluated the test–retest reliability of all contrasts within the EPImix sequence, and of the derived MSNs
2 METHODS
2.1 Processing steps
While developing a rapid image processing pipeline, we considered the following factors to guide selection of steps:
Speed: Faster processing was preferred. We measured speed in seconds. (Processing was run on an Apple Macbook Pro [2.2 GHz Intel Core i7, 16 Gb 1,600 MHz DDR3 RAM], with no other user processes running in parallel).
Quality: Higher quality was preferred. We evaluated the quality of steps up to and including registration by quantifying overlap between source and target of manually labelled atlases (Klein et al., 2009) using the Mindboggle dataset (Klein & Tourville, 2012).
Automation: Fewer quality control steps and resulting re-running of processing steps following manual interventions and/or changes of parameters were preferred.
For the processing steps considered for inclusion in the pipeline, see Table 1.
TABLE 1. Processing steps considered Step Reason Options Algorithm (reference[s]) Downsampling To save time (and potentially help extraction) 1/2/3 mm ANTs ResampleImageBySpacing (Avants et al., 2011; Avants, Epstein, Grossman, & Gee, 2008) Bias field correction Commonly applied to improve registration Yes/no ANTs N4BiasFieldCorrection (Tustison et al., 2010) Brain extraction To improve registration Yes/no FSL BET (Smith, 2002) Registration To evaluate deviation from spatially normalised group SyN/b-spline SyN ANTs antsRegistrationSyNQuick.sh (Avants et al., 2008, 2011) Smoothing To remove noise in voxel-wise analyses 2/4/6 mm FWHM Python nilearn nl.image.smooth_img (Abraham, Pedregosa, Eickenberg, & Gervais, 2014) Note: For each step, we list the reason for consideration, the evaluated options and the algorithm used, including relevant references.For registration of scans to standard space, we used ANTs (Avants et al., 2008), due to its good performance in systematic evaluations of registration algorithms (Bartel et al., 2019; Klein et al., 2009; Nazib, Galloway, Fookes, & Perrin, 2018). We are aware that the combination of processing steps listed in Table 1 is by no means exhaustive, as different software suites could have been used for each step, potentially differing in speed and quality of processing; instead, the selected steps serve as a proof-of-principle evaluation of the proposed approach (see also Section 4).
2.2 Evaluating the speed and quality of registrationsWe evaluated the quality of registrations as well as the effect of any prior pre-processing steps using the Mindboggle dataset (Klein & Tourville, 2012), which contains T1-w scans of 101 healthy participants manually labelled according to the Desikan–Killiany–Tourville (DKT) protocol (31 cortical regions per hemisphere). The dataset contains both T1-w scans and manual DKT atlas labels in both native and MNI152 spaces. These manual labels have previously been used as a gold standard in evaluations of processing tools (e.g., Henschel et al., 2020; Tustison et al., 2014; Velasco-Annis et al., 2017). We used the non-skull-stripped T1-w scans as initial input into our processing pipelines as brain extraction is one of the processing steps under evaluation.
We first used the native space T1-w scan to estimate registration parameters to MNI152 space (following any optional pre-processing steps; Figure 2a). Subsequently, we applied the registration step to the manual native space DKT atlas labels (Figure 2b). Finally, we quantified the overlap of the transformed atlas labels with the manual MNI152 space atlas labels using the Dice coefficient (Figure 2c), equal to twice the number of overlapping voxels divided by the sum of the number of voxels in each set; for voxel sets and : (1)We calculated the Dice coefficient both for all atlas regions across the brain at once, and for individual atlas regions.
 Using manual Desikan–Killiany–Tourville (DKT) atlas labels from the Mindboggle dataset to quantitatively evaluate the quality of registration (and pre-processing steps). (a) The processing pipeline (up to and including registration) is applied to the native-space T1-w scan to transform it to MNI152 space and to estimate registration parameters. (b) The registration (calculated in step a) is applied to the native-space DKT atlas. (c) The Dice coefficient is used to quantify the overlap, in MNI152 space, between the atlas labels which have been transformed from native space (in step b) and the manual atlas labels released with the Mindboggle dataset (Klein & Tourville, 2012)
We evaluated the above steps (Table 1) in a sequential manner, as follows. (As the options evaluated at each step depend on results obtained in the previous step, we report the outcome of each step here; for details underlying our selection, see Section 3. Unless otherwise specified, we used the ANTs SyN registration as implemented by default in antsRegistrationSyNQuick.sh as the main processing step.)
We first evaluated the effect of spatial resolution, including 1 mm (native Mindboggle data resolution), 2 mm, and 3 mm isotropic. We downsampled both the T1-w scans and DKT atlases in both native and standard space, before applying the ANTs SyN algorithm for registration (Avants et al., 2008).
Following selection of the resolution (2 mm), we considered the effect of bias field correction. We compared the quality and speed of ANTs SyN registration with and without ANTs N4 bias field correction (Tustison et al., 2010).
We next considered the impact of brain extraction on the output of the previous steps (2 mm with bias field correction). We compared the default non-skull-stripped registration to the application of FSL BET (Smith, 2002) for skull-stripping. (We used default BET parameters, except for the fractional intensity threshold, which was set to 0.4 based on an initial test evaluation using a subset of scans.)
Using manual Desikan–Killiany–Tourville (DKT) atlas labels from the Mindboggle dataset to quantitatively evaluate the quality of registration (and pre-processing steps). (a) The processing pipeline (up to and including registration) is applied to the native-space T1-w scan to transform it to MNI152 space and to estimate registration parameters. (b) The registration (calculated in step a) is applied to the native-space DKT atlas. (c) The Dice coefficient is used to quantify the overlap, in MNI152 space, between the atlas labels which have been transformed from native space (in step b) and the manual atlas labels released with the Mindboggle dataset (Klein & Tourville, 2012)
We evaluated the above steps (Table 1) in a sequential manner, as follows. (As the options evaluated at each step depend on results obtained in the previous step, we report the outcome of each step here; for details underlying our selection, see Section 3. Unless otherwise specified, we used the ANTs SyN registration as implemented by default in antsRegistrationSyNQuick.sh as the main processing step.)
We first evaluated the effect of spatial resolution, including 1 mm (native Mindboggle data resolution), 2 mm, and 3 mm isotropic. We downsampled both the T1-w scans and DKT atlases in both native and standard space, before applying the ANTs SyN algorithm for registration (Avants et al., 2008).
Following selection of the resolution (2 mm), we considered the effect of bias field correction. We compared the quality and speed of ANTs SyN registration with and without ANTs N4 bias field correction (Tustison et al., 2010).
We next considered the impact of brain extraction on the output of the previous steps (2 mm with bias field correction). We compared the default non-skull-stripped registration to the application of FSL BET (Smith, 2002) for skull-stripping. (We used default BET parameters, except for the fractional intensity threshold, which was set to 0.4 based on an initial test evaluation using a subset of scans.)
Finally, we applied ANTs spline-based SyN registration to the output of previous steps (2 mm with bias field correction and without skull-stripping) to compare speed and quality to standard ANTs SyN (Avants et al., 2008).
+Additionally, we evaluated a reference pipeline, optimised for quality rather than speed. This consisted of 1 mm isotropic resolution images, ANTs N4 bias field correction and the slower antsRegistrationSyN.sh script, optimised for quality.
As a quality control step, the T1-w scan in MNI152 space (i.e., the output of Figure 2a) was visually assessed to ensure a successful registration. For details of the settings used for each processing step in each evaluated pipeline, see Table 2.
TABLE 2. Evaluated pipelines Pipeline Resolution Bias field corr. Brain extraction Registration 1 1/2/3 mm Off Off SyN 2 2 mm On/off Off SyN 3 2 mm On On/off SyN 4 2 mm On Off SyN/b-spline SyN Final 2 mm On Off SyN + Reference 1 mm On Off ‘slow’ SyN Note: Settings used for each step while evaluating pipelines in a sequential manner. Cell colour indicates evaluation status: yellow cells indicate steps under evaluation, orange cells indicate steps not yet evaluated, and green cells indicate evaluated steps, where an option has been selected. (Steps within the reference pipeline were not evaluated sequentially.).We note that not all combinations of processing steps were systematically evaluated. Moreover, our aim was not to find the ‘optimal’ processing pipeline, but rather to consider trade-offs in processing speed and quality, to identify a combination of processing steps which optimises both parameters (i.e., ‘good enough and fast enough’). As we argue in further detail in Section 4, we deliberately avoided combining speed and quality into a single evaluation metric, as the relative importance of these two criteria cannot easily be quantified. Instead, we believe that these two quantitative measures should serve to guide the construction of a rapid processing pipeline on a case-by-case basis.
2.3 Processing of EPImix and corresponding single-contrast T1-w scansFollowing the selection of a rapid processing pipeline (2 mm scans with bias field correction and standard SyN registration, see also Section 3), we applied it to the EPImix scans, and corresponding T1-w single-contrast scans. We focused on the T1-w single-contrast sequence due to data availability.
We included scans collected on the same scanner (General Electric MR750 3.0T, Waukesha, WI) across three different studies conducted on healthy volunteers at the Centre for Neuroimaging Sciences, King's College London's Institute of Psychiatry, Psychology & Neuroscience. The studies received ethical approval from King's College London's Psychiatry, Nursing and Midwifery Research Ethics Committee (KCL Ethics References: HR-18/19-9268, HR-18/19-11058, and HR-19/20-14585). All participants gave written informed consent to take part in the study.
EPImix scans were collected from 95 participants (48 female, 47 male; age median [first, third Quartile] (Md [Q1,Q3]) = 25 [22,29] years; Figure S1), consisting of six contrasts (T2*, T2-FLAIR, T2, T1-FLAIR, DWI, ADC) acquired at 0.975 × 0.975 × 3 mm resolution. For details regarding specific acquisition parameters, see Supporting Information. The EPImix sequence includes an on-scanner motion correction step; the motion corrected images were used for further analyses. For further details regarding the EPImix sequence, see Skare et al. (2018). Additionally, for 10 participants, a second EPImix scan was acquired during the same session to investigate test–retest reliability.
Of the participants scanned with the EPImix sequence, 66 were additionally scanned, within the same session, with an IR-FSPGR T1-weighted sequence (33 female, 33 male; age Md [Q1,Q3] = 25 [23,29.75] years; Figure S1). Of these, 12 were scans acquired at 1 × 1 × 1 mm resolution, and 54 were scans acquired at 1.05 × 1.05 × 1.2 mm resolution. For details regarding specific acquisition parameters, see Supporting Information.
Note that as both the EPImix T1-FLAIR contrast and the single-contrast IR-FSPGR sequence are T1-weighted, we hereafter refer to both as such (as well as simply ‘T1-w’).
When applying the previously identified rapid processing pipeline to EPImix scans, we omitted the downsampling step (to 2 mm isotropic resolution), as options for modifying the EPImix voxel resolution of 0.975 × 0.975 × 3 mm during acquisition are limited, and the ‘native’ EPImix resolution resulted in sufficiently rapid processing (Md [Q1,Q3] = 32 [31,33] s across participants; see also Figure 4). Instead, we registered EPImix T1-w scans directly to a 2 mm isotropic MNI template, and subsequently applied the same transformation to the remaining EPImix contrasts. Furthermore, following registration of the single-contrast and EPImix T1-w scans to MNI space, we extracted the logarithm of the Jacobian determinant of the ANTs SyN transform (combining the affine and non-linear warp components) to serve as an additional quantitative comparison of EPImix and corresponding single-contrast acquisitions (henceforth referred to as log-Jacobian).
2.4 Effects of resolution and spatial smoothness on the correspondence between EPImix and single-contrast T1-w scansTo evaluate the impact of spatial resolution on the correspondence between EPImix and single-contrast T1-w scans, as well as the test–retest reliability of EPImix contrasts and derived measures, we downsampled voxelwise data within regions of interest (ROIs). To investigate the impact of ROI size within the atlas used, we used both a high-resolution multi-modal parcellation (MMP) of cortex into 360 ROIs, constructed by Glasser et al. (2016), as well as its downsampled low-resolution version into 44 larger regions. These two atlases are hereafter referred to as ‘MMP high-resolution’ (or ‘MMP high-res.’) and ‘MMP low-resolution’ (or ‘MMP low-res.’), respectively. For details, see Figure S2.
Due to the reduced FoV of EPImix scans, resulting in missing portions of the inferior temporal and/or superior parietal lobe in certain participants, we only included voxels present (i.e., non-zero) in at least 80% of EPImix scans in voxelwise analyses (i.e., 76/95 participants). For regional analyses, we only included ROIs where at least 80% of voxels contained non-zero values in at least 80% of participants. This resulted in analyses using 297/360 regions from the Glasser et al., 2016 atlas, and 32/44 regions from its downsampled version. For details, see Figure S3.
Regional values were generated by calculating the median values of unsmoothed voxel-wise EPImix contrasts, single-contrast T1-w scans and log-Jacobians within atlas masks registered to the same MNI space, excluding zero-valued voxels. We subsequently performed analyses at the spatial resolution of voxels (both spatially smoothed and unsmoothed), 297 and 32 ROIs, as described below. Additionally, voxel-wise analyses were performed and/or visualised using voxels within a mask defined by the MNI brain (dilated once), as well as cortical grey matter (GM) voxels (defined as voxels belonging to one of the regions of the cortical MMP atlases used).
Furthermore, to evaluate the impact of spatial smoothness on the correspondence between EPImix and corresponding single-contrast scans, we smoothed voxelwise EPImix and single-contrast T1-w scans using three different Gaussian kernels—2, 4, and 6 mm full-width at half-maximum (FWHM; using Python nilearn; Abraham et al., 2014).
2.5 Correspondence between EPImix and single-contrast scansWe quantified correspondence between matching EPImix and single-contrast T1-w scans in several ways. (All instances of correlation refer to Spearman's correlation coefficient  .).
.).
To evaluate the extent of spatial correspondence between EPImix and single-contrast scans, we correlated corresponding log-Jacobians and T1-w intensities at the voxel and ROI level, across subjects.
Further, to determine whether the correspondence between matching EPImix and single-contrast T1-w scans is higher within than between participants, we calculated measures of ‘differential identifiability’ (Amico & Goñi, 2018). This is defined as the median correlation of participants' scans from one modality to their own scan from the other modality (i.e., within-participant correlation; ), minus the median correlation between modalities of non-corresponding participants (i.e., between-participant correlation;
  ):
):
 (2)We additionally defined an individual index of differential identifiability, as the fraction of times that between-subject scan correlations are smaller than within-subject scan correlations. We calculated this measure twice for each participant and spatial resolution, to quantify both the individual identifiability of a single-contrast T1-w scan relative to EPImix T1-w scans, and of an EPImix T1-w scan relative to single-contrast T1-w scans. This individual measure of identifiability is related to discriminability, as defined by Bridgeford et al. (2020). We note that while (individual) identifiability based on log-Jacobians is desirable as these maps encode inter-individual differences in brain size and shape, the interpretation of identifiability based on T1-w scan intensity is more complex (for details, see Section 4).
When correlating values at the regional level, we used a spatial permutation test to construct realistic null models of spatial correspondence. Specifically, these null models test whether correspondence between two cortical maps might be driven by spatial autocorrelation and hemispheric symmetry of these maps (null hypothesis; H0), or whether there is inherent spatial correspondence over and above these potential confounds (alternative hypothesis; H1). For details regarding the generation of regional spatial permutations, see (Markello & Misic, 2020; Váša et al., 2018) and Supporting Information.
As a final comparison between contrasts, we used regional data from EPImix and single-contrast log-Jacobians as well as T1-w intensities to construct structural covariance matrices, by cross-correlating median regional values across subjects (Alexander-Bloch et al., 2013; Evans, 2013). We quantified correspondence between the upper triangular parts of the structural covariance matrices using correlation, and visualised networks from both modalities using (thresholded) network diagrams. We further contextualised the correspondence between networks using a mapping of high-resolution MMP atlas regions to intrinsic connectivity networks derived by Yeo et al., 2011, previously defined in Váša et al., 2020 (for details of the mapping, see Supporting Information).
2.6 EPImix MSNs We further explored the possibility of constructing MSNs (Seidlitz et al., 2018) from EPImix, by correlating regional contrast values between pairs of regions within subjects. EPImix-derived MSNs provide a proxy measure of connectivity, which could serve both to complement measures of regional anatomy in driving the adaptive imaging process, and as a rapid brain network estimate in other applications. We used seven maps per participant to construct EPImix-derived MSNs, including six EPImix contrasts as well as the log-Jacobian derived from transforming EPImix T1-w scans to MNI space. Regional values were normalised within each participant and contrast using the number of absolute deviations around the median, a non-parametric equivalent of the Z-score (Leys, Ley, Klein, Bernard, & Licata, 2013); for a vector of regional values :
:
 (3)where
  corresponds to the median, and
  to the median absolute deviation. Finally, normalised regional values were correlated using Spearman's
  across maps (contrasts), within participants, to create individual MSNs.
We compared EPImix-derived MSNs to conventional MSNs, derived from FreeSurfer reconstructions of single-contrast T1-w scans. MSNs have previously been reconstructed from 10 morphometric features derived from high-resolution multi-modal MRI data (Seidlitz et al., 2018), as well as five features derived from single-contrast T1-w scans (King & Wood, 2020). We used the FreeSurfer recon-all command to reconstruct cortical surfaces (Fischl, Sereno, & Dale, 1999), followed by visual quality control; one of the 66 participants with both EPImix and single-contrast T1-w scans available was excluded due to a failed surface reconstruction, resulting in the use of 65 participants for this analysis. Subsequently, seven FreeSurfer-generated quantitative measures were extracted from each region of both the high-resolution and low-resolution MMP atlases used: surface area, GM volume, cortical thickness, mean curvature, Gaussian curvature, folding index, and curvature index. Each measure was normalised using the same non-parametric approach as EPImix MSNs (Equation (3)), and individual MSNs constructed using Spearman's  across regional normalised measures. We then compared EPImix-derived and standard MSNs using Spearman's
  correlations—of group-averaged MSNs (across all edges, and within and between intrinsic connectivity networks), as well as within individual participants.
Finally, to explore the value of EPImix MSNs, we quantified the variance in participant age and sex explained by MSN edges using linear regression, in the full sample of (95) participants with EPImix scans. The explained variance score was calculated within five-fold age-stratified cross-validation, with a resulting median value (across folds) calculated for each MSN edge.
2.7 Test–retest reliability of EPImix scansWe quantified test–retest reliability of EPImix scans using 10 within-session test–retest EPImix scans. We quantified test–retest reliability using the intraclass correlation coefficient (ICC); specifically, we used the one-way random effects model for the consistency of single measurements, that is, ICC(3,1), hereafter referred to as ICC (Chen et al., 2018). We calculated the ICC using voxel-wise data, ROI-averaged data and MSN edges.
3 RESULTS 3.1 Evaluation of a rapid processing pipelineWe sequentially evaluated the impact of four processing steps on the speed and quality of registration, using the Mindboggle-101 dataset (Klein & Tourville, 2012). At each step, we recorded the processing time and the quality of overlap (between our custom registrations of DKT atlas labels and manual labels released with the Mindboggle dataset) using the Dice coefficient. These two measures are intended to inform (rather than determine) the selection of processing steps (see also Section 4).
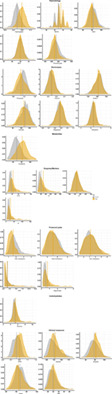
We first evaluated the impact of spatial resolution of the data. An isotropic resolution of 1 mm results in the most accurate registration, but is potentially too slow to be run in real-time (processing time Md [Q1,Q3] = 129 [127,131] s). The processing of the images with 2 mm isotropic resolution is sufficiently fast (Md [Q1,Q3] = 18 [18,19] s) and was therefore chosen (Figure 3a). We next inspected the impact of bias field correction (on 2 mm isotropic resolution scans), using the ANTs N4 algorithm. We found that bias field correction improved registration quality at a relatively low time cost (Md [Q1,Q3] = 24 [24,25] s) and was therefore included as a processing step (Figure 3b). Subsequently, we explored the application of a brain extraction algorithm (to the 2 mm isotropic resolution scans following bias field correction) using FSL BET. Brain extraction results in a marginally faster registration (Md [Q1,Q3] = 21 [20,23] s), but with no gain in quality (Figure 3c). Combined with the fact that brain extraction might fail and need to be re-run with alternative parameters, it was not included in our processing pipeline. Finally, we evaluated the use of ANTs b-spline SyN registration (instead of the ‘standard’ ANTs SyN algorithm). This results in a noticeably slower registration, without a gain in quality (Md [Q1,Q3] = 41 [40,42] s); therefore, the standard ANTs algorithm was preferred (Figure 3d).
 Evaluation of processing time and quality of registration using the Mindboggle dataset. The effect of four processing steps was evaluated sequentially; for each step, both processing time and quality were taken into account to select one of the options, before proceeding to the next step. p-values adjacent to neighbouring raincloud plots correspond to the (paired) Wilcoxon signed-rank test between corresponding data (testing whether evaluated methods differ significantly in processing time or registration quality [H1], or whether there is no statistical difference between these values [H0]). (a) Spatial resolution. (b) Bias field correction. (c) Brain extraction. (d) B-spline SyN registration. (e) An additional reference pipeline was evaluated, to benchmark any reduction in quality resulting from optimising steps a–d for speed. p-values were not corrected for multiple comparisons, due to the sequential nature of evaluated steps. We note that even stringent multiple comparisons correction has no qualitative impact on the results. For Bonferroni-corrected p-values, as well as median differences in both processing time and quality between pairs of compared pipelines, see Table S1
To benchmark the potential loss in quality resulting from the above selection of a fast processing pipeline, we evaluated an additional ‘reference’ pipeline, solely optimised for quality. This consisted of 1 mm scans, ANTs N4 bias field correction and registration using a slower (but more accurate) version of the ANTs SyN algorithm. As expected, this pipeline was far slower (Md runtime [Q1,Q3] = 39.9 [39.4,40.3] min), and only resulted in a marginal increase in registration quality (Figure 3e).
For each processing pipeline, we additionally calculated the Dice coefficient for individual regions of the DKT atlas. This showed a relatively spatially homogenous impact of processing steps on registration quality overall; for details, see Figure S4.
We next applied the selected processing pipeline, consisting of ANTs N4 bias field correction and ANTs SyN registration, to EPImix and corresponding single-contrast T1-w scans (the EPImix scans were not downsampled but registered to a 2 mm isotropic MNI template brain directly; the single-contrast T1-w scans were downsampled to 2 mm isotropic resolution prior to registration). Application of the selected processing pipeline to EPImix and single-contrast T1-w scans resulted in rapid processing of both acquisitions (EPImix processing time Md [Q1,Q3] = 32 [31,33] s, single-contrast T1-w processing time Md [Q1,Q3] = 30 [29,31] s; Figure 4).

Processing time for EPImix and single-contrast T1-w scans. The p-value corresponds to the (unpaired) Mann–Whitney U test (testing whether processing times differ for EPImix and single-contrast T1-w scans [H1], or whether there is no statistical difference between these values [H0]). Note that a small amount of jitter was added to data to better distinguish the distribution of integer-valued data-points
3.2 Correspondence between EPImix and single-contrast T1-weighted scansWe evaluated correspondence between EPImix and single-contrast scans using both log-Jacobians extracted from transformations of T1-w scans to MNI standard space, and T1-w scan intensities. In the main text, we report results of log-Jacobian comparisons as well as summary results for T1-w intensities; full details for comparisons of T1-w intensities are reported in Supporting Information.
We restricted analyses of EPImix and single-contrast T1-w scans to voxels with coverage in at least 80% participants (199′870/269′462 = 74.2% voxels in the MNI brain mask, and 64′370/78′247 = 82.3% voxels in the cortical GM mask), and regions where at least 80% voxels were non-zero in at least 80% participants (297/360 = 82.5% regions in the high-resolution MMP atlas, 32/44 = 72.7% regions in the low-resolution MMP atlas). For details regarding participant overlap at voxels and regions, see Figure S3.
When evaluating correspondence between EPImix and single-contrast T1-w scans, we first calculated the correlation, across participants, of the log-Jacobian value at each voxel or region. Most correlations were strong and positive, including Md(ρ) [Q1,Q3] = 0.70 [0.62,0.77] at the voxel level (0.70 [0.62,0.76] in the GM), 0.75 [0.68,0.81] at the level of regions of the high-resolution MMP atlas, and 0.83 [0.8,0.87] for the low-resolution atlas (Figure 5). Most or all correlations were statistically significant (pFDR ≤.05 at >99% voxels for both brain voxels and GM voxels, and for all [100%] regions of both the high- and low-resolution MMP atlases). Analogous comparisons using T1-w intensities yielded lower correlations, including Md(ρ) [Q1,Q3] = 0.17 [0.05,0.29] within all brain voxels and 0.22 [0.11,0.32] within GM voxels, as well as 0.19 [0.13,0.26] within ROIs of the high-resolution MMP atlas and 0.16 [0.12,0.19] for regions of the low-resolution MMP atlas (Figure S5). Far fewer of these correlations were significant (pFDR ≤.05 at 20% brain voxels and 31% GM voxels, and for only 3% regions of the high-resolution MMP atlas and no [0%] regions of the low-resolution MMP atlas).

Local correspondence of log-Jacobians across participants. Spearman's correlations between log-Jacobians of rapidly-processed T1-w scans from the EPImix sequence and a single-contrast acquisition, using data of 66 participants. Correlations are depicted: at the voxel level for (a) the whole brain, and (b) cortical grey matter, as well as within ROIs of (c) the high-resolution and (d) the low-resolution multi-modal parcellation atlas. (e) Distributions of correlations at each spatial resolution considered (as depicted in panels a–d). (At the regional level, median regional values were extracted prior to calculation of correlations for each region.)
We next quantified the within- and between-participant correspondence of EPImix and single-contrast log-Jacobians (Figure 6a). We calculated global identifiability, as the difference of the median between-participant correlation and median within-participant correlation (Figure 6b; relevant parts of the correlation matrices are depicted in Figure 6c). Differential identifiability was similar across types of data used, with highest identifiability at the level of low-resolution regions (Idiff = 0.49–0.16 = 0.33), closely followed by high-resolution regions (Idiff = 0.48–0.19 = 0.29), brain voxels (Idiff = 0.38–0.11 = 0.27), and finally GM voxels (Idiff = 0.40–0.14 = 0.26) (Figure 6b). For regional data, we additionally used a null model relying on spherical ‘spin’ permutation of cortical regions to account for spatial autocorrelation of the data when quantifying spatial correspondence between contrasts. Within the high-resolution atlas, 52/66 = 78.8% of within-participant correlations survived the FDR-corrected permutation test, compared to 406/4290 = 9.5% of between-participant correlations. Within the low-resolution atlas, no within- or between-participant correlations survived this thresholding procedure (Figure 6a). Finally, we calculated individual-level identifiability, as the fraction of times that within-participant scan correlations are higher than between-participant scan correlations, using one of the contrasts as a reference (Figure 6d). For example, identifiability of an individual EPImix T1-w scan is maximal (=1) when the correlation between that scan and the same participants' single-contrast T1-w scan is higher than all correlations to other participants' single-contrast T1-w scans. Individual identifiability was highly similar when using EPImix T1-w scans and single-contrast T1-w scans as reference. In contrast with global differential identifiability, individual participants were most identifiable at the level of brain voxels, with high individual identifiability at the level of GM voxels and high-resolution ROIs as well; low-resolution regions had comparatively lower individual identifiability (Figure 6d). Analogous analyses using T1-w scan intensities yielded highest differential and individual identifiability at the level of GM voxels (Idiff = 0.24; Md[ind. Idiff] = 1), with lower correspondence at other spatial resolutions; for details, see Figure S6.

Participant identifiability across EPImix and single-contrast scans, using log-Jacobians. Between-participant correlations and identifiability were investigated using
留言 (0)