
記住我

Bipolar disorders (BD) affect over 1% of the population worldwide (Grande, Berk, Birmaher, & Vieta, 2016). Clinical characteristics and severity of the disorder vary; while some patients are disabled, others live normal lives between mood episodes; some experience psychotic episodes whereas others do not, and medication regimes and responses differ widely. This clinical heterogeneity may hamper the search for consistent underlying pathophysiological disease mechanisms that remain elusive despite widespread research efforts.
Smaller hippocampal volumes have been reported in BD compared to healthy controls (HC) in magnetic resonance imaging (MRI) studies (Haukvik et al., 2015; Hibar et al., 2016). The hippocampus is a key structure in the limbic system and is involved in multiple cognitive functions including pattern separation/completion processes that contribute to learning and episodic memory (Squire & Wixted, 2011), emotion regulation, as well as visuospatial orientation (Fanselow & Dong, 2010). Of specific interest in BD, disrupted pattern separation and completion processes are hypothesized to underlie the formation of delusional thought content (Tamminga, Stan, & Wagner, 2010). Importantly, the hippocampus consists of anatomically and functionally distinct subfields that may be differentially involved in the pathophysiology of the disorder. Post mortem neuropathological investigations of individuals with BD show lower nonpyramidal somal volume in the cornu ammonis (CA) 2/3 region (Konradi et al., 2011) and fewer interneurons in the parasubiculum (Wang et al., 2011) region. Furthermore, individuals with BD show greater neuronal counts in the CA1 and subiculum and higher CA1 oligodendrocyte counts compared to HC (Malchow et al., 2015). Other postmortem studies have reported negative findings (Harrison, Colbourne, & Harrison, 2020), which highlights a lack of consensus and need for more precise interrogation.
MRI studies of hippocampal subfield volumetry in BD have been inconsistent (Haukvik, Tamnes, Soderman, & Agartz, 2018). Among the two largest studies to date (each comprising approximately 200 individuals with BD and 300 HC), one study reported smaller volumes in the CA2/3, CA4/dentate gyrus (DG), presubiculum, and subiculum (Mathew et al., 2014), and the other reported smaller CA2/3, CA4/DG, subiculum, and CA1, but no detectable abnormalities in presubiculum volume (Haukvik et al., 2015) in BD compared to HC, respectively. Furthermore, subfield volume reductions in the left CA4, granular cell layer of the DG, molecular layer, and bilateral tail volumes were reported more pronounced in BD1 than BD2 participants (Cao et al., 2017). Although limited, such evidence suggests that differentiation in subfield hippocampal volumetry may depend on BD subtypes. Hippocampal subfield volumes may also be affected by medication use. Lithium treatment has been associated with less pronounced volume deficiencies in CA2/3, CA4/DG and subiculum (Haukvik et al., 2015; Mathew et al., 2014), and CA1 (Hartberg et al., 2015). Stem cell research has shown that lithium increases progenitor cell proliferation in the DG, lending support to the possible neuroprotective and neurotrophic effects of lithium inferred from other MRI studies (Ferensztajn-Rochowiak & Rybakowski, 2016). Increased angiogenesis and neurogenesis in the DG have been associated with the use of antidepressant medications (selective serotonin reuptake inhibitors) in individuals with major depressive disorder (Boldrini et al., 2012). Antipsychotic medication use has been linked to elevated hippocampal neurogenesis (olanzapine) and increased cell-proliferation (clozapine) (Balu & Lucki, 2009), but the results on hippocampal volume from human MRI (Bodnar et al., 2016) and animal (Crum et al., 2016; Schmitt, Weber, Jatzko, Braus, & Henn, 2004) studies are inconclusive.
Given the small size of the hippocampal subfields, it is challenging to obtain valid and reliable hippocampal subfield volume estimates from automated MRI-based processing tools. Recently, by combining cyto- and chemo-architectural features with macroscopic landmarks, segmentation of the hippocampal subfields from MR-images has improved, and high-resolution ex-vivo data have been used to develop detailed hippocampal subfield atlases (Iglesias et al., 2015), which have proven stable across scanners and time points (Brown et al., 2020). Despite such advances and the refinement of automated segmentation protocols (Iglesias et al., 2015; Pipitone et al., 2014; Yushkevich et al., 2010; Yushkevich et al., 2015) it remains challenging to reproduce findings across studies (Haukvik et al., 2018). This discrepancy could reflect differences in clinical characteristics, but also methodological differences between segmentation algorithms (e.g., discrepancies in subfield delineation which may yield different volume estimates), field strength differences (1.5T, 3T, or higher) and the use of T1 and/or T2 weighted images (Mueller et al., 2018).
The Enhancing Neuro Imaging Genetics through Meta-Analysis Bipolar Disorder (ENIGMA BD) Working Group has brought BD researchers together from around the world to address the limitations of previous smaller scale MRI studies. More recently, ENIGMA groups have moved beyond cohort level meta-analyses to pooled, or “mega”-analyses, where anonymized and unidentifiable individual-level data are aggregated in a central location, allowing more flexible statistical design (Boedhoe et al., 2018). By applying publicly available, harmonized protocols across retrospective samples, mega-analyses become feasible, offering benefits over meta-analyses of studies based on different processing/analysis methodologies (Boedhoe et al., 2018). We previously reported on smaller whole hippocampal volumes in BD compared to HC (Hibar et al., 2016), and in other psychiatric disorders including major depressive disorder (Schmaal et al., 2016), and schizophrenia (van Erp et al., 2016). Moreover, prior studies (Cao et al., 2017; Haukvik et al., 2015; Mathew et al., 2014) of hippocampal subfield volumes in BD used a previous version of the FreeSurfer segmentation algorithm (Van Leemput et al., 2009), and a subsequent meta-analysis (Haukvik et al., 2018) did not allow for analyses of individual medication effects. Here we extend previous studies by using an individual mega-analytic approach and a newer more anatomically robust hippocampal subfield FreeSurfer segmentation algorithm to determine whether alterations in specific hippocampal subfields can explain the previously reported lower overall hippocampal volume in BD. By this, we also address the need for replication of neuroimaging studies in clinical samples (Open Science Collaboration, 2015; Thompson et al., 2020). We include secondary analyses of the effects of diagnostic subtype, medication use, and clinical characteristics on hippocampal subfield volumes. In the largest study to date—with pooled data from over 4,600 participants—we hypothesized a robust pattern of lower hippocampal subfield volumes in individuals with BD compared to HC. These deficits were expected to be more severe in BD1 than in BD2. We also expected to find evidence for neuroprotective effects of lithium. Determining the specific pattern of subfield volume reduction in BD may provide further insights into the pathophysiological mechanisms of the disorder.
2 METHODS AND MATERIALS 2.1 Subject samplesThe ENIGMA BD hippocampal subfields project included MRI data and clinical characterization of 4,698 subjects (57% female) from 23 sites worldwide (27 scanners), with n = 1,472 individuals with BD (60% female) and n = 3,226 HC (56% female). BD diagnoses were assessed according to the Diagnostic and Statistical Manual of Mental Disorders, fourth version (DSM-IV) or the International Statistical Classification of Diseases and Related Health Problems, 10th Revision (ICD-10). The sample was split into BD1 (n = 1,079, 58% female) or BD2 (n = 353, 65% female) for DSM-IV classified patients. The age range was 18–70 years. Current psychotic symptoms were assessed with the Positive and Negative Symptoms Scale (PANSS). Lifetime psychosis was obtained as a yes/no variable across sites. Clinical and demographic information, as well as estimated current medications are presented in Table 1, whereas site-specific information is shown in Table S1.
TABLE 1. Demographic and clinical information Cases (N = 1,472) Controls (N = 3,226) N % N % χ2/Wilcoxon rank-sum test p-Value Females (%) 884 60.1 1,793 55.6 8.1 .0045 Mean SD Mean SD Age (years)a 37.9 11.9 33.3 11.2 4.6 <.001 AOO (years)b 23.2 9.3 DOI (years)b 15.1 10.8 PANSS positivec 9.1 3.1 PANSS negatived 9.4 3.3 N N Lifetime psychosise 403/369/700 BD1/BD2/BD-NOSf 1,079/353/36 Medication Lithiume 363/749/360 Antipsychoticse 549/614/309 Antiepilepticse 363/495/614 Antidepressantse 278/580/614 Scanner field strength 1.5T; BD (BD1/BD2/BD-NOS); HC 436 (337/88/10) 496 3T; BD (BD1/BD2/BD-NOS); HC 1,036 (742/265/26) 2,730 Abbreviations: AAO, age at onset; DOI, duration of illness; BD, bipolar disorder; HC, healthy controls; NOS, not otherwise specified; PANSS, Positive and Negative Syndrome Scale.All subjects provided written informed consent and all participating sites obtained prior approval from their local ethics committees and institutional review boards, including approval to share anonymized data. The study was conducted in accordance with the Helsinki declaration.
2.2 Image processing and analysisStructural T1-weighted brain MRI scans were obtained at 23 sites following locally optimized scanner protocols. The majority of scans were acquired on 3T scanners (n = 21 scanners/3,766 scans) and the remaining were scanned at 1.5T (n = 6 scanners/932 scans), with all diagnostic groups represented across field strengths. Image acquisition parameters for each site are provided in Table S2. Images were processed locally with the automated and validated FreeSurfer software (http://www.freesurfer.net) following standardized ENIGMA protocols for harmonization and quality control across multiple sites (http://enigma.ini.usc.edu; Note S1). Subfield volumes were obtained using the hippocampal subfield segmentation algorithm in FreeSurfer v 6.0.0 (Iglesias et al., 2015) based on information from manual delineations of ultrahigh resolution (~0.1 mm isotropic) ex vivo MRI data. We obtained volumes for 12 subfield regions (CA1, CA2/3, CA4, molecular layer, granule cell layer of the dentate gyrus (GC ML DG; FreeSurfer naming convention), hippocampal tail, subiculum, presubiculum, parasubiculum, fimbria, hippocampal fissure, and the hippocampal amygdala transition area (HATA)), the whole hippocampus, and estimated intracranial volume (ICV). The segmented volumes were assessed for outliers at each site following standardized ENIGMA protocols. Any outlier volumes were visually inspected and removed if the segmentation quality was judged to be inadequate (Note S1).
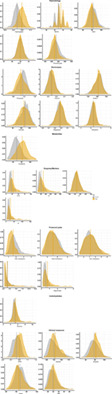
2.3 Statistical analysesAll statistical analyses were performed in R (version 3.5.2; http://R-project.org). Group differences in demographic and clinical variables were assessed with chi-squared tests for categorical data and t-tests/Wilcoxon rank-sum tests (Note S2) for normally/non-normally distributed continuous data, respectively. To assess the normality of distributions, we used the Shapiro–Wilk normality test. We also evaluated the distribution of the participants' whole hippocampus and hippocampus subfield volumes for normality (Figures S1 and S2).
Individual tabular data from all sites were pooled on a secure server at the University of Oslo for centralized analysis. For the main case–control analysis, a linear mixed-effects (LME) model was used to assess diagnostic differences in the whole hippocampus and hippocampal subfields volumes, with sex, age, age2, sex*age, sex*age2, and ICV as fixed-effects variables, and with scanner nested in field strength as random-effects variables. We included the age2 term because the hippocampus shows a nonlinear age-related trajectory with accelerating atrophy at more advanced age (Fjell et al., 2013). We used the lme-function from the nlme-package to fit the LME models. Because the left and right hemisphere subfield volumes were highly correlated, and we did not have an a priori hypothesis on laterality, the left and right hemisphere volumes of each subfield were combined (summed) in order to reduce the number of tests and increase statistical power. For completeness, we investigated the model for each hemisphere separately. We also performed analyses with field strength added as a fixed factor to address possible confounding effects of field strength on the volume results.
Follow-up analyses of BD1 versus BD2 subgroup differences were performed using similar LME models that included sex, age, age2, sex*age, sex*age2, and ICV as fixed-effects variables, and scanner nested in fields strength as random-effects variables. Firstly, we compared BD1 and BD2 to each other, and then secondly, we compared each BD subtype to HC in separate analyses, unless otherwise stated. We used this approach to determine the effects of lifetime psychosis (i.e., the occurrence of any episode of psychosis during mood episodes throughout life), which cuts across the BD1/BD2 categorization. In separate analyses, we analyzed associations between current positive or negative psychotic symptoms, duration of illness, age at illness onset and subfield volumes among patients only, while adjusting for BD1/BD2 categorization. Finally, within individuals with BD1, we analyzed the effects of current medication use for each group of medication (i.e., lithium, antipsychotics, antidepressants, or antiepileptics), and performed a joint examination of the effects of all medication groups. Current medication use was stratified into users/non-users based on the available medication data from each site and for each group of medication. In the first set of medication analyses, we directly compared medication users with non-users. In the second set of medication analyses, users and non-users were separately compared to HC. We limited the joint examination of all medication groups to patients only. Medication analyses were restricted to the BD1 group to avoid potential confounding effects of the different medication regimes, clinical characteristics, and hippocampal volumetry associated with BD1 and BD2. We did not perform separate medication analyses in the BD2 group, as it was smaller and had limited information on medication.
We computed Cohen's d effect size estimates from the t-statistics from the LME models (Nakagawa & Cuthill, 2007). To adjust for multiple comparisons, Bonferroni correction for N tests with α = .05 was applied, where N is the number of tests for the combined right and left hemisphere subfields (and whole hippocampus) which gives a significance threshold at p = .0038 (13 tests). We used forest plots to visualize possible site differences (Note S3).
3 RESULTS 3.1 Demographic variablesThe BD group was significantly older ( = 4.6/p < .001) and included more women (χ2 = 10.8/p = .0045) than the HC group. Demographic and medication information are listed in Table 1 and shown in Figure S3 (for site-specific information see Table S1).
Among the individuals with BD1 included in the medication analyses, 165 received antipsychotics, 151 received lithium, 42 received antiepileptics, and 28 received antidepressants. In addition, 168 received lithium in combination with antipsychotics, antiepileptics, antidepressants, or a combination of the three, and 196 received antipsychotics, antiepileptics and/or antidepressants in different combinations (Figure S4 for details). Demographic variables for the BD1 group are listed in Table S3.
3.2 Bipolar disorder versus healthy control differences in hippocampus subfield volumesIn the main LME analysis, individuals with BD showed significantly smaller whole hippocampus volume (Cohen's d = −0.20, p = 3.1e−10) compared to HC (Figure 1a, Table S4). Smaller volumes were present across most subfields, including the hippocampal tail, subiculum, presubiculum, CA1, CA2/3, CA4, molecular layer, GC ML DG, and HATA, with the largest effect sizes for the molecular layer (d = −0.21) and GC ML DG (d = −0.21). Split hemisphere analyses showed a similar pattern of subfield volume reductions in the left and right hippocampus (Figure S5a). Forest plots illustrate the patterns of subfield volume reductions across sites (Figure S6). The introduction of a fixed term for field strength resulted in no significant effect for the latter and did not alter the group analysis results from the main model (data not shown).

Hippocampal subfield volume differences between patients with bipolar disorder and healthy controls. Notes: (a) all bipolar disorder patients compared to healthy controls, (b) patients with bipolar 1 (n = 1,079) and bipolar 2 (n = 353) compared to healthy controls. Significant differences indicated by *. CA3 implies CA2/3. CA, cornu ammonis; GC ML DG, granule cell layer of dentate gyrus; HATA, hippocampal amygdala transition area; HP, hippocampus
3.3 Bipolar disorder subtype and clinical characteristics effects on subfield volumeFollow-up analyses of BD-subtypes showed no significant volumetric differences between BD1 and BD2 for the whole hippocampus or any of the subfields (Table S5). Smaller whole hippocampus volume was found in BD1 (Cohen's d = −0.22, p = 8.9e−11) but not BD2 (d = −0.11, nominally significant) compared to HC (Figure 1b; Table S6a). In BD1, volumes were smaller across most subfields, including the hippocampal tail, subiculum, presubiculum, CA1, CA2/3, CA4, molecular layer, GC ML DG, and HATA. The effect sizes were slightly larger than in the main analysis (including all BD subtypes), with the largest effects for the GC ML DG (d = −0.23) and molecular layer (d = −0.23). In BD2, there were nominally significant findings for CA1, CA4, GC ML DG, and molecular layer volumes when compared to HC. Split hemisphere analyses showed a similar pattern of subfield volume alterations for both hemispheres (Figure S5b; Table S6b,c). Forest plots of BD1 and BD2 subfield volumes when compared to HC also showed differences across sites (Figures S7 and S8).
In follow-up analyses of the whole BD group, patients with and without a history of lifetime psychosis (available in 403 patients versus 369 without) both showed similar effect patterns compared to HC across subfield volumes (Figures 2 and S9; Table S7). Current psychosis symptoms, age at onset, and illness duration were not associated with any of the hippocampal subfield volumes (Tables S8–S11).

Hippocampal subfield volume differences between bipolar disorder patients with or without a lifetime history of psychosis, and healthy controls. Notes: Bipolar patients with (n = 403) and without (n = 369) a diagnosis of lifetime psychosis compared to controls. Significant differences indicated by *. CA3 implies CA2/3. CA, cornu ammonis; GC ML DG, granule cell layer of dentate gyrus; HATA, hippocampal amygdala transition area; HP, hippocampus
3.4 Medication effectsIndividuals with BD1 taking lithium at the time of scan (n = 319) showed significantly larger volumes for the whole hippocampus (d = 0.22, p = .0028), molecular layer (d = 0.23), GC ML DG (d = 0.22), and smaller hippocampal fissure (d = −0.24), compared to those not taking lithium (n = 464) after applying Bonferroni correction (Table S12). Individuals with BD1 and taking lithium did not show significant volume differences in any subfield or for the whole hippocampus compared to HC. Conversely, individuals with BD1 who were not on lithium showed significant volume reductions compared to HC. Importantly, the effect sizes from the BD1-nonlithium versus the HC analysis were greater than the effect sizes from the main analysis comparing all BD subjects with HC, with largest effect sizes for the molecular layer (d = −0.32), GC ML DG (d = −0.30), CA1 (d = −0.27), CA4 (d = −0.27), presubiculum (d = −0.28), and whole hippocampus (d = −0.31) (Figure 3; Table S13). These effects were similar bilaterally (Figure S10).

Hippocampal subfield volume differences between lithium users and nonusers among bipolar disorder 1 patients, and healthy controls. Notes: Bipolar 1 lithium users (n = 319) and nonusers (n = 464) compared to healthy controls (reference). Significant structures indicated by *. CA3 implies CA2/3. CA, cornu ammonis; GC ML DG, granule cell layer of dentate gyrus; HATA, hippocampal amygdala transition area; HP, hippocampus
Among individuals with BD1, antipsychotics users (n = 472) showed significantly smaller presubiculum volume than antipsychotics non-users (n = 385) (d = −0.24, p = 7e−04) (Table S14). Significant volume reductions were found across subfields in individuals with BD1 who used antipsychotics relative to HC, with largest effects in presubiculum (d = −0.3), molecular layer (d = −0.28), GC ML DG (d = −0.27), and CA4 (d = −0.24) (Figure S11a; Table S15) and these effects were bilateral (Figure S12a). Individuals with BD1 who did not use antipsychotics had smaller volumes of the GC ML DG (d = −0.16) and CA4 (d = −0.15) compared to HC. The effect sizes for the volume reductions were larger in individuals with BD1 who used antipsychotics than in non-users, when compared to HC.
Individuals with BD1 who used antiepileptics (n = 256) had significantly smaller hippocampal tail (d = −0.25) volumes compared to individuals with BD1 who did not use antiepileptics (n = 309) (Table S16). Compared to HC, both individuals with BD1 who used and who did not use antiepileptics showed volume alterations similar to those detected with the main model (All BD versus HC)—with larger effect sizes among individuals with BD1 who used antiepileptics (Figures S11b and S12b; Table S17).
Antidepressant use was not associated with specific subfield volume differences among individuals with BD1 (Table S18), and both antidepressant users (n = 155) and nonusers (n = 410) showed a similar pattern of smaller subfield volumes compared to HC (Figures S11c and S12c; Table S19).
Finally, to better understand the potential medication effects in individuals on more than one medication at the time of scan, a model in which all medications were included as fixed covariates was used to determine the potential effect of each medication while controlling for all other medications. We had complete medication information for a subset of individuals with BD1 (n = 565), of which n = 53 were unmedicated at the time of scanning. Of the medicated patients (n = 512), there were n = 181 lithium users, n = 343 antipsychotics users, n = 155 antiepileptics users, and n = 256 antidepressant users in different combinations (see Figure S13 for details). Antipsychotics users showed significantly smaller presubiculum volume (d = −0.28) compared to non-users when adjusting for lithium, antiepileptics, and antidepressant use. No other medication showed a significant volume effect when simultaneously adjusting for all other medications (Table S20).
4 DISCUSSIONThis largest study of hippocampal subfield volumes in BD to date, had five key findings: (a) individuals with BD had smaller volumes across most subfields compared to HC, (b) individuals with the BD1 subtype showed largest effect sizes when compared to HC, (c) volumes in lithium users did not differ from HC, (d) antipsychotics and antiepileptics users showed smaller volumes compared to non-users, and (e) altered volumes were not associated with other clinical characteristics. By pooling data sets to include over 4,600 participants, these results confirm and extend our current knowledge of hippocampal structure in BD.
The main finding of smaller subfield volumes across the hippocampal subfields in BD is partly in line with the results from prior studies (Cao et al., 2017; Haukvik et al., 2015; Mathew et al., 2014) and one meta-analysis (Haukvik et al., 2018). In accordance with previous heterogeneous results, the forest plots demonstrate a high degree of heterogeneity across the included sites, which may help explain the disparate findings across prior studies. We found largest effect sizes for volume differences between BD and HC for the molecular layer, presubiculum, GC ML DG, CA4, and CA1, in line with previous findings (Haukvik et al., 2018). The molecular layer was not delineated as an independent structure in the earlier version of the FreeSurfer hippocampal subfield segmentation algorithm (Van Leemput et al., 2009), which was used in most prior studies. However, Cao et al. found smaller molecular layer volumes in BD with the same subfield segmentation as used in the present study (Cao et al., 2017). The molecular layer stretches as a dark band from the DG along the CA subfields to the subiculum. It is relatively cell free (Iglesias et al., 2015) but contains dendrites from DG neurons (Amaral, Scharfman, & Lavenex, 2007). We may speculate that the smaller molecular layer could reflect loss of dendritic connections or DG neurons of which hyperexcitability has been linked to successful lithium treatment in BD (Mertens et al., 2015; Stern et al., 2018). Some (Mathew et al., 2014), but not all (Cao et al., 2017; Haukvik et al., 2015), prior studies have reported smaller presubiculum volumes in BD. The presubiculum is part of the outflow region of the hippocampus—together with the parasubiculum and the more well-defined subiculum subfields—and is involved in visuospatial processing and orientation (Dalton & Maguire, 2017; Simonnet et al., 2017). As expected from prior findings, individuals with BD also showed lower volumes in the CA4, CA1, GC ML DG, and in the subiculum (Haukvik et al., 2018). Finally, we found significantly lower CA2/3 volume in BD, as hypothesized on the basis of previous studies (Cao et al., 2017; Haukvik et al., 2015; Mathew et al., 2014) and the presumed role of this subfield in the pattern completion thought to underlie the formation of psychotic thought content (Tamminga et al., 2010).
We found that the effect sizes for the case–control volume differences across the hippocampus were larger in BD1 than BD2. This is in line with the results from Cao et al. (2017), and may suggest a stronger hippocampus related neurobiological component in BD1 than in BD2. However, given the lack of significant differences in the direct BD1 versus BD2 comparison, it could also reflect the smaller number of individuals with BD2. The BD2 results may also be confounded by the greater clinical heterogeneity that is displayed by the BD2 compared to the BD1 subtype (Phillips & Kupfer, 2013).
Medication use, in particular the use of lithium, was associated with the subfield volumes across the hippocampus, which confirms and extends results from prior studies (Bearden et al., 2008; Hartberg et al., 2015; Simonetti et al., 2016). Lithium users did not show significant volume deficiencies compared to healthy controls, whereas the nonusers did. These results may reflect a neuroprotective effect of lithium on hippocampal subfield volumes, which is in line with previous whole brain MRI volumetric studies (Berk et al., 2017). In accordance with this understanding are also animal studies showing enhanced neural proliferation (Zanni et al., 2017), stem cell studies showing increased progenitor cell proliferation (Ferensztajn-Rochowiak & Rybakowski, 2016), the increased numbers of neurons and glia in the DG (Rajkowska et al., 2016) following lithium use shown in postmortem studies. Furthermore, we observed that antipsychotic or antiepileptic medication use was associated with smaller subfield volumes, and the effects of antipsychotic use on the presubiculum volume remained significant after controlling for all other psychopharmacological use. The smaller volumes are consistent with previous BD studies showing a negative association between antipsychotics or antiepileptics and neurostructural measures (Fusar-Poli et al., 2013; Hibar et al., 2016). Antipsychotics have been shown to increase hippocampal neurogenesis and cell proliferation (Balu & Lucki, 2009), but the effects on hippocampal volumes from human MRI (Bodnar et al., 2016) and animal (Crum et al., 2016; Schmitt et al., 2004) studies have been mixed. Our results, taken together with the lack of an association between duration of illness, current or lifetime psychosis, or age at illness onset on any of the subfield volumes, may suggest that putative neurogenic and cell-proliferative effects of antipsychotic medication were not large enough to affect hippocampal subfield volumes. We did not observe any association between subfield volumes and anti-depressant medication, despite previous reports of subfield-volume enlargement in patients with major depressive disorder after selective serotonin reuptake inhibitor or serotonin nor-adrenalin reuptake inhibitor treatment (Katsuki et al., 2020; Maller et al., 2018). This could be due to confounding by other medication use or symptom pathophysiology or severity characteristics within our sample.
Certain limitations of our study
留言 (0)