
記住我
The liver is the central organ for metabolism and transport of lipids in Atlantic salmon. It is an important site for lipid β-oxidation (Stubhaug et al., 2005; Stubhaug et al., 2007), lipoprotein and triacylglyceride (TAG) synthesis (Kjær et al., 2008; Moya-Falcon et al., 2005; Vegusdal et al., 2005), as well as synthesis of cholesterol and bile (Cruz-Garcia et al., 2009; Leaver et al., 2008). Any imbalance in these processes can lead to lipid accumulation in the liver, which over time, can negatively impact liver function and health. Fatty liver, known as hepatic steatosis, is characterized by accumulation of lipids, primarily TAG, free fatty acids (FFA), and cholesterol (Puri et al., 2007). Triglycerides can be synthesized from FFA in the liver, and is assembled into very low-density lipoprotein (VLDL) particles for secretion. Under normal circumstances only small amounts of TAG are stored in the liver in lipid droplets (Alves-Bezerra and Cohen, 2017).
Pathological accumulation of lipids in hepatocytes is thoroughly studied in humans, and characterizes non-alcoholic fatty liver disease (NAFLD), or as recently proposed “metabolic-associated fatty liver disease” (MAFLD), which can progress from simple steatosis to end-stage liver diseases (Heeren and Scheja, 2021). It is closely related to disturbances in energy metabolism, and is linked to factors like disrupted lipid metabolism, increased cholesterol synthesis, inflammation, oxidative stress, lipotoxicity and mitochondrial dysfunction (Banini and Sanyal, 2016; Puri et al., 2007). There are several known genetic polymorphisms with strong links to liver fat accumulation in humans, including Patatin-like phospholipase domain-containing protein 3 (PNPLA3), Apolipoprotein C3 (APOC3), and Glucokinase regulator (GCKR) (Eslam et al., 2018; Namjou et al., 2019; Romeo et al., 2008).
The characterization of hepatic steatosis in Atlantic salmon remains relatively unexplored. There is currently a knowledge gap regarding what level of liver fat is unhealthy for the fish, and what metabolic factors are causing variation in the level of liver fat in Atlantic salmon. The question of whether lipid accumulation in the liver of salmon mirrors that observed in rodents and humans is still unanswered, although preliminary evidence suggests a similarity. Espe et al. (2019) have developed a fatty liver model in Atlantic salmon liver cells, which closely resembles the established mammalian model. Just as in mammals, elevated levels of liver fat in Atlantic salmon have been associated with adverse health effects and increased mortality. Dessen et al. (2020) observed a link between increased liver fat and sudden mortality of seemingly healthy Atlantic salmon in sea cages. Increased levels of liver lipids in Atlantic salmon are typically seen in feed trials involving high inclusions of vegetable oils and low levels of omega-3 fatty acids, where it coincides with reduced health and increased mortality rates (Bou et al., 2017; Torstensen et al., 2011). Hepatic steatosis is therefore considered a typical essential fatty acid deficiency symptom in salmonids, where it is characterized by a pale and swollen appearance of the liver (Ruyter and Thomassen, 1999).
Kjaer et al. (2008) showed that high dietary levels of the marine omega-3 fatty acids lowered TAG secretion from salmon hepatocytes, and lowered liver fat deposition. It is therefore assumed that salmon fed a high fish-oil diet rich in marine omega-3 fatty acids will not develop unhealthy high levels of liver fat. However, in a previous study by our group, we measured the liver fat content of ∼50 slaughter-sized Atlantic salmon fed a commercial broodstock feed, and found large variation among the fish (Horn et al., 2019). A recent study corroborates our findings, demonstrating high individual variation in total liver fat within feed groups (Hundal et al., 2022). This prompted us to investigate the genetic variation underlying this trait. The use of selective breeding programs to improve traits of commercial interest have been ongoing since the late 1960s in Atlantic salmon aquaculture (Gjedrem, 2005). It is unknown if liver fat is a heritable trait suitable for inclusion in Atlantic salmon selective breeding programs. The apparent importance of liver fat regarding fish health and robustness, together with the high mortality rate of salmon production suggest that selective breeding for this trait have the potential to improve fish welfare and reduce production costs in Atlantic salmon farming.
The specific aims of the present study were to genetically and metabolically characterize individual differences in liver fat content in Atlantic salmon through gene expression analysis, quantitative genetic analysis and genome-wide association analysis in order to increase the knowledge on liver fat deposition in slaughter-sized farmed salmon and evaluate the potential for genetic improvement of the trait.
2 Materials and methods2.1 Fish populations and recordingsThe fish studied originated from families and documentation groups from the 2014 years-class of the SalmoBreed Atlantic salmon strain of Benchmark Genetics Norway AS, former SalmoBreed AS. The fish were transferred to sea at a mean weight of 0.1 kg, and slaughtered approximately 12 months later, at a mean weight of 3.6 kg. The fish were fed a commercial broodstock feed from Skretting AS with a relatively high fish oil content, where the sum of EPA and DHA comprised 6.2% of feed, and 17% of total fat in feed (Supplementary Material S1). All the fish were reared under the same conditions and were fasted 13–14 days prior to slaughter.
At slaughter, sex was determined visually by inspection of the gonads, body and liver weight was recorded, and liver color, used as an indicator of the degree of fatty liver, was determined visually on a scale of 1 (darkest color, i.e., healthy liver) to 5 (lightest color i.e., highest amount of fat) (Mørkøre et al., 2012). For the data analysis, liver color scale was reversed to allow for a more intuitive presentation of results. Hepatosomatic index (HSI) was calculated as (liver weight/body weight)*100. Liver tissue samples for RNA-sequencing were taken from each individual fish at harvest, immediately frozen in liquid nitrogen, and subsequently stored at – 70°C. Liver samples for lipid and fatty acid analysis were collected at harvest, frozen and stored at −20°C.
The fish material in the current study was part of the dataset described in Horn et al. (2019), where the fish were analyzed for skeletal muscle lipid and fatty acid composition. In the current study, livers of 610 fish were analyzed for lipid level (grams lipid per 100 g liver), and liver tissue of 48 fish was selected for RNA-sequencing and liver fatty acid analysis. The selected 48 individuals were of similar bodyweight (3.3–3.9 kg) in order to minimize the effects of size, and had skeletal muscle fat level within the normal range (16%–25%) to avoid outlier individuals regarding lipid deposition in muscle. The selected individuals were 55% males and 45% females and originated from 39 sires and 48 dams.
2.2 Lipid and fatty acid analysisTotal lipids were extracted from homogenized liver samples of individual fish, according to the Folch method (Folch et al., 1957). Using the chloroform-methanol phase, fatty acid composition was analyzed following the method described by Mason and Waller (1964). The extract was dried briefly under nitrogen gas and residual lipid extract was trans-methylated overnight with 2′,2′-dimethoxypropane, methanolic-HCl, and benzene at room temperature. The methyl esters formed were separated in a gas chromatograph (Hewlett Packard 6,890; HP, Wilmington, DE, USA) with a split injector, using an SGE BPX70 capillary column (length 60 m, internal diameter 0.25 mm, and film thickness 0.25 μm; SGE Analytical Science, Milton Keynes, UK) and a flame ionization detector. The results were analyzed using HP Chem Station software. The carrier gas was helium, and the injector and detector temperatures were both 270°C. The oven temperature was raised from 50°C to 170°C at the rate of 4°C/min, and then raised to 200°C at a rate of 0.5°C/min and finally to 240°C at 10°C/min. Individual fatty acid methyl esters were identified by reference to well-characterized standards (23:0). The content of each fatty acid was expressed as a percentage of the total amount of fatty acids in the analyzed sample. Liver fat was expressed in %, and calculated by dividing the weight of total lipids in the liver sample by the total weight of the liver sample.
2.3 Gene expression analysisTotal RNA was extracted from liver tissues of 48 fish using the PureLink Pro 96 RNA Purification Kit (Invitrogen), according to the manufacturer’s instruction. RNA was treated with PureLink On-Column DNase Digestion (Invitrogen) to remove any contaminating DNA. Samples were shipped to The Norwegian High-Throughput Sequencing Centre, where the mRNA library preparation and sequencing of transcripts were performed using standard protocols (www.illumina.com). Samples were sequenced on an Illumina HiSeq platform as paired-end 151 bp reads.
Processing of reads, alignment and annotation was performed according to Moghadam et al. (2017). Expression data were normalized via the median of the geometric means of fragment counts across all sample (Anders and Huber, 2010). Cufflinks and Cuffdiff were used to estimate the expression abundances of the assembled genes and transcripts (Trapnell et al., 2010). Gene expression data were normalized by calculating the aligned fragments per kilobase per million mapped fragments (FPKM). Normalized gene expression data were log2 transformed prior to the statistical analysis.
Trait-associated genes were defined by using linear regression analysis, testing for an association between the continuous trait and mRNA expression. The liver content of fat (%) was considered the response variable and each individual gene expression an explanatory variable in the model. As suggested by Seo et al. (2016), univariate analyses were carried out for each trait. The following general linear mixed model was fitted:
Traiti=β0+β1Expression1i+βmSexmi+βpFamilypi+εi,εi ∼ N 0,σ2where i represents the individuals, Expressioni indicates the normalized gene expression value. Traiti represents the trait liver fat %. Covariates: Sexmi represents the fixed effect of sex (male or female), and Familypi represents the random effect of family (1–48). Genes were considered significantly associated with the trait when the p-value of the regression coefficient was <0.05. Genes of interest are presented with their regression coefficient (Figures 6–8). All significant genes are presented in Supplementary Material S2.
2.4 Enrichment analysisA search for enriched GO classes and KEGG pathways in the list of 1,872 trait-associated genes was performed by counting of genes among the 1,781 trait-associated genes that passed quality control. Enrichment was assessed with Yates’ corrected chi square test (p < 0.05). Terms with less than five genes were not taken into consideration.
2.5 GenotypingThe fish were genotyped using a customized ∼57 K axiom Affymetrix SNP Genotyping Array (NOFSAL02). From the initial ∼57 K SNPs quality filtering was performed using criteria of call rate >0.9, minor allele frequencies >0.02, and Hardy-Weinberg equilibrium correlation p-value >0.001. A total of 52,925 SNPs passed quality control filtering and were used to compute the genomic relationship matrix (GRM) and in the GWAS.
2.6 Estimation of genetic parametersVariance components were estimated from a univariate restricted maximum likelihood (GREML) analyses, with “--reml” function in GCTA program (Yang et al., 2014) with the following model on a total of 610 fish:
where Y is the vector of phenotypic observations of all individuals; µ is overall mean; β is the vector of fixed effect of sex; X is the corresponding incidence matrix; u is the vector of additive genetic effects with u∼N0,Gσu2, where σu2 is the additive genetic variance, and Z the corresponding incidence matrix; and e is the vector of random residual effects with e∼N0,Iσe2. G is a genomic relationship matrix (GRM) which was computed according to VanRaden (2008) as ZZ′2∗∑i=1Nsnppi1−pi ; where pi is the allele frequency of second allele and Nsnp is the total number of SNP markers.
Heritability (narrow sense) was estimated as the ratio of additive genetic variance to total phenotypic variance. Genetic correlations between pairs of phenotypes were estimated with “--reml-bivar” function in GCTA, using a bivariate model - a direct extension of the above univariate model where the vectors were extended to matrices (Lee et al., 2012).
The Coefficient of variation was calculated as the ratio of the standard deviation to the mean.
Due to the presence of negative skewness in phenotype distribution (Figure 1), log transformation for the liver fat phenotype was tested. However, results regarding genetic parameters and GWAS did not differ significantly when analyzed with non-log vs log-transformed phenotypes. Results published were based on non-log transformed data.
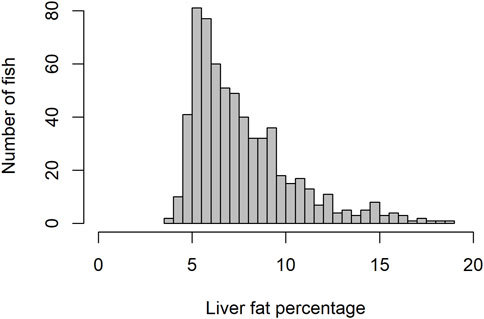
Figure 1. Histogram showing distribution of liver fat percentage.
2.7 GWASGenome wide association analysis was performed using the following linear mixed animal model implemented in GCTA program with the “–mlma-loco” function (Yang et al., 2014).
where y is a vector of n = 610 trait records, μ is an overall mean; b is a vector of fixed effects including (phenotypic) sex and 2 principal components as covariates; X is the incidence matrix for the effects contained in b; S is the incidence matrix for SNP containing marker genotypes coded as 0=AA,1=AB|BA,2=BB, α is the allele substitution effect of each SNP, Z is the incidence matrix of genotyped individuals, u is the vector of additive genetic effects with u∼N0,Gσu2, where σu2 is the additive genetic variance, and e is the vector of random residual effects with e∼N0,Iσe2.
The trait SNP association was considered significant using two thresholds: i) genome-wide significance with stringent level and ii) chromosome-wide significance with relatively less stringent. SNPs were considered genome wide significant when they exceeded the Bonferroni threshold for multiple testing (alpha = 0.05) of 0.05/tg, where tg = 52,925 (total number of SNPs genome-wide). SNPs were considered chromosome-wide significant when Bonferroni threshold for multiple testing surpassed (alpha = 0.05) 0.05/tc, where tc = 1825 (average number of SNPs per chromosome). The obtained genome-wide significant threshold used in of this study was p≤9.4×10⁻⁷ which is equivalent to −log10p=6.0, while chromosome-wide significant threshold was opted to be p≤2.7×10⁻⁵ which is equal to −log10p=4.6.
A quantile-quantile (Q-Q plot) plot with distribution of observed vs expected p-values was checked, and the Inflation factor (lambda, λ) was calculated using following equation:
3 Results3.1 Liver fat content and fatty acid compositionThe level of fat in livers of the studied fish displayed large variation, ranging from 3.6% to 18.8%, with a mean of 7.7%. The trait did not display normal distribution. There seemed to be a minimum level of liver fat of about 4%, and only 16% of the 634 fish had a liver fat content higher than 10% (Figure 1). There were significant positive phenotypic correlations between liver fat and both body weight and muscle fat, but the correlations were relatively low (Figure 2). Fish with low liver fat content displayed large variation in body weight and muscle fat, while fish with more than 10% liver fat all had medium to high muscle fat level. There was no significant correlation between liver fat percentage and hepatosomatic index (HSI) (Figure 2).
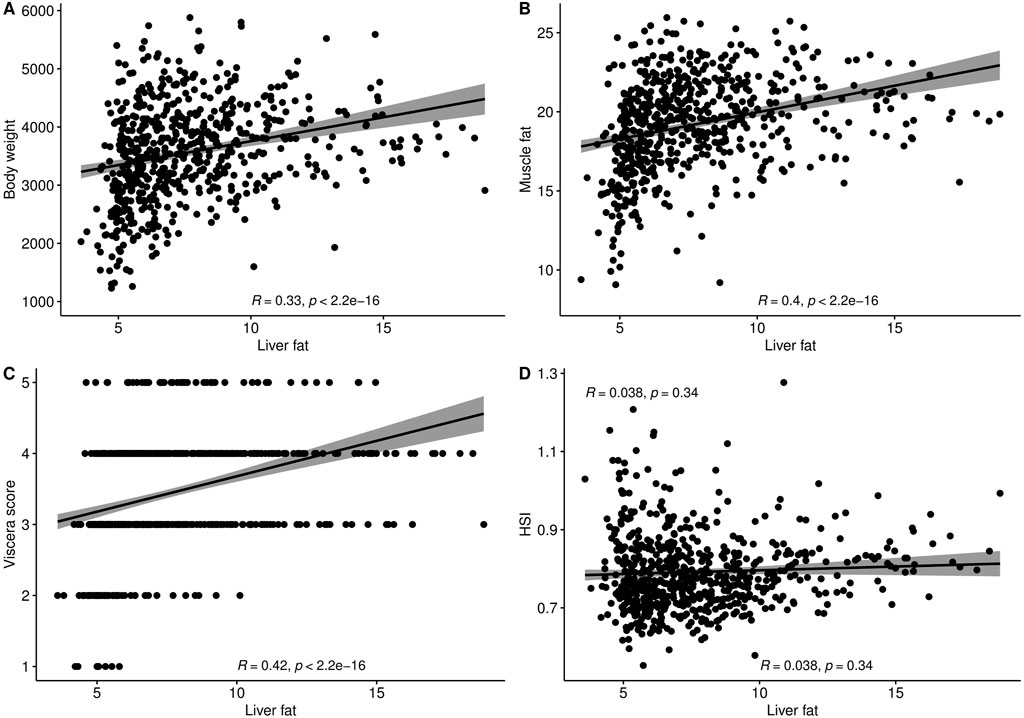
Figure 2. Phenotypic correlation plots and Spearman correlation coefficients of liver fat (%) with (A) Body weight (g), (B) Muscle fat (%), (C) Viscera score, and (D) Hepatosomatic index (HSI).
The 48 fish selected for RNA sequencing and analysis of liver fatty acid composition showed that within a 600 g body weight range, the liver fat percentage varied greatly, from 5% to 19% (Table 1). The major fatty acids in the liver, constituting more than 47% of liver fatty acids, were oleic acid (18:1n-9; 22%), DHA (22:6n-3; 14%) and palmitic acid (16:0; 11%). There was a small variation in the EPA relative content of liver (5%–8%), compared to a relatively large variation in DHA relative content (6%–20%). This is opposite to what we found in the muscle of the same fish material, where the DHA relative content was more stable, and EPA varied significantly (Horn et al., 2019). The mean DHA relative content was also higher in liver compared to muscle, although the quantitative content of DHA was higher in muscle due to the higher fat content of muscle.
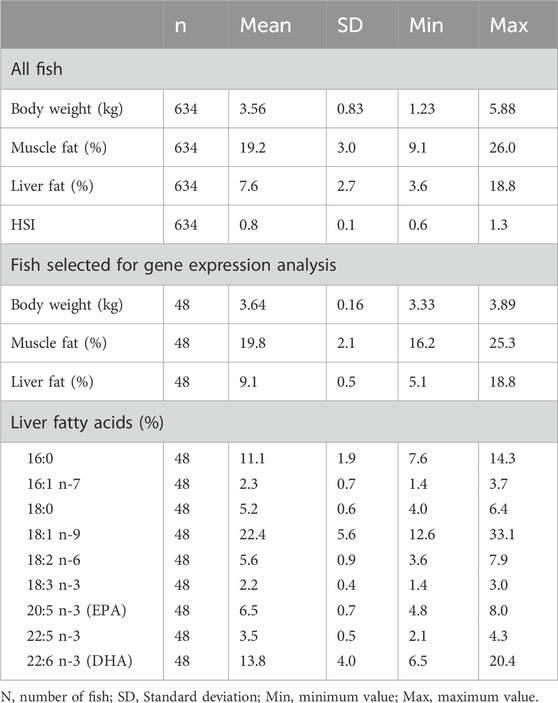
Table 1. Descriptive statistics of all fish, and fish in the gene expression analysis (n = 48).
The phenotypic correlations between liver fat and individual fatty acids showed that in this group of fish of similar size, the fattier livers had a significantly higher percentage of 16:1 n-7, 18:2n-6 and 18:1n-9. The percentage of the marine omega-3 fatty acids EPA and DHA decreased significantly with increasing liver fat (Figure 3). Interestingly, palmitic acid (16:0), the most common saturated fatty acid in the body, followed the same pattern as EPA and DHA.
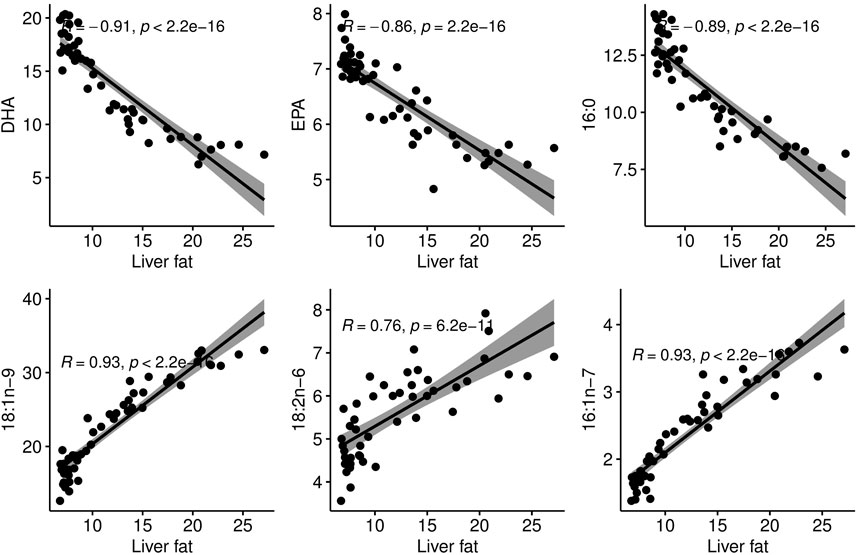
Figure 3. Correlation plots between liver fat percentage and proportional content of individual fatty acids in the liver.
3.2 Heritability of liver fatThis study is the first to report the heritability of liver fat content in Atlantic salmon. The heritability estimate for liver fat content was 0.38, with a standard error of 0.07 (Table 2). The genetic standard deviation was 1.6% fat, corresponding to a genetic coefficient of variation of approximately 20%. The genetic correlations between liver fat and the other traits were similar to the phenotypic correlations, although the genetic correlation with muscle fat was stronger than with body weight or viscera score (Table 3). The genetic correlation between liver fat and liver score was 0.7, which was slightly stronger than the phenotypic correlation.
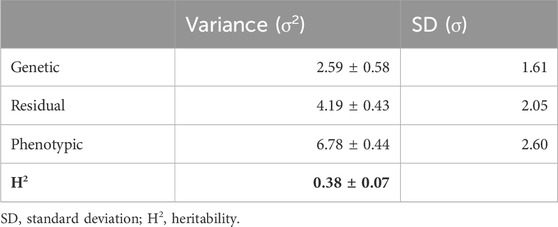
Table 2. Genetic parameters of liver fat.
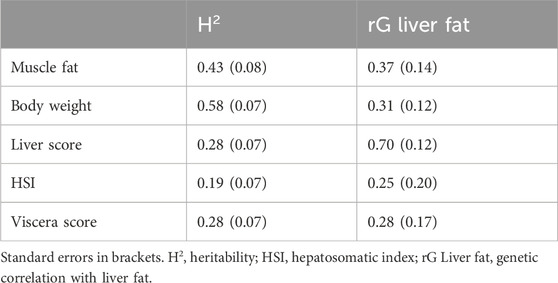
Table 3. Genetic correlations between liver fat and lipid-related traits.
3.3 Genome wide association studyThere were no SNPs surpassing the Bonferroni corrected genome-wide significance threshold, but two SNPs did surpass the chromosome-wide threshold (Figure 4). These SNPs were AX-87183264, located on chromosome 15 (p-value 7.23e-06), and AX-98317599, located on chromosome 23 (p-value 1.17e-05). We used functional annotation data (Assembly Ssal_v3.1 (GCF_905237065.1)) to perform a detailed investigation of genes located within approx. ±200 kb of the 10 most significant SNPs to identify candidate genes that may influence lipid deposition in the liver. The top 10 SNPs and the candidate genes detected within this specified region are detailed in Supplementary Material S3.
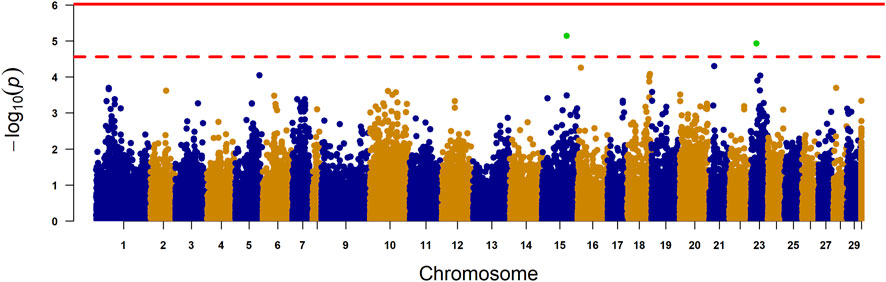
Figure 4. Manhattan plot for liver fat content. The X-axis represents the chromosomes, and the Y-axis shows the–log 10 (p-value). The solid line represents Bonferroni-corrected genome-wide significant threshold. The dashed line represents the suggestive chromosome-wide significance threshold. The final yellow column is for SNPs with unknown genome placement. Lambda = 1.18.
No known genes of direct relevance were detected underlying the QTL region on chromosomes 23 and 16. One of the genes located closest to the top SNP on ssa15 is Mechanistic target of rapamycin kinase (mTOR). mTOR regulates lipid metabolism and has been suggested as a potential new target in NAFLD (Feng et al., 2022). In salmonids, research has shown that Rainbow trout genetically selected for greater muscle fat content display increased activation of liver TOR signaling and lipogenic gene expression (Skiba-Cassy et al., 2009). Within a 120 kb region of the top SNP on chromosome 21, we identified the gene Glycerol-3-phosphate dehydrogenase (GPDH). This enzyme is crucial for linking carbohydrate metabolism to lipid metabolism. Our findings revealed a significant association between the expression of GPDH and liver fat deposition (see Supplementary Material S2). Although the expression was attributed to a copy of the gene located on a different chromosome (ssa12), the salmon genome contains multiple copies of the GPDH gene. This redundancy may lead to challenges in accurately differentiating or assigning the transcribed copies to their respective genes within the transcriptome. Consequently, the observed gene expression results may reflect genetic variation in the gene located on ssa21. Three of the top 10 SNPs were located on ssa18 in the region from 64,700,815 to 65,948,775 bp. We identified one gene in the nearby region known to be linked to lipid deposition in the liver: Perforin 1. Perforin 1 has been linked to NAFLD in both humans and mice through its role in regulating the immune system. One study showed that perforin-deficient mice exhibit increased lipid accumulation in the liver and more liver inflammation when subjected to a high-fat diet (Wang et al., 2020). Indeed, the expression of two perforin-1-like genes was negatively associated with liver fat deposition in our study (Supplementary Material S2). Within 20 kb of the top SNP on ssa05 is the gene for Hormone-sensitive lipase (HSL). HSL is a key enzyme involved in the hydrolysis of triglycerides into free fatty acids and glycerol. Studies have shown that individuals with hereditary deficiency of HSL develop fatty liver (Xia et al., 2017). The gene expression of HSL was not significantly associated with liver fat in our study.
3.4 Gene expression associations with liver fatThe gene expression association analysis identified 1781 genes as significantly associated with liver fat. In total, 74 KEGG/GO pathways were enriched (Supplementary Material S4). We limit this paper to metabolic processes involved in lipid metabolism and/or linked to fatty liver in mammals. This includes cholesterol biosynthesis, de novo lipogenesis (DNL), triacylglyceride (TAG) synthesis, phospholipid synthesis and beta-oxidation. Genes of interest are presented in Figures 6–8 with their regression coefficients. All significant genes are presented in Supplementary Material S2.
3.4.1 Cholesterol biosynthesisNine genes directly involved in the biosynthesis of cholesterol from acetyl-CoA, known as the mevalonate pathway, were significantly associated with liver fat content. This included the rate-limiting enzyme in cholesterol biosynthesis, hydroxymethyl-glutaryl-CoA (HMG-CoA) reductase, as well as squalene synthase, which catalyzes the first committed step in cholesterol formation (Liscum, 2008). All nine genes had a positive association with liver fat, indicating that fish with higher liver fat content had a higher production of cholesterol (Figures 5, 6).
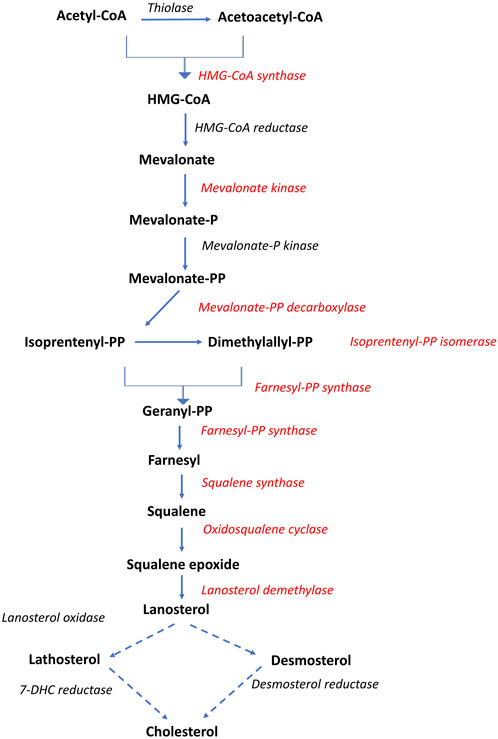
Figure 5. Overview of the cholesterol biosynthetic pathway (Mevalonate pathway). Dotted arrows indicate that multiple enzymatic steps are involved. Red text indicates gene expression positively associated with liver fat. Adapted after Liscum, 2008.
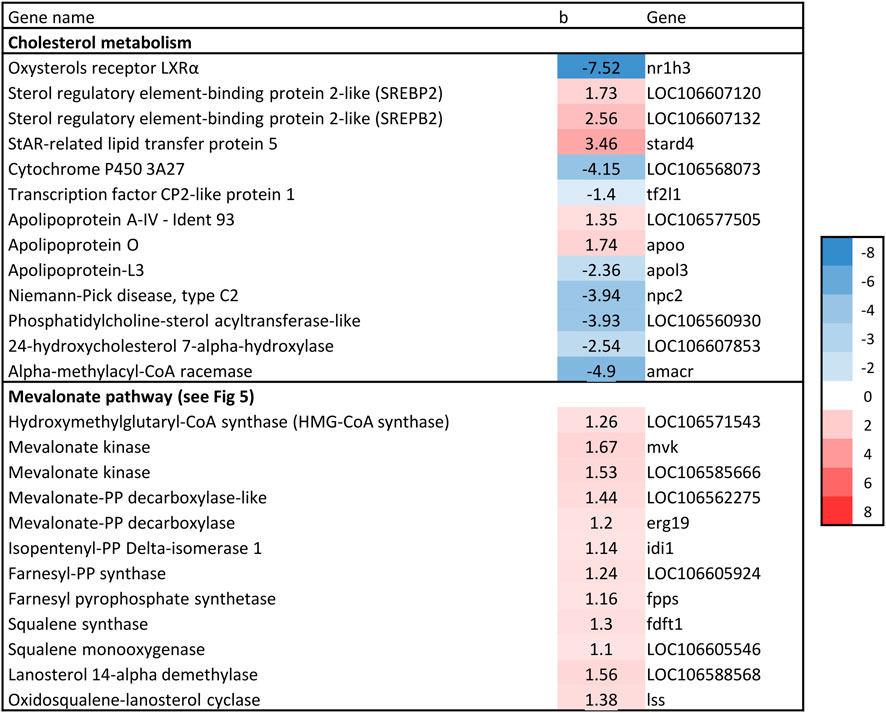
Figure 6. Association between liver fat percentage and hepatic expression of genes involved in cholesterol biosynthesis, b = linear regression coefficient. Color intensity indicate strength of association.
3.4.2 Hepatic de novo lipogenesisTwo of the major regulators that promotes DNL, LXRα and SREBP1c, were negatively associated with increasing liver fat. However, expression of ChREBP, another major regulator of lipogenesis, as well as three isoforms of ATP citrate lyase (ACLY) were positively associated with liver fat (Figure 7). ACLY is a key lipogenic enzyme that links carbohydrate and lipid metabolism by catalyzing production of acetyl-CoA from citrate. Expression of ACCα was also positively associated with liver fat (Figure 7). ACCα produces malonyl-CoA and is regarded as the pace-setting enzyme for fatty acid synthesis, and is induced by ChREBP (Sul and Smith, 2008). In addition, Malonyl-CoA decarboxylase, which catalyzes the opposite reaction of ACCα, was negatively associated with liver fat (Figure 7).

Figure 7. Association between liver fat percentage and hepatic expression of genes involved in fatty acid synthesis and beta-oxidation. b = linear regression coefficient. Color intensity indicate strength of association.
3.4.3 Beta-oxidationOnce fatty acids are activated to acyl-CoAs, they can be esterified by GPAT and enter the glycerol phosphate pathway, or they can be converted to acyl-carnitines by carnitine palmitoyltransferase-1 (CPT1) and then enter the mitochondrion for β-oxidation. Two CPT1 genes were associated with liver fat, but in opposite directions (carnitine O-palmitoyltransferase 1 (liver isoform) and carnitine palmitoyltransferase 1B (muscle isoform), Figure 7). The expression of some genes directly involved in fatty acid beta-oxidation were negatively associated with liver fat. This included Long- and short-chain specific acyl-CoA dehydrogenase which catalyze the first step of mitochondrial fatty acid beta-oxidation, and Enoyl-CoA delta isomerase 2, which is required for degradation of unsaturated fatty acid (Schulz, 2008) (Figure 7). This also included Peroxisomal acyl-coenzyme A oxidase (ACOX1), a rate-limiting enzyme in peroxisomal fatty acid β-oxidation.
3.4.4 Glycerol phosphate pathway - triglyceride and phospholipid synthesisThe first committed step in TAG synthesis via the glycerol phosphate pathway is mediated by glycerol-3-phosphate acyltransferase (GPAT) enzymes (Sul and Smith, 2008), and produce lysophosphatidic acid (LPA). GPAT gene expression was negatively associated with liver fat in the current study, which is in accordance with the expression of SREBP-1, considering that SREBP-1c induces the expression of GPAT1 (Karasawa et al., 2019). Further in the glycerol phosphate pathway, an additional fatty acid is transferred to LPA by the family of 1-acylglycerol-3-phosphate acyltransferase (AGPAT) enzymes to produce phosphatidate (PA) (Sul and Smith, 2008). Four AGPAT genes were significantly associated with liver fat, three of which had a negative association (Figure 8). The final formation of TAG can be catalyzed by several different enzymes, including diacylglycerol:acyl-CoA acyltransferase (DGAT). DGAT expression was negatively associated with liver fat content (Figure 8). Thus, the formation of both LPA, PA and TAG seemed to be decreasing with increasing liver fat.
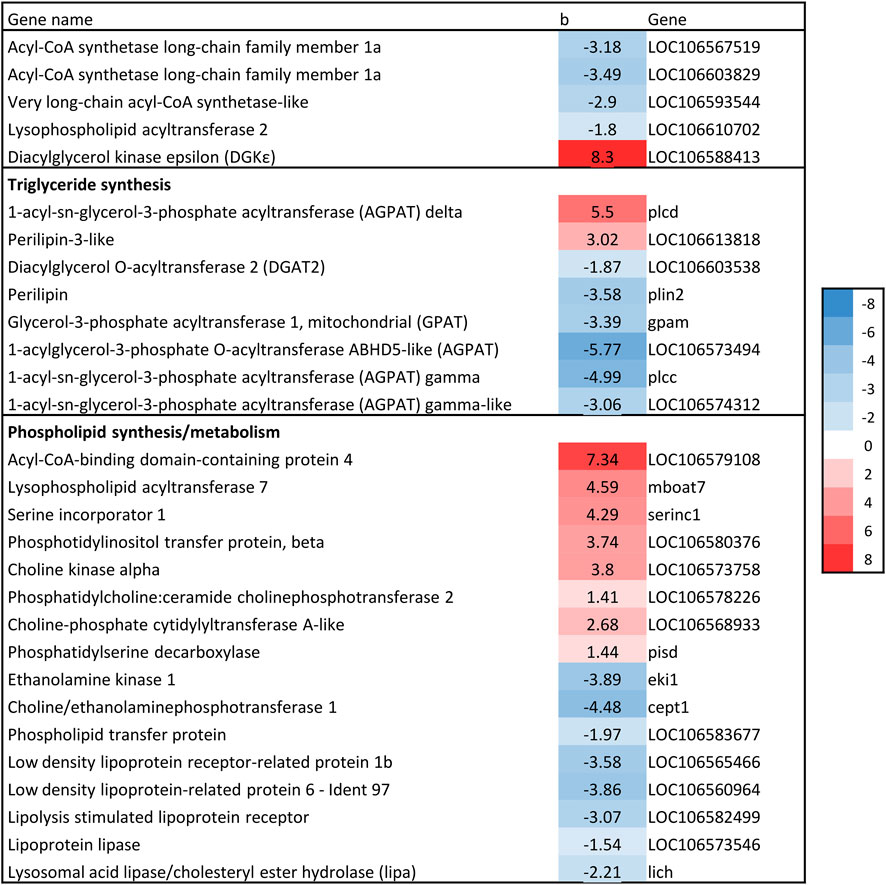
Figure 8. Association between liver fat percentage and hepatic expression of genes involved in Glycerol phosphate pathway. b = linear regression coefficient. p = p-value of association. Color intensity indicate strength of association.
The other branch of the glycerol phosphate pathway is the synthesis of phospholipids (PL). Several genes involved in PL synthesis and metabolism were significantly associated with liver fat (Figure 8). There was a positive association between liver fat and expression of genes catalyzing three steps of phosphatidylcholine (PC) synthesis from choline, indicating increased conversion of choline to PC in fish with higher liver fat accumulation. Also, lipoprotein receptors as well as phospholipid transfer protein were negatively associated with liver fat. All these genes are involved in processes that are likely to alter PL composition.
4 DiscussionIn this study, we investigated the genetic and transcriptomic variation related to individual differences in liver fat content within a group of slaughter-sized Atlantic salmon reared under the same conditions and fed the same diet. Environmental factors that likely contribute to variation in liver lipid deposition include individual differences in feed intake, swimming activity, and stress or disease burden. However, discussions on these environmental factors are outside the scope of this paper.
4.1 Fat content of livers of Atlantic salmonThere are few published reports on accurate measurements of liver fat content of slaughter-sized Atlantic salmon, but previous studies have reported liver fat levels between 5 and 7% for slaughter sized Atlantic salmon fed a medium to high fish-oil feed (Bou et al., 2017; Dessen et al., 2020; Hundal et al., 2022; Ruyter et al., 2006), which is in line with the mean liver fat content of 7.7% in the current study. Based on our results it appears that 4% fat is the lower physiological limit in livers of slaughter-sized Atlantic salmon.
As the fish in the current study were fed a commercial broodstock feed with a relatively high fish-oil content, we would not expect unhealthy high levels of liver fat, because fatty livers have in literature mainly been observed as a consequence of insufficient dietary levels of EPA and DHA in Atlantic salmon (Bransden et al., 2003; Torstensen et al., 2011). However, 37% of the fish were given the second worst liver color score, which implies that there was a high number of fish with livers that appeared pale and fatty, and the chemical analysis revealed that 8% of the fish had liver fat content above 12%. Liver fat of 12% was recently reported in fish fed insufficient EPA + DHA and showed impaired liver metabolic health (Hundal et al., 2022). Thus, it appears that even in Atlantic salmon fed a relatively high fish-oil diet, high levels of liver fat accumulation occurs frequently. However, there is very limited knowledge on the possible health implications of this.
There was no correlation between liver fat % and hepatosomatic index (HSI) (Figure 2), which shows that HSI is not a good indicator of the level of liver fat. This is likely due to the fact that lipids weigh less than protein, so an increase in lipids will not give a corresponding increase in weight. To our knowledge, this is the first time data on HSI and liver fat percentage has been reported on a large number of Atlantic salmon of slaughter size.
4.2 Possibilities for selective breeding to reduce liver lipid accumulationA heritability of 0.38, along with an additive genetic standard deviation of 1.6% fat, shows that there is a great potential for selection for lower fat deposition in liver in Atlantic salmon. A genetic standard deviation of 1.6% corresponds to a genetic coefficient of variation of approximately 20%, which is considered moderate to high and suggests that there is substantial genetic variability within the population. In the context of a breeding program, a CV of 20% implies that selective breeding can effectively increase or decrease liver fat content, depending on the breeding goals. The relatively low genetic correlation with body weight (0.33) implies that selection for lower liver fat can be implemented in selective breeding programs without compromising heavily on growth using selection index theory (Hazel, 1943). Reducing liver fat through selective breeding could lead to healthier fish with improved liver function and overall robustness, which are likely to have better growth rates and feed efficiency, contributing to more sustainable farming practices.
While the dataset was limited in size, the high-precision phenotype is a strength of the estimates obtained. To the best of our knowledge this is the first report of heritability of liver fat in Atlantic salmon, although genotype-specific responses in liver lipid metabolism in Atlantic salmon have previously been shown when fish oil has been replaced by vegetable oil in the feed (Morais et al., 2011a; Morais et al., 2011b). No reports of heritability of liver fat could be found for other fish species, but it has been reported to be a heritable trait in other animal species previously; such as duck (h2 = 0.07–0.14), chicken (h2 = 0.36–0.43) and mice (h2 = 0.22) (Liang et al., 2015; Marie-Etancelin et al., 2014; Minkina et al., 2012). In human, the heritability estimates of NAFLD generally range from 0.2 to 0.7, depending on the study design, ethnicity, and the methodology used (Sookoian and Pirola, 2017).
More than five genes, including PNPLA3, TM6SF2, GCKR, MBOAT7, and HSD17B13, are linked to NAFLD in humans [reviewed in Eslam et al. (2018)]. It is plausible that genetic variants in Atlantic salmon also affect liver fat accumulation. However, our GWAS detected no significant signals. This suggests liver fat in Atlantic salmon is a polygenic trait, with many genes or variants having small effects. Despite testing various models and SNP quality control thresholds, the results remained unchanged. SNP effect sizes have not been published in the aforementioned human studies, although two studies the risk allele effect size for PLPLA3 as a 1.5% increase in hepatic TAG content per allele (Romeo et al., 2008), and a one-unit increase in NAFLD severity score per allele (Namjou et al., 2019). Another reason for the lack of strong QTL signals could be the limited sample size of fewer than 700 fish, which may be insufficient to detect small effect sizes. Future GWAS should include more phenotyped and genotyped fish to increase analysis power and detect QTL signals from regions with small effect sizes. We were able to detect four candidate genes for future validation, two of which were also detected in the gene expression results, but we do not consider them strong candidates based on our study alone.
A major obstacle for implementation of liver fat in breeding programs is the necessity of phenotypic recording across a large number of individuals. Chemical analysis of lipid content, though accurate, is time-consuming and costly. Thus, liver score, a visual assessment of liver color, is often used as an indicator of fatty liver. In this study, we compared liver score and chemical measurements of liver fat. The phenotypic correlation between liver fat and liver score was 0.5 (p < 0.0001), indicating low predictive power. Further, the genetic correlation between these two traits was 0.7 (Table 2). The “break-even” genetic correlation between alternative and reference methods used for genetic validation of a method, is traditionally set at 0.70–0.80 (Mulder et al., 2006; Robertson, 1959). Therefore, liver score is not recommended for genetic analyses or applications requiring high accuracy. This highlights the need for reliable, rapid methods to measure liver fat. A recent study demonstrated hyperspectral imaging as a high-throughput method with high predictive accuracy (Ortega et al., 2024). Other methods like NIR and Raman spectroscopy, developed for fillet lipid content, could potentially be adapted for liver fat measurement.
Selection for reduced liver fat should be considered in the context of feed, as gene-environment interactions may cause the best performers on one feed to rank lower on another. Although these gene-by-feed interactions have not been studied, our results imply a potential to select fish that are better metabolically adapted to the high-energy feeds currently used in salmon farming. Additionally, the results of this study have implications for salmon feed research; given the large genetic variation in liver fat deposition, nutritional studies examining liver fat as a response variable should consider the genetic background of the fish to ensure that feed trial results are not biased by unbalanced genetic material or family effects in feed groups.
4.3 Metabolic profile of high-fat liversThe positive correlations (both phenotypic and genetic) between liver fat and the lipid deposits of muscle (rg = 0.37) and viscera (rg = 0.28) indicate that fish with higher liver fat deposition tend to have higher overall body fat deposition. However, the relatively weak correlations suggest that fish with the highest liver fat do not necessarily have the highest visceral and/or muscle fat (as shown in Figure 2). This points to at least a partially independent regulation of these lipid deposits. As the muscle is the main lipid storage in Atlantic salmon (Aursand et al., 1994), relatively large amounts of lipids can be safely stored there. Fish that deposit lipids in the liver rather than muscle may therefore have a disturbed lipid metabolism and pattern of lipid deposition. The gene expression results of the current study further support this and point to specific metabolic processes involved in liver lipid accumulation in Atlantic salmon.
The expression of numerous genes involved in lipid metabolic processes were associated with liver fat content of Atlantic salmon in the current study. This included fatty acid synthesis, fatty acid beta-oxidation, cholesterol biosynthesis, and phospholipid synthesis, as well as some of the main transcription factors regulating lipid metabolism. It is not possible to determine which of these results are consequences of a high fat level, and which are underlying metabolic differences causing higher liver fat levels in certain individuals. The results do, however, provide new knowledge about the metabolic “picture” in livers of fish with inherent differences in liver fat content. It should be noted that the fish in the current study were subjected to a 2-week fasting period before slaughter, a standard practice in commercial salmon farming. Therefore, the associations proposed here are specific to these conditions, and represent the metabolic picture in a fasted state.
4.4 Increased synthesis and reduced clearance of cholesterolIncreased liver fat accumulation paralleled reduced expression of the major transcription factors LXR and SREBP1, and increased expression of SREBP2. The Liver X receptors are key metabolic regulators that control cholesterol and fatty acid homeostasis, as well as modulate inflammatory and immune pathways in mammals (Hertzel et al., 2008; Liscum, 2008). SREBP-1 and SREBP-2 are major regulators of fatty acid and cholesterol biosynthetic genes, respectively. cDNAs for LXR, SREBP-1 and SREBP-2 have been characterised in Atlantic salmon (Cruz-Garcia et al., 2009; Minghetti et al., 2011). Atlantic salmon express a single LXR gene that is most similar to mammalian LXRα (Cruz-Garcia et al., 2009). SREBP and LXR interact in the regulation of a range of genes key to lipid homeostasis, and this appears to be generally similar in salmon and mammals (Minghetti et al., 2011). SREBP2 is primarily responsible for activation of genes involved in cholesterol synthesis and activate the transcription of mevalonate pathway (cholesterol biosynthesis) genes, such as HMGCR (Liscum, 2008). The positive association between liver fat and SREPB2 expression observed in the current study therefore agrees with the most consistently and highly upregulated group of ge
留言 (0)