
記住我
Stochastic simulation is a cost-effective and powerful tool to optimize breeding programs with reduced experimental costs. Such a tool unlocks possibilities for investigating alternative breeding schemes, in order to maximizing genetic gains of the breeding program at a given input of resources. Software package, ADAM (Pedersen et al., 2009; Liu et al., 2019), has been developed for the purpose of breeding optimization in pig, cattle, fish and plants (Bengtsson et al., 2022; Tessema et al., 2020; Zaalberg et al., 2022; Chu et al., 2020). The tool is also very useful in validating statistical genetic prediction models (Romé et al., 2023; Chu et al., 2021) and in studying methods for preserving genetic diversity in breeding programs (Henryon et al., 2015). Over time the software has been further developed and updated with many features including extension to non-additive genetic models (Chu et al., 2024), indirect genetic effects (Chu et al., 2021), categorical traits (Gebreyesus et al., 2020), definition of true inbreeding (Henryon et al., 2019), or extension to plant breeding (Liu et al., 2019).
ADAM (Pedersen et al., 2009) simulates genotypic effects for each allele in a quantitative trait locus (QTL). This model is unique from other software like AlphaSim (Gaynor et al., 2021; Faux et al., 2016), ChromaX (Younis et al., 2023), MoBPS (Pook et al., 2020), SeqBreed (Pérez-Enciso et al., 2020) and XSim (Chen et al., 2022) that use substitution genotypic effects of QTL. However, all of these tools including ADAM assume a bi-allelic state of each segregating QTL. This assumption might come from current, common genetic models (Christensen et al., 2012; VanRaden, 2008; Falconer and Mackay, 1996) that assume substitution effects of one allele to its alternative. While the bi-allelic state of marker loci is due to the common choice of genotyping technology that yield single nucleotide polymorphism (SNP). The assumption of bi-allelic QTL may not true for all QTL. Multiple alleles have been shown in numerous QTL (Biová et al., 2024; Jiang et al., 2020). In addition, multi-allelic models of QTL are more reasonable explanations for different functional genetic effects from unrelated populations (González-Diéguez et al., 2021).
Multi-allelic models have been developed for genomic prediction in diploid species (Álvarez-Castro and Crujeiras, 2019; Álvarez-Castro and Yang, 2011; Yang and Álvarez-Castro, 2008; Da, 2015). Relevant model based on haplotype blocks also have been shown for genomic prediction (Weber et al., 2023). Thérèse Navarro et al. (2022) has developed a package for genome wide association studies (GWAS) of polyploid populations with multi-allelic models, but only the additive genetic effects were included in the model. For the purpose of simulation, however, we are not aware of any studies that have used multi-allelic models with additive, dominance and epistatic genetic effects, or accounting for different levels of ploidy.
In addition to bi-allelic assumptions, earlier version of ADAM (Pedersen et al., 2009; Liu et al., 2019) use was limited to diploid species only. Many economically important species like potato, banana, sugar cane and some fish orders of salmonids and common carps are polyploid. Extension of simulation models to different ploidy levels is necessary for ADAM (Pedersen et al., 2009; Liu et al., 2019) to design complex breeding schemes for these species.
This paper will describe new features of software package, now called ADAM-Multi, for simulating breeding programs for plants and animals. The focus will be on description of genotypic models for simulating traits with genotypic effects of additive, dominance, and epistatic genetics for species with different ploidy levels including extensions to multi-allelic assumptions. The methods implemented are illustrated in two examples that study the effects of different assumptions on number of alleles, ploidy level and different prediction models used in selection.
2 Materials and methods2.1 Genotypic models for simulationWe aim to simulate genotypic effects that are generalized to multi-allelic QTL with number (nB) of alleles, and the genome with ploidy level of nploidy. Assuming a QTL with alleles B1, B2,…, BnB, ADAM-Multi uses following model to simulate additive genotypic value (a) at one locus:
a=∑iBnBtiBaaiB=t1aa1+t2aa2+…+tnBaanB(1)where a is the additive genotypic value of a QTL; aiB is genotypic additive effect of allele BiB (or called iB for short) at the QTL; tiBa is the additive covariate for allele iB that is scaled genotype dosage calculated as in the AlphaSimR software (Gaynor et al., 2021):
tiBa=tiB−nploidy22nploidy(2)where tiB is a raw genotype dosage, or number of copies of allele iB at the locus, nploidy is the ploidy level of genome. Key notations are defined in Table 1.
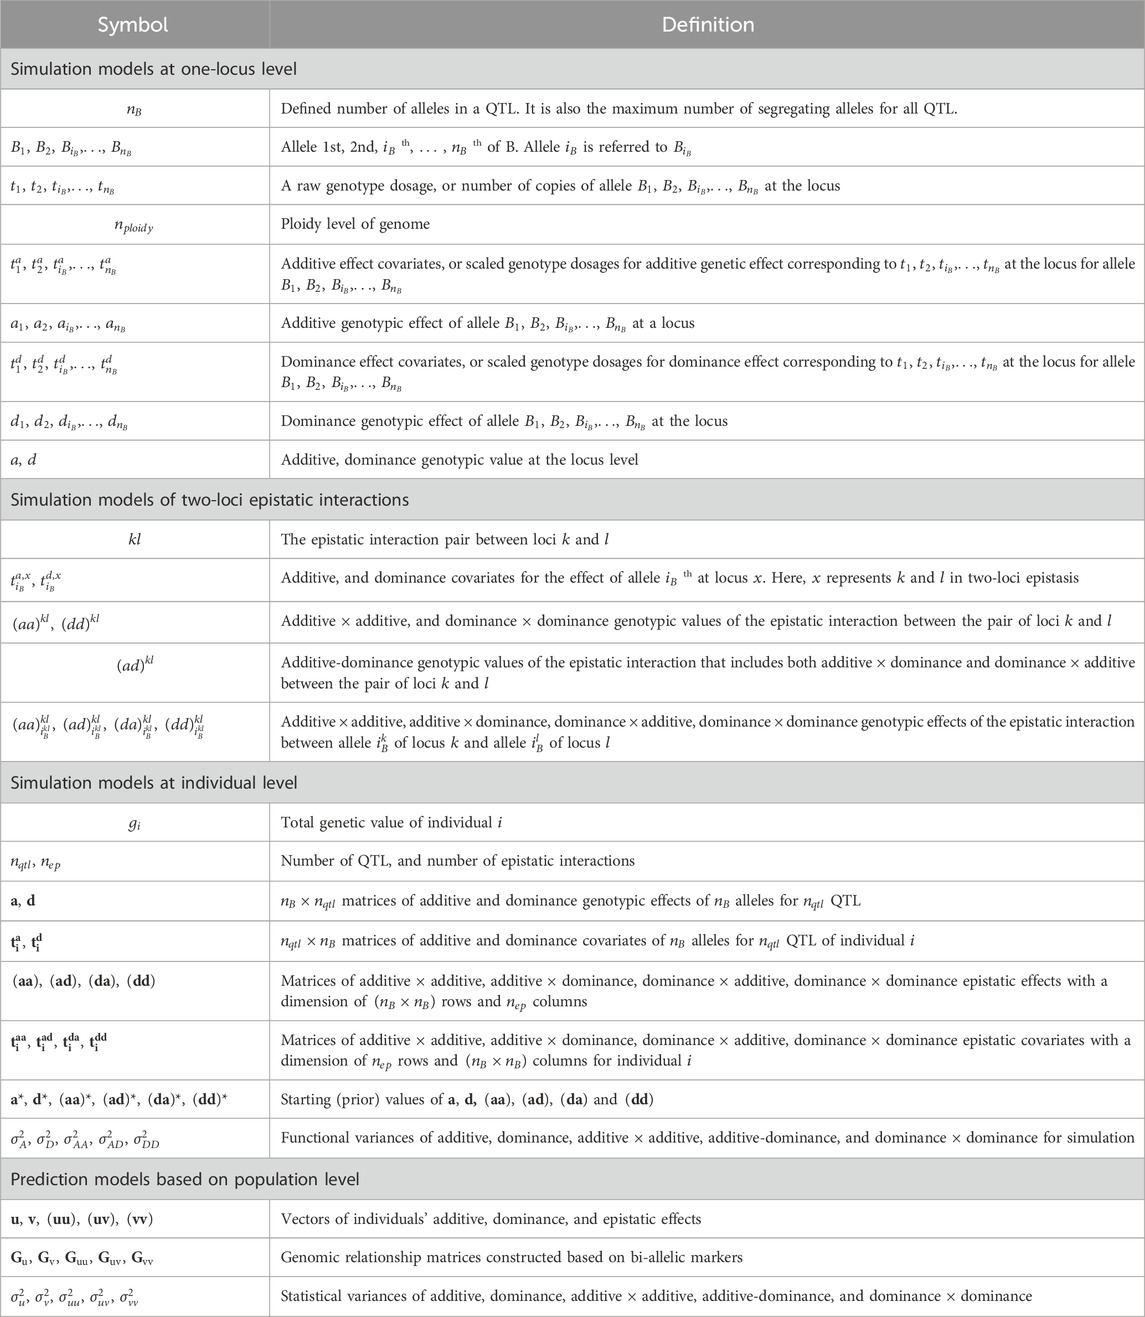
Table 1. List of key symbols.
Similarly, the genotypic model for dominance value (d) of a QTL at the locus level is:
d=∑iBnBtiBddiB=t1dd1+t2dd2+…+tnBddnB(3)where diB is dominance genotypic effect of allele iB; tiBd is the dominance covariate for allele iB that is scaled genotype dosage calculated as in AlphaSimR (Gaynor et al., 2021):
tiBd=tiBnploidy−tiB2nploidy2(4)This simulation model assumes digenic dominance for each allele, i.e., each allele has the same dominance effect with all other alleles. Table 2 shows examples of t, ta and td for diploid and tetraploid genome assuming nB=2 with allele B1 and B2.
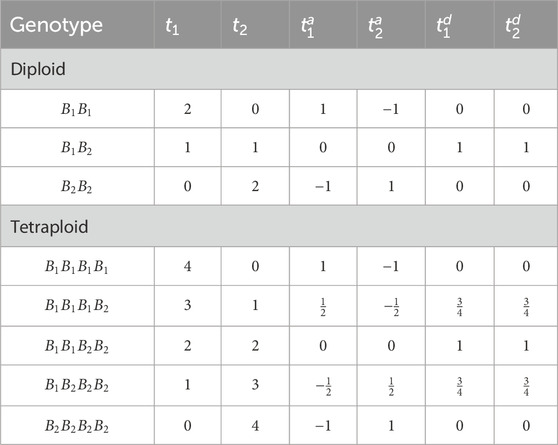
Table 2. Conversion from raw genotype dosages (t1, t2) to additive (t1a, t2a) and dominance (t1d, t2d) covariates when assuming bi-allelic loci.
The simulation model for additive × additive genotypic value aakl of the two-locus epistatic interaction between the pair of loci k and l:
aakl=t1a,lt2a,l…tnBa,l⊗t1a,kt2a,k…tnBa,k⋅aa1klaa2kl…aanB×nBkl(5)where t1a,xt2a,x…tnBa,x is a vector of additive covariates for locus x (k or l) with nB elements; ⊗ denotes the Kronecker product; denotes the symbol for matrix multiplication; aa1klaa2kl…aanB×nBkl is vector of additive × additive genotypic effects that have nB×nB elements. In Equation 5, the number of alleles in loci k and l are the same, and equal to nB. Simulation models in this paper consider a fixed number nB for all QTL, even if not all alleles in a QTL are segregating. Genotypic models in case of arbitrary number of alleles for QTL that set the effects of non-segregating alleles to zero can be found in Supplementary Appendix 1.
The simulation model for additive-dominance genotypic value adkl of the epistatic interaction is the sum of additive × dominance and dominance × additive interaction between the pair of loci k and l:
adkl=t1d,lt2d,l…tnBd,l⊗t1a,kt2a,k…tnBa,k⋅ad1klad2kl…adnB×nBkl+t1a,lt2a,l…tnBa,l⊗t1d,kt2d,k…tnBd,k⋅da1klda2kl…danB×nBkl(6)where t1d,xt2d,x…tnBd,x is a vector of dominance covariates (Equation 4) for locus x with nB elements; ad1klad2kl…adnB×nBkl and da1klda2kl…danB×nBkl are vectors of additive × dominance (adxkl), and dominance × additive (daxkl) genotypic effects that have nB×nB elements. The value adxkl is different from daxkl.
The simulation model for dominance × dominance genotypic value ddkl of the epistatic interaction between the pair of loci k and l:
ddkl=t1d,lt2d,l…tnBd,l⊗t1d,kt2d,k…tnBd,k⋅dd1kldd2kl…ddnB×nBkl(7)where dd1kldd2kl…ddnB×nBkl is vector of dominance × dominance genotypic effects that have nB×nB elements.
So far, the simulated genotypic values were presented at the levels of locus and loci pairs. Here, we present the model for simulating genotypic value at the individual level, which is the sum effects of all QTLs and epistatic pair interactions. The model in a matrix form for total genotypic value gi of individual i is:
gi=trtia⋅a+trtid⋅d+trtiaa⋅aa+trtidd⋅dd+trtiad⋅ad+trtida⋅da(8)where a is a nB×nqtl matrix:
a=a1j1a1j2…a1nqtla2j1a2j2…a2nqtl…………anBj1anBj2…anBnqtl,where nqtl is the number of QTL; aiBjqtl is the additive genotypic effect of allele iB at QTL jqtl; tia is a nqtl×nB matrix:
tia=t1,ia,1t2,ia,1…tnB,ia,1t1,ia,2t2,ia,2…tnB,ia,2…………t1,ia,nqtlt2,ia,nqtl…tnB,ia,nqtl,where tiB,ia,jqtl is the additive covariate of allele iB at QTL jqtl of individual i. tiB,ia,jqtl can be calculated based on the genotype of individual i at locus jqtl using Equation 2; tr is the trace of a matrix. Similarly, d is a nB×nqtl matrix of dominance genotypic effects; tid is a nqtl×nB matrix of dominance covariate of individual i. Matrix aa has a dimension of nB×nB rows and nep columns:
aa=aa1,1klaa2,1kl…aanep,1klaa1,2klaa2,2kl…aanep,2kl…………aa1,nB×nBklaa2,nB×nBkl…aanep,nB×nBkl,where nep is number of epistatic interactions between pairs of loci;aajep,iBk,iBlkl is the epistatic additive × additive effect at the interaction pair jep between allele iBk of locus k and allele iBl of locus l. tiaa is a matrix with nep rows and nB×nB columns.Row jep th of tiaa is set up as in Equation 5. For example,
tjep,iaa=tjep,1,ia,ltjep,2,ia,l…tjep,nB,ia,l⊗tjep,1,ia,ktjep,2,ia,k…tjep,nB,ia,k,where tjep,iBx,ia,x is the additive covariate of allele iBk of QTL k or allele iBl of QTL l at the interaction pair jep for individual i.
Similarly, dd is a nB×nB×nep matrix of dominance × dominance genotypic effects; tidd is a nep×nB×nB matrix of dominance × dominance covariates of individual i. The genotypic additive-dominance effects consist of two components: additive × dominance trtiad⋅ad and dominance × additive trtida⋅da. Similar to dd, matrices ad and da have dimension of nB×nB×nep. tiad and tida are matrices with nep rows and nB×nB columns. Row jep th of tiad is set up as in Equation 6. For example,
tjep,iad=tjep,1,id,ltjep,2,id,l…tjep,nB,id,l⊗tjep,1,ia,ktjep,2,ia,k…tjep,nB,ia,k,where tjep,iBx,id,x is the dominance covariate of allele iBk of QTL k or allele iBl of QTL l at the interaction pair jep for individual i. Row jep th of tida is:
tjep,ida=tjep,1,ia,ltjep,2,ia,l…tjep,nB,ia,l⊗tjep,1,id,ktjep,2,id,k…tjep,nB,id,k.2.2 Stochastic simulationDetails of simulation steps and theoretical principles of ADAM-Multi can be found in previous version by Pedersen et al. (2009) and Liu et al. (2019). These principles are also similar to those in AphaSim (Gaynor et al., 2021). Simulation of genomic models with ADAM first starts with founder haplotypes of a defined genome structure. To create linkage disequilibrium (LD) between QTL and markers, ADAM-Multi can be used in case of multi-allelism. Other packages such as QMSIM (Sargolzaei and Schenkel, 2009) and AlphaSim (Gaynor et al., 2021) do not support multi-allelic models, but they can be used to generate the genome with a specified degree of LD in case of bi-allelic loci. The genotypic effects of alleles in QTLs are sampled, and then centered and scaled to user-defined parameters using the founders’ QTL haplotypes (Chu et al., 2024). Steps for generating additive effects of alleles a (nB×nqtl matrix) in ADAM-Multi are:
- Sampling: Each element of matrix as is sampled from a user-defined normal distribution, e.g., mean of zero and additive variance σA2 [or N(0, σA2)]. Matrix as with the same dimension as a contains starting values of additive effects.
- Centering: Based on matrix as and genotypes of a founder population, we can calculate population mean at each QTL locus. Additive effects of alleles within each QTL (each row of as) are centered to achieve population mean of zero. For example,: aiBj
留言 (0)